The paths followed by crime and incarceration in the United States have been mirror images of one another over the past two decades. This can be clearly seen in the graph below, which I prepared for an upcoming conference presentation.
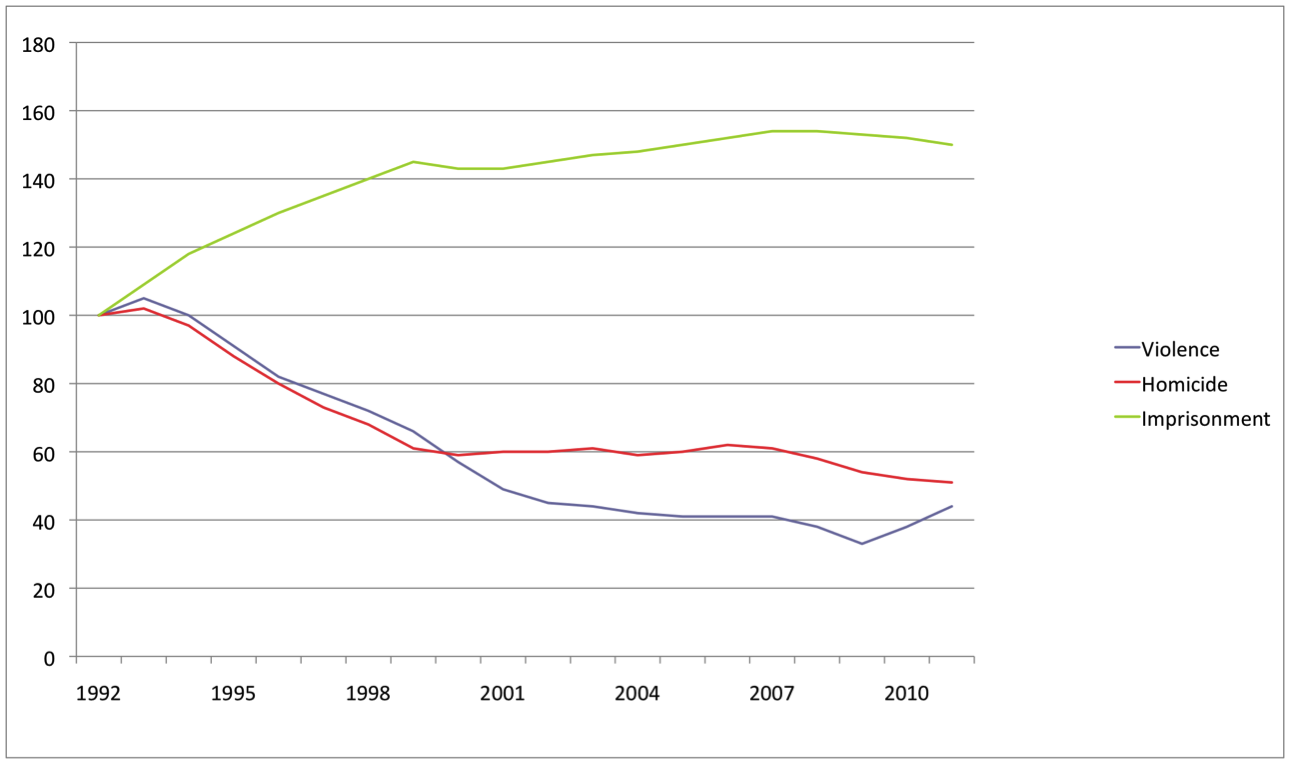
The graph depicts year-by-year rates of imprisonment, homicide, and violent crime (the latter based on results from the National Crime Victimization Survey), indexed to 1992 rates. The mirroring effect is most pronounced if you compare imprisonment (green line) with homicide (red): between 1993 and 1999, imprisonment goes up at almost precisely the same rate that homicide goes down; in 2000, there is an abrupt leveling off in both areas; and neither has seen a lot of change since. The violent victimization line (blue) mostly tracks the homicide line, save for an additional three years of rapid decline (1999-2002) and a notable uptick between 2009 and 2011.
The mirror-image paths might seem counterintuitive. Shouldn’t less crime translate into less imprisonment? Let me suggest three theories to account for what has happened.
First, there is the “rational equilibrium adjustment” theory. On this theory, increases in imprisonment between 1993 and 1999 drove crime down. When we stopped increasing imprisonment, we also stopped making progress in fighting crime, thereby establishing a new crime-prison equilibrium that has remained more-or-less constant for more than a decade.
This theory could, in fact, be fit within a larger narrative about crime and imprisonment. Violent crime exploded in the U.S. between the early 1960’s and the mid-1970’s, but the U.S. imprisonment rate remained relatively constant. Beginning in the mid-1970’s and continuing through the late 1990’s, the U.S. criminal-justice system belatedly responded to increased violence with increasing severity in charging, sentencing, and corrections administration. Imprisonment increases continued after crime increases stopped because there was still a lot of “catching up” to do, recalling that violence spiked for more than a decade before imprisonment started to move. We stopped ratcheting up penal severity as soon as we got violence levels safely below the 1970’s-era peaks that originally triggered the imprisonment boom.
I think there is some truth to this theory, but it also has some significant problems.
For one thing, the relationship between crime and imprisonment is much more complicated and uncertain than I’ve made it out to be, and it is highly doubtful that we could, in any straightforward way, select our crime rate simply by setting our imprisonment level. Indeed, if we took a longer view than I’ve depicted in the graph, we would see that the apparently neat connection between crime and imprisonment since 1993 may be an anomaly. While imprisonment rates grew much more rapidly from 1975 to 1993 than they did afterwards, crime rates followed no consistent pattern during that time period. Indeed, the explosive growth of the American prison population in the 1970’s and 1980’s did not prevent a major escalation of violent crime in the late 1980’s and early 1990’s (the peak of which is reflected at the far left of the graph.) Bottom line: imprisonment rates affect crime rates, but the reverse is also true; moreover, both imprisonment and crime are also affected by any number of other social forces. It is unlikely that the “great American crime decline” of the 1990’s (to quote Frank Zimring) was solely the result of increased toughness in the criminal-justice system. (Indeed, as Zimring has observed, the crime decline of the 1990’s was actually a broad, international phenomenon that also touched nations that did not follow the get-tough path of the United States.)
Another difficulty or gap with the “rational equilibrium adjustment” theory is that it does not explain why we stopped where we did. If crime could be decreased in a linear fashion by imprisoning more people, and if the imprisonment increases of the 1990’s reflected a rational social policy choice to do so, why were we apparently satisfied with returning to the violence levels of the early 1970’s? Why not go all the way back to the early 1960’s? Or even lower?
And who is this “we” anyway? In truth, U.S. imprisonment levels result from a myriad of different decisions made by many diverse actors with competing interests and minimal communication across institutional lines, let alone centralized coordination–cops, prosecutors, judges, parole boards, probation officers, and legislators spread over 50 states and thousands of local jurisdictions. In some theoretical sense, all are accountable to “the people,” but it seems quite implausible that the American public deliberately “chose” the crime-imprisonment equilibrium that has prevailed since about 2000. I’ve recently spent some time with this fascinating report produced by the National Center for State Courts in 2006, which analyzed national polling data regarding sentencing. The researchers found that a large majority of Americans (about 60 percent) incorrectly believed that violent crime had increased over the past five years. The researchers also found a sizable minority (nearly 45 percent) who did not know that U.S. incarceration rates are generally higher than those found elsewhere in the world. Finally, only about 18 percent of respondents expressed the view that sentencing policies were “working pretty well.” Given such high levels of misinformation and dissatisfaction, it is hard to believe that the current state of affairs is simply a straightforward matter of rational public choice.
So, let’s consider a second possibility, the “crime-wave catchup” theory. Here’s the story: as violence spiked in the late 1980’s and early 1990’s, criminal-justice resources remained constant, which means that demand for incarceration far outpaced the system’s capacity to deliver incarceration. Crimes went unsolved; prosecutors declined serious cases or offered generous plea bargains in order to stay on top of exploding dockets; parole boards became more generous in order to save prisons from dangerous overcrowding; and so forth. By the time the wave of violence began to recede in 1993, there were a lot of people loose in the community who had done some pretty bad things — people who would have been in prison if the system had not been overwhelmed by a crime wave. The next six years of steadily declining violent crime provided the system with an opportunity to catchup on this backlog, resulting in a burgeoning prison population.
It is not clear, though, why imprisonment rates have remained high even now, many years after the backlog was taken care of. Prison sentences for violent crime average about eight years, and the median sentence is only about four years, so it is seems unlikely that a large percentage of today’s prisoners are still serving sentences that were imposed in the 1990’s. To be sure, recidivism rates among recently released prisoners are high, and many return to prison, either as a result of new sentences or revocations of parole. The revolving door phenomenon means that high imprisonment rates may have a tendency to perpetuate themselves for many years. But, even at that, the great crime-wave cohort of the late 1980’s and early 1990’s is in its forties now — an age bracket in which criminal tendencies decline markedly. As that cohort gradually disappears from the system, it seems that the reduced criminality of the younger generation should eventually be manifested in falling rates of imprisonment (assuming that system severity remains constant).
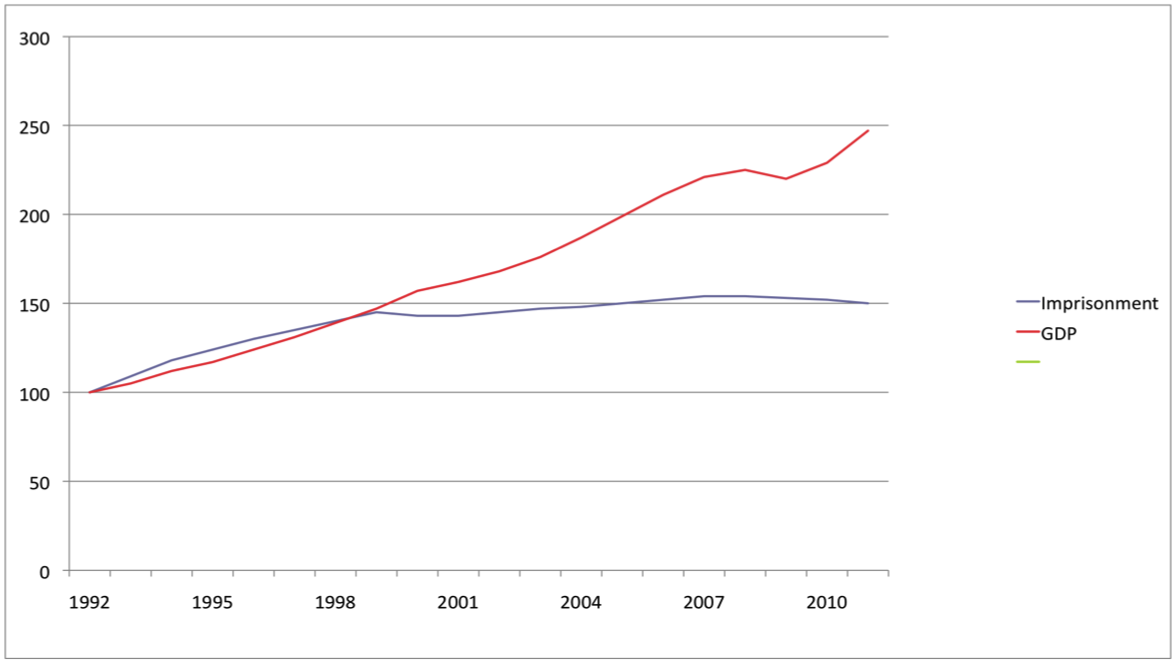
Before proposing my third theory, let me present another graph, which depicts imprisonment rates (blue line) and U.S. gross domestic product (red), indexed to 1992.
This graph may illuminate the “supply-side,” a/k/a “if you build it, they will come,” theory. Here’s the story: The crime wave of the late 1980’s and early 1990’s created the political impetus for building U.S. imprisonment capacity. (Such capacity is only in part, I suspect, a function of the number of prison beds, but is also likely a product of such disparate additional factors as the severity of sentencing laws; the number and efficiency of police officers, prosecutors, and judges; and perhaps general social beliefs regarding crime and criminals.) Capacity grew swiftly across the 1990’s, and imprisonment grew along with it, reflecting to some extent both rational equilibrium adjustment and crime-wave catchup. Although crime was actually falling over this period of time, the public did not understand this to be the case, and those working in the system, who benefitted from a massive infusion of new resources, had little incentive to correct public misunderstandings.
However, the imprisonment growth of the 1990’s was economically unsustainable; note that imprisonment growth outpaced GDP growth in that decade. Although short-lived, the 2001 recession was an important reality check for policymakers, and brought the capacity-building era to an end. It probably helped that the crime-wave catchup needs had been met been then. Moreover, while the public may not have been consciously aware of declining crime rates, there was likely some inchoate sense that things weren’t quite as bad as they had been. For instance, as detailed in the NCSC report, the frequency that crime was mentioned as the nation’s top problem in public-opinion polls fell steadily for a decade after its all-time peak in 1994. In short, the political will to embark on major new spending in the criminal-justice area dried up.
It is one thing to say no to new initiatives, but quite another to start dismantling existing programs. The public officials, private contractors, and others with an economic stake in existing programs will fight to keep them. But to continue to justify the programs to policymakers and budget-writers, it is necessary to show that the programs are being fully utilized.
California offers the best example of how this played out with imprisonment in the early 2000’s. Long after it was obvious to nearly every thoughtful observer that the state’s draconian “three strikes” law — the nation’s harshest — was a train wreck of a criminal-justice policy, the California Correctional Peace Officers Association — the nation’s most powerful prison guards’ union — continued to fight tenaciously and successfully to keep the law in place, thereby ensuring full prisons and plenty of jobs for prison guards. (This story is recounted in Josh Page’s great book, “The Toughest Beat.“)
Although I would not suggest that this is the only cause for the post-2000 equilibrium — imprisonment is high while crime is low — it does seem likely that the political and economic interests of those who benefitted from the expansion of imprisonment capacity in the 1990’s plays a significant role.
The dynamics I’ve described here seem consistent with the research of William Spelman, which I discussed in more detail in this article. Spelman has performed a multivariate regression analysis of state prison population trends from 1977 to 2005. Holding other variables constant, he found a strong relationship between a state’s level of capital spending on prisons and its subsequent level of imprisonment. As he put it, “Prison populations are largely driven by available capacity; when the money was available to increase capacity, policy makers spent it; when the beds were available, criminal justice agencies filled them.”
In other words, if you build it, they will come.