The City of Milwaukee recently filed a formal challenge to the 2020 census count, which showed a population decline of 17,600 since 2010. The city argues that the Census Bureau undercounted the number of housing units in the city by about 2,400 and furthermore overestimated the vacancy rate by about 4,000 units. They allege “an undercount of approximately 15,800 people (based on 2020 average household size).” If true, this would place Milwaukee’s 2020 population at nearly the same total as 2010—rather than the significant loss measured by the census.
The Census Bureau provides only narrow grounds for a challenge. They will mainly just consider claims that certain housing units were missed or mislocated. Besides making this narrow argument, the city also points to several other reasons to believe an undercount occurred. I will consider each below. I find some of the arguments more plausible than others. A smaller census undercount of approximately 6,000 seems most consistent with the available evidence.
Mislocated incarcerated people
According to a challenge submitted by the Wisconsin DOA and endorsed by Milwaukee, 700 inmates at the Milwaukee County Jail located in the city of Milwaukee were erroneously counted at the Milwaukee County House of Correction in Franklin. I haven’t been able to track down the official files associated with this census challenge, but this appears to be an open-and-shut case. The City of Milwaukee should gain 700 people mistakenly counted in Franklin.
A housing unit undercount
The 2020 census measured 257,723 housing units in Milwaukee. The city maintains its own detailed administrative data tracking housing units. After reviewing a variety of sources, city staff identified “at least 260,132 eligible housing units meeting Census criterion [that] existed as of the April 1, 2020 enumeration date.” This 2,394 unit undercount is the centerpiece of the city’s formal challenge.
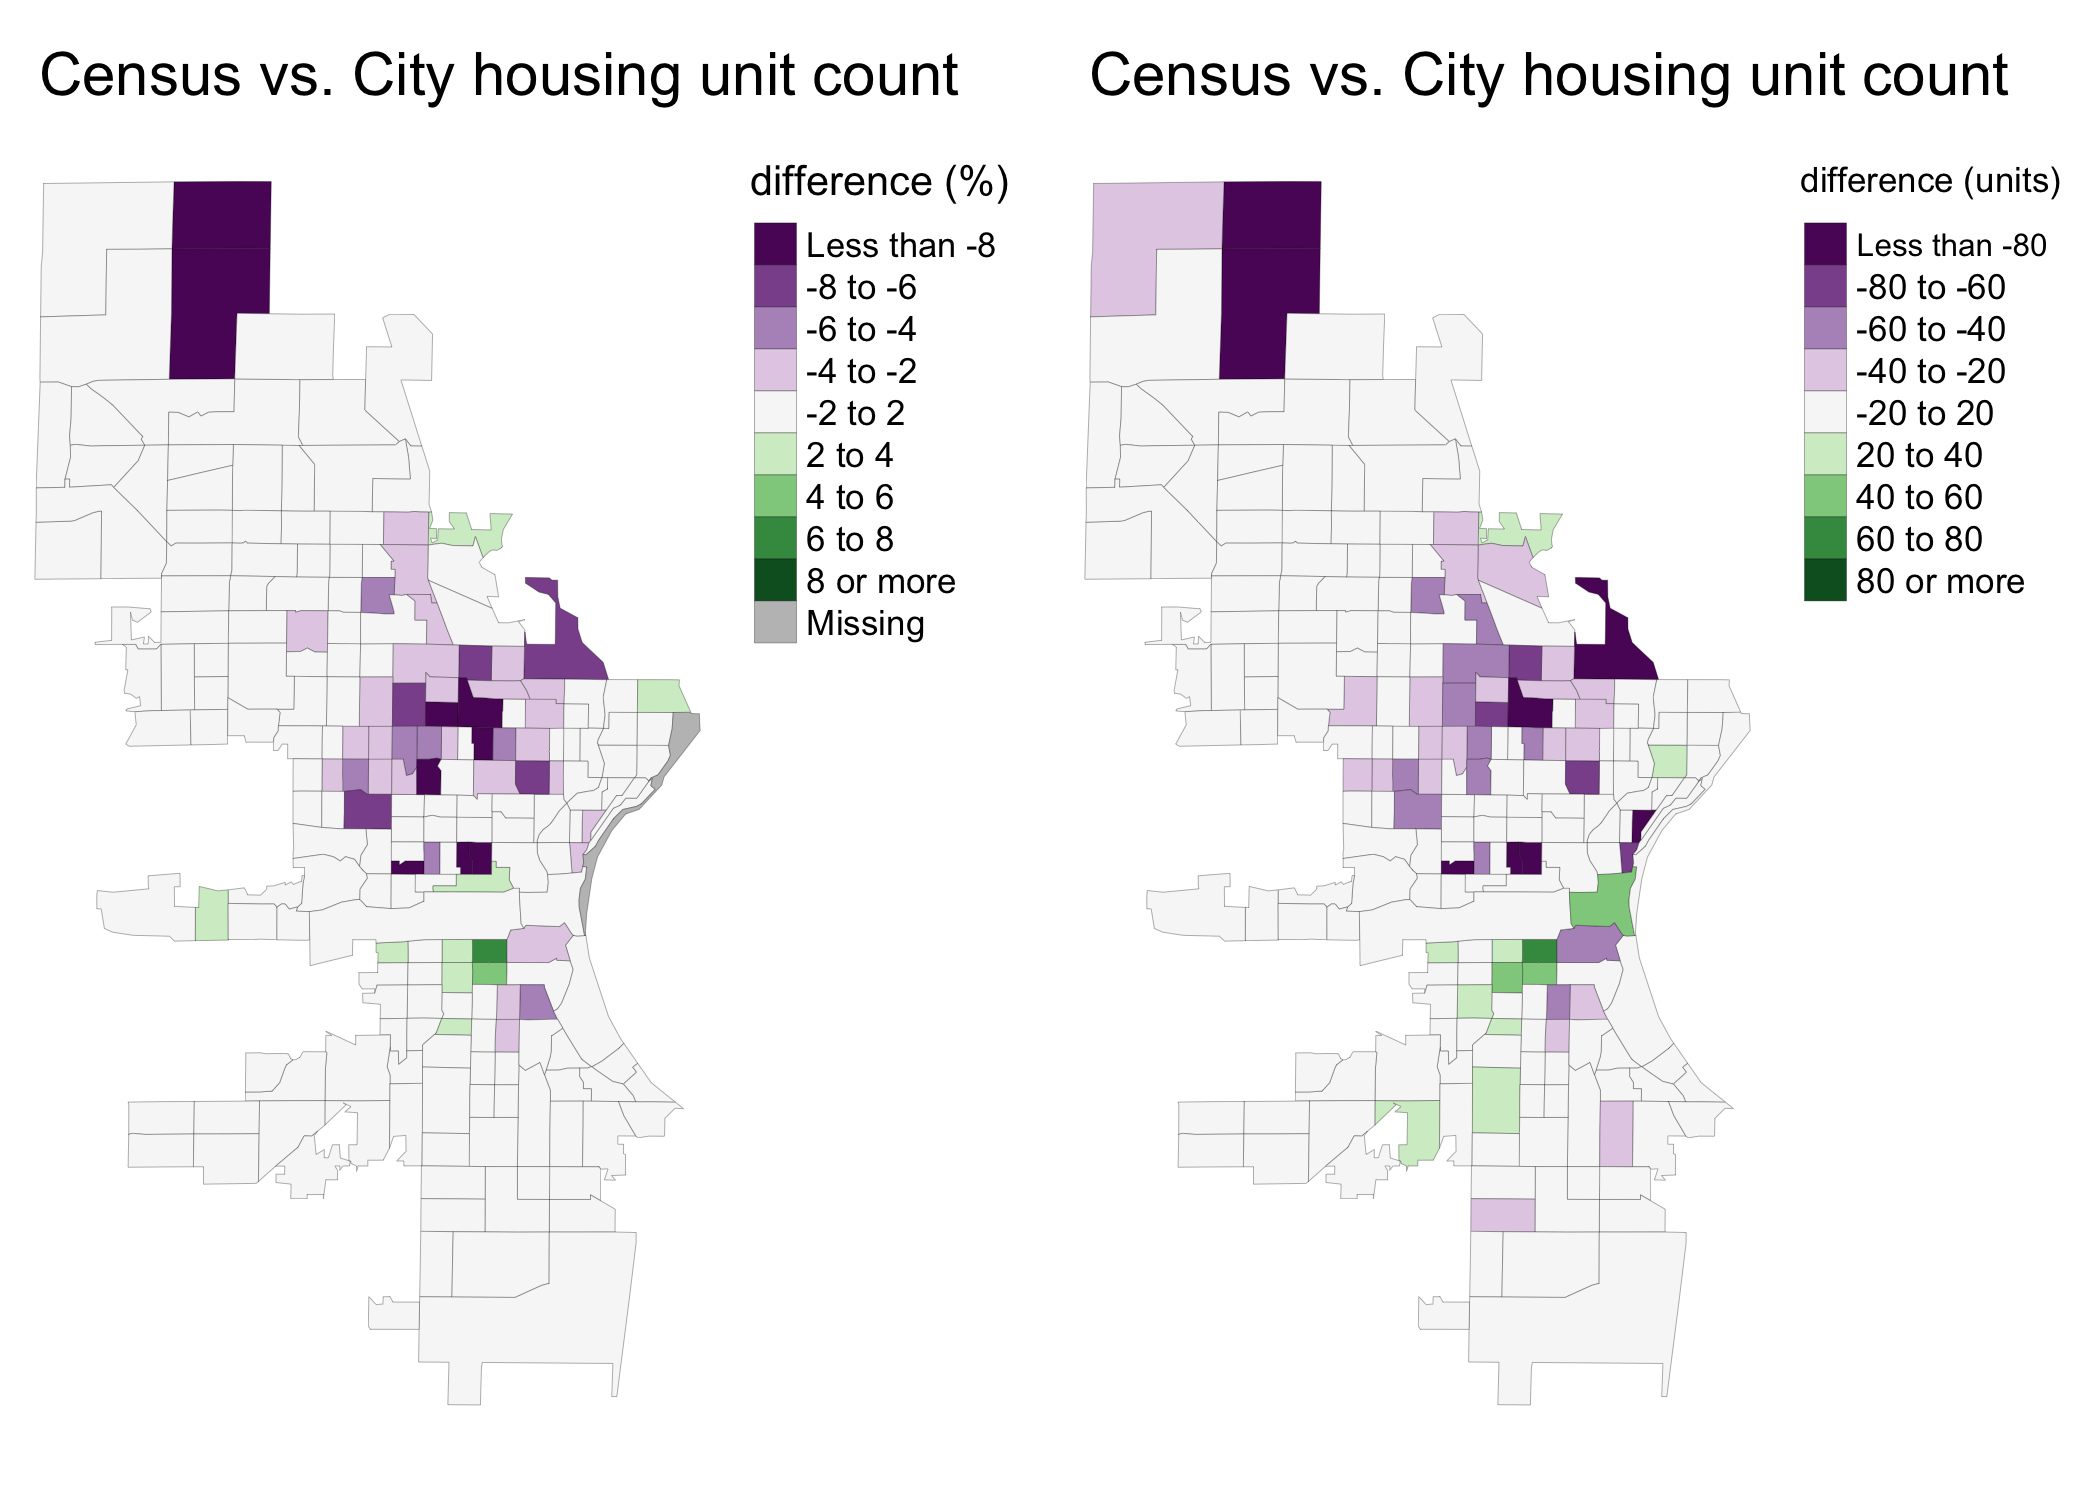
The Census Bureau began algorithmically fuzzing data in the 2020 census to protect respondent privacy.[1] Consequently, block-level statistics need to be aggregated into larger groups before analysis. A distinct pattern emerges at the tract level. In most place, census and city tallies of housing units closely match, but the census consistently comes in lower across the near north side.
Given the quality of the city’s data and the care they put into their investigation, I find this figure convincing. To calculate the number of people likely omitted, we first multiply the number of missing units by the occupancy rate, then multiply the product by the average household size. This equals 5,226 people. (See Appendix A for details).
Vacancy rates
The city further argues that the 2020 census classified too many housing units as vacant, based on a comparison with USPS data, published by HUD. For various reasons, these data are known to include a higher number of residential addresses than counted by either the City or Census.[2] Despite this larger universe (278,000 addresses), the USPS identified fewer vacant addresses than the 2020 census, about 18,300. That works out to a vacancy rate of 6.6%. In contrast, the 2020 census found 22,313 vacant units, for a rate of 8.7%.
| USPS count of residential addresses |
| City of Milwaukee, average of Q1 and Q2 of 2020 |
| total |
vacant |
no-stat |
| total |
0-3 months |
3+ months |
| 277,511 |
18,252 |
264 |
17,988 |
16,206 |
| Source: HUD Aggregated USPS Administrative Data on Address Vacancies |
In other words, the census counted about 4,000 more vacant units than the postal service in early 2020. Multiply this number by the average household size (2.39) and you get about 9,560 more people. Add this to the 5,226 from missing housing units and the 700 misplaced inmates and you’re left with 15,500 more Milwaukeeans.
However, I’m very skeptical that the USPS vacancy number is more accurate than the census because the two institutions define “vacancy” in such different ways.
For the Census Bureau, a “vacant” property is one where no one lives right now but which remains habitable. To be uninhabitable, the property must be literally boarded up or exposed to the elements (e.g., a caved-in roof).[3]
The USPS defines vacancy differently. First, they rarely bother classifying a property as “vacant” if it has been unoccupied for just a few months.[4] On average, USPS data for Milwaukee lists an average of just 323 properties vacant for fewer than three months.[5] Obviously this is not an accurate measure of short-term vacancies. On any given day, many more units are empty as people move in and out. Zillow alone lists over 1,000 units available for rent and 400 homes for sale as of January 4, 2022.
The postal service doesn’t just rarely classify briefly unoccupied rentals as “vacant.” It also differs from the census in its treatment of longer-term vacancies. Recall the Bureau’s strict definition of uninhabitable—boarded up or exposed to the elements. By contrast, the USPS classifies addresses as “no-stat” if they “have been, more or less, abandoned.”[6] Over 16,000 properties were classified this way at the time of the 2020 census.
Compared to the census methodology, the USPS both excludes briefly vacant rentals and long-term “abandoned” but technically habitable properties from its count of residential vacancies. In my view, this makes a 4,000-unit gap between Census and USPS vacancy counts unsurprising.[7]
These gaps are standard across the country. Among the 609 counties with at least 100,000 people, 607 saw a higher vacancy rate in the census data than the comparable USPS period, and in most counties, the percentage difference far exceeded that of Milwaukee.[8] In fact, across all counties in the country, the USPS counted 10 million fewer vacant addresses than the census. Clearly, these aren’t directly comparable measures.
Undercounts of Black and Latino residents
Across the nation, the Census Bureau estimates that the 2020 census undercounted Black or African American residents by 3.3% and Hispanic or Latino residents by 4.99%. White residents were overcounted by 1.64%. All of these results are statistically significant.[9]
As the city’s challenge demonstrates, simply applying these national proportions to Milwaukee would increase the Black population by about 7,200 and the Latino population by 5,800, while reducing the white population by about 3,100. Applied across all population groups, the net change would be an extra 9,906 Milwaukeeans.
How reasonable is simply multiplying the national error rates by Milwaukee’s population? On the one hand, Milwaukee’s extreme segregation might suggest that any race-based disparity would be fully represented here. On the other hand, the Bureau’s evaluation found that the undercounts were concentrated in Arkansas, Florida, Illinois, Mississippi, Tennessee, and Texas. Wisconsin’s statewide count was accurate.[10]
The pattern of census housing unit undercounts (compared to the city) tells a mixed story compared to the national trends. Practically all of the missing housing units, 96% percent, are in majority or plurality Black neighborhoods. By contrast, mostly Latino tracts actually saw a slight overcount of housing units, compared to the city’s tally.
The national trend of census undercounts of Black and Latino residents could’ve happened in Milwaukee, but it is only partially consistent with the housing unit data. Let’s turn next to the final argument made by the city—comparing the low census count with other higher estimates.
The decennial census vs. other population measures
The city pointed out that the 2020 census count of 577,222 was much lower than the 2019 1-year American Community Survey (590,157) and the January 2021 WI DOA estimate of 587,796—both calculated without knowledge of the 2020 census result.
Official Census Bureau guidance cautions that the Population Estimates Program (PEP), not the American Community Survey, should be used for intercensal population estimates.[11] The ACS population totals are in turn derived from PEP, so the city’s point about the 2020 census coming in lower than expected remains valid. PEP estimated the City of Milwaukee’s population as 589,839 in April 2020.
Why would the census vary so much from this estimate? As it turns out, there is a good answer, and it lies in the intricacies of administrative population estimates.
Measuring population may be complicated, but the components that determine it are simple. Births, deaths, and migration. Americans rarely give birth, die, or move without some piece of the government noticing.
The Census Bureau’s Population Estimates Program (PEP) calculates annual population estimates based on administrative records. They do this at the county level by collecting birth and death counts derived from vital statistics offices. Few people are born or die without a local government certificate to prove it. To calculate net domestic migration, they combine information from IRS tax returns for those under age 65, Medicare enrollment data for those older, and Social Security records for all ages. It’s difficult to move within the United States without one of these agencies noting your address change. Net international migration is trickier to measure, and PEP uses a complex methodology to allocate nationwide estimates down to individual counties.[12]
These annual population estimates are calculated for each county. PEP also tracks the construction of new housing units, which is used to allocate county population totals into municipalities. Crucially, as we’ll discuss below, they do this using the average household size from the previous decennial census.
Using these administrative data inputs, the PEP estimated that Milwaukee County’s population fell by 3,300 from 2010 to 2020.[13] The decennial census found a loss of 8,200. The PEP estimates for 2020 were created without knowledge of the 2020 census.
Here is why Milwaukee County’s population fell, according to PEP. From 2010 to 2020, there were 53,700 more births than deaths. We lost 79,300 people to net domestic migration. We gained 22,500 thanks to international immigration.[14]
The PEP number, which combines multiple sources, is actually better for Milwaukee than the simple IRS count of tax filers who move between counties. From 2011-20, the IRS observed a net outflow of 35,000 filers with 88,700 dependents.[15]
At the county level, the administrative PEP estimates and the census count wound up being strikingly similar. PEP got the county wrong by just 0.7%, or 6,600 people out of a population of 939,500. PEP did much worse in the city, where it overestimated the population by 2.2%, or 12,600 people out of just 577,200.[16] In other words, PEP got the county’s population basically correct, but it assigned too much of that population to the city.
The reason is simple. PEP allocated the county’s population to municipalities based on the number of housing units and average household size in each. The household size was taken from the previous decennial census. When the original 2020 PEP was released, it still used the 2010 household size factors. This was 2.50 for the City of Milwaukee, but as described above, it fell to 2.39 in the 2020 census. Meanwhile, household size in the suburbs held steady.[17]
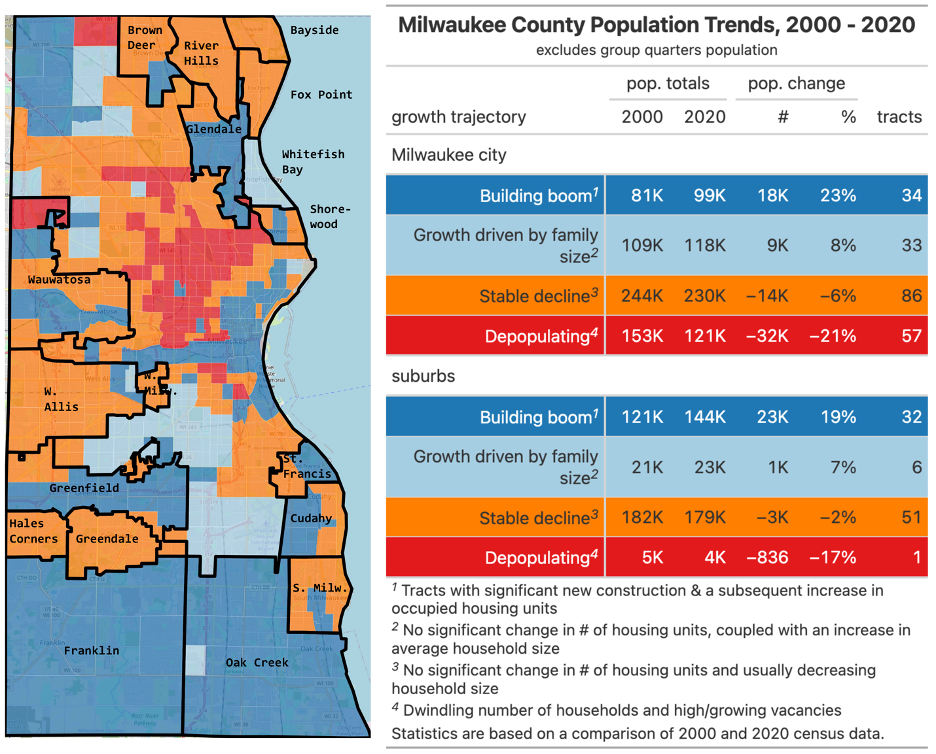
If these census measures of household size are correct, we should expect to see declining births in the city and stable births in the suburbs. In fact, this is exactly what local birth certificate records show. The kids who turned 18 (and began leaving home) during the 2010s were born from 1992 to 2001. During those ten years, City of Milwaukee moms had 114,200 kids and Milwaukee suburban moms had 37,300. These kids were “replaced” by the babies born between 2010 and 2019. In the City, only 98,200 replacements were born, while the suburbs actually saw a slight increase to 39,400.[18]
Besides births, the other way to grow is migration. We already discussed Milwaukee County’s dismal net migration rates, but how does net migration vary between the city and the suburbs? Few data sources exist for sub-county migration patterns. The best currently available are the 2010-14 and 2015-19 ACS migration flow files. These estimate that the City of Milwaukee lost an average of 6,400 people each year to net domestic migration from 2010 to 2014. That increased to a loss of 9,000/year from 2015 to 2019. In total, the American Community Survey estimates the City’s domestic migration losses at about 77,000 for the decade. Meanwhile, the survey found slightly positive annual domestic migration among the Milwaukee suburbs, although within the margin of error.
Survey estimates like these necessarily involve more uncertainty than administrative data counts. Still, the conclusion is inescapable that the deeply negative net domestic migration losses documented at the county level are driven by losses from the City of Milwaukee.
The most recent ACS data estimates that 24,200 people currently live in Milwaukee County who immigrated here since 2010. Of those, two thirds live in the city.[19] This is plausibly similar to the PEP estimate of 22,500 net international migrants to the county. Even if the city received three quarters of these arrivals, that wouldn’t come close to offsetting its steep domestic losses.
Pulling it all together
I’m most persuaded by the city’s argument about the 2,394 missing housing units and the 700 mislocated prisoners. Altogether, that would add just about 6,000 Milwaukeeans.
I’m skeptical that the census overcounted vacant properties. The difference between USPS and census counts is generally consistent around the country and seems to have more to do with different definitions and data collection methods.
The decennial census once again undercounted Black and Latino people in America overall, but it’s less clear how that applies in Milwaukee. The housing unit data put forward by the city is consistent with a big undercount of Black Milwaukeeans but less so Latinos.
In any case, Milwaukee’s trajectory over the last decade must be consistent with the hard data we have about the components of population change.
Milwaukee County’s population change from 2010 to 2020 isn’t much of a mystery. Administrative records of the components of change and the decennial census both agree that the overall population fell slightly—somewhere in the mid 4-figures.
Leaving aside the decennial census, we have several other pieces of evidence suggesting that the county’s population losses were concentrated in the City of Milwaukee. First, the city’s share of births declined. Compared to the decade 18 years prior, 16,000 fewer babies were born in Milwaukee during the 2010s. In the suburbs, the number of births increased by 2,000.[20] Second, the two ACS migration flow files covering the decade estimate very large domestic migration losses in the City of Milwaukee but not in the suburbs. Third, local government records show that about 4,000 local government employees apparently left the city after the state ended the local residency requirement in the mid-2010s. Factoring in their families, that works out to nearly 10,000 people.[21]
Given all these data points, it seems most likely that Milwaukee County’s modest population decline was driven by population loss in the City of Milwaukee. But the loss may not have been quite as large as the census first showed. An undercount of about 6,000 people is consistent with both the city’s housing unit data and administrative measures of population change.
Notes
[1] Their official guidance states, “Block-level data are noisy and should be aggregated before use.” See “Protecting the Confidentiality of the 2020 Census Redistricting Data,” Factsheet D-FS-GP-EN-079, US Census Bureau, August 2021.
[2][2] The USPS has long been known to overcount the total number of residential addresses in Urban Areas. More recently, the USPS also began a new program that lists PO Boxes as street addresses for the purposes of receiving more packages from private carriers. For more details see “USPS Vacancy Data – Frequently Asked Questions,” U.S. Department of Housing and Urban Development, 2018.
[3] “The Census Bureau excludes properties from the universe of potentially-habitable properties “if the roof, walls, windows, or doors no longer protect the interior from the elements, or if there is positive evidence (such as a sign on the house or block) that the unit is to be demolished or condemned.” From “Housing Vacancies and Homeownership – Definitions and Explanations,” US Census Bureau.
[4] In rural areas, this is actually official policy. In cities, they leave it to the “carrier’s discretion.” See “I received a Vacant Notice: Explanation of a ‘Vacant’ notice and steps to take,” USPS FAQS, 2 November 2022.
[5] This is the average of the variable VAC_3_RES across the 12 quarterly files published from 2019 through 2021.
[6] “Housing Vacancies and Homeownership – Definitions and Explanations,” US Census Bureau.
[7] In fact, recent ACS estimates are even higher than the decennial census count of 8.7%. The 2021 ACS estimated 9.9% of units were vacant, the 2017-2021 ACS estimated 10.8%, and the 2019 ACS estimated 10.7%. Considering all sources, the USPS measurement is the outlier, not the 2020 census.
[8] The mean county had 10,185 (68%) more vacant properties in the census than the USPS data. Milwaukee County had 8,852 more census vacancies (29%).
[9] “Census Coverage Estimates for People in the United States by Demographic Characteristics: 2020 Post-Enumeration Survey Estimation Report,” U.S Census Bureau, June 2022, p. 7.
[10] “Census Coverage Estimates for People in the United States by State and Census Operations: 2020 Post-Enumeration Survey Estimation Report,” U.S Census Bureau, June 2022, p. 7.
[11] “American Community Survey Key Facts,” US Census Bureau, 2010.
[12] “Methodology for the United States Population Estimates: Vintage 2020,” US Census Bureau Population Estimates Program, Version 2, May 2021.
[13] Technically, the PEP statistics are as of July 1st in each year, whereas the decennial census is as of April 1st.
[14] PEP includes a small residual for population change they can’t allocate to a specific component, which was -121 for the decade in Milwaukee County. This is an artifact of their top-down estimate methodology.
[15] In total, the IRS counted 163,600 filers with 262,900 dependents who moved from somewhere else in the United States to Milwaukee County and 198,600 filers with 351,700 dependents who moved away.
[16] PEP released a special version of its population estimates with an April 1, 2020 value, specifically for comparison with the 2020 census. The value for Milwaukee County was 946,092.
[17] Specifically, household size in the Milwaukee County suburbs fell marginally from 2.26 in 2010 to 2.25 in 2020.
[18] Wisconsin Department of Health Services, Wisconsin Interactive Statistics on Health: Birth Counts Module.
[19] 2017-21 American Community Survey, Table B05015.
[20] These figures are consistent with decennial census data. According to the 2020 census, the City’s under-18 population declined by 16,885 while the under-18 population in the suburbs fell by just 449. The declines in under-18 population are larger than the decline in births, suggesting that both the city and the suburbs suffered slightly increased net migration losses among children.
[21] The residency requirement ended in two phases. MPS ended theirs in July 2013 after the state law took effect. The city fought the law in court, so their requirement lasted until June 2016. By the fall of 2019, the city reported 1,793 employees living outside the city, while MPS reported 2,184. The ACS estimates show a marked increase in net movement out of Milwaukee during the latter half of the decade. See, Mike Gousha, “Milwaukee city workers moved out in droves after the residency rule ended. It was a boon for the suburbs,” Milwaukee Journal Sentinel, 14 November 2019.
Appendix A
Some of the calculations in this document vary slightly from those included by the city in their official challenge letter. This is due to several methodological differences, which I outline below.
First, the city calculates household size by dividing total population by the number of occupied housing units: 577,222 / 235,410 = 2.45. I calculate household size by first subtracting the group quarters population from the total population, then dividing that by occupied households: (577,222 – 15,680) / 235,410 = 2.39. Technically, the Census Bureau advises against dividing data across tables (as in the above calculation of average household size) because the decoupling of housing unit statistics and population statistics in the Bureau’s differential privacy technique means that the official household size cannot be known until the release of the Detailed Demographic and Housing Characteristics Files beginning in 2023. But at large enough geographies (like the City of Milwaukee), these errors cancel each other out.
Second, the city calculates the missing population attributable to the undercount of housing units by multiplying the number of units by the average household size (in their case, 2.45): 2,394 * 2.45 = 5,865. In my calculation, I first multiply the “missing” housing units by the census citywide occupancy rate, then multiply the product by average household size: (2,394 * 0.9134) * 2.39 = 5,226.
Third, my USPS residential address statistics vary trivially from those reported by the city. Both the city and I derive our USPS statistics for census comparison by averaging the Q1 and Q2 values from 2020. The city reports a total of 277,744 residential addresses, while I get a total of 277,511. My best guess is that the data file was slightly updated sometime between when the city downloaded and when I did in early January 2022. A difference of this size is inconsequential for the analysis.