(This post also appeared in The Recombobulation Area).
The official census count occurs just once every ten years, and it’s out of date by the time it gets released.
The last census was officially conducted on April 1, 2020, so it missed essentially all the population changes caused by the COVID-19 pandemic. But each year, the U.S. Census Bureau also releases “intercensal” population estimates. These are based on carefully collected administrative records (births, deaths, tax returns, etc.), and they give us the best look at how our current population is changing. The estimates cover 12-month periods beginning on July 1. The latest data covers the year from July 1, 2022 to June 30, 2023.
The pandemic and its aftermath is still the big story in this data. Cities across the country shrank. Some, like Detroit, have begun to grow. Despite Milwaukee Mayor Cavalier Johnson’s well-publicized goal of “1 million Milwaukeeans,” the city’s population recovery has yet to begin.
The latest estimates show positive signs for Wisconsin, but continued struggles for Milwaukee, relative to our midwestern peers. Wisconsin has largely returned to pre-pandemic form, while Milwaukee County is continuing to shrink at twice the rate of the 2010s.
Wisconsin added 20,000 net new residents from July 2022 to July 2023, a growth rate of 0.35%, which is practically identical to the state’s average growth rate during the previous decade. That growth was nearly double the state’s increase of 11,000 in 2022, which came on the heels of a 17,000-person loss in the first year of the pandemic.
Population change can be broken down into two components — net migration and natural change (births minus deaths). The next graph shows why each state grew or shrank over the past three years. Wisconsin’s 2023 growth rate falls below Minnesota and Indiana but above Michigan and Iowa. Illinois is still shrinking badly.
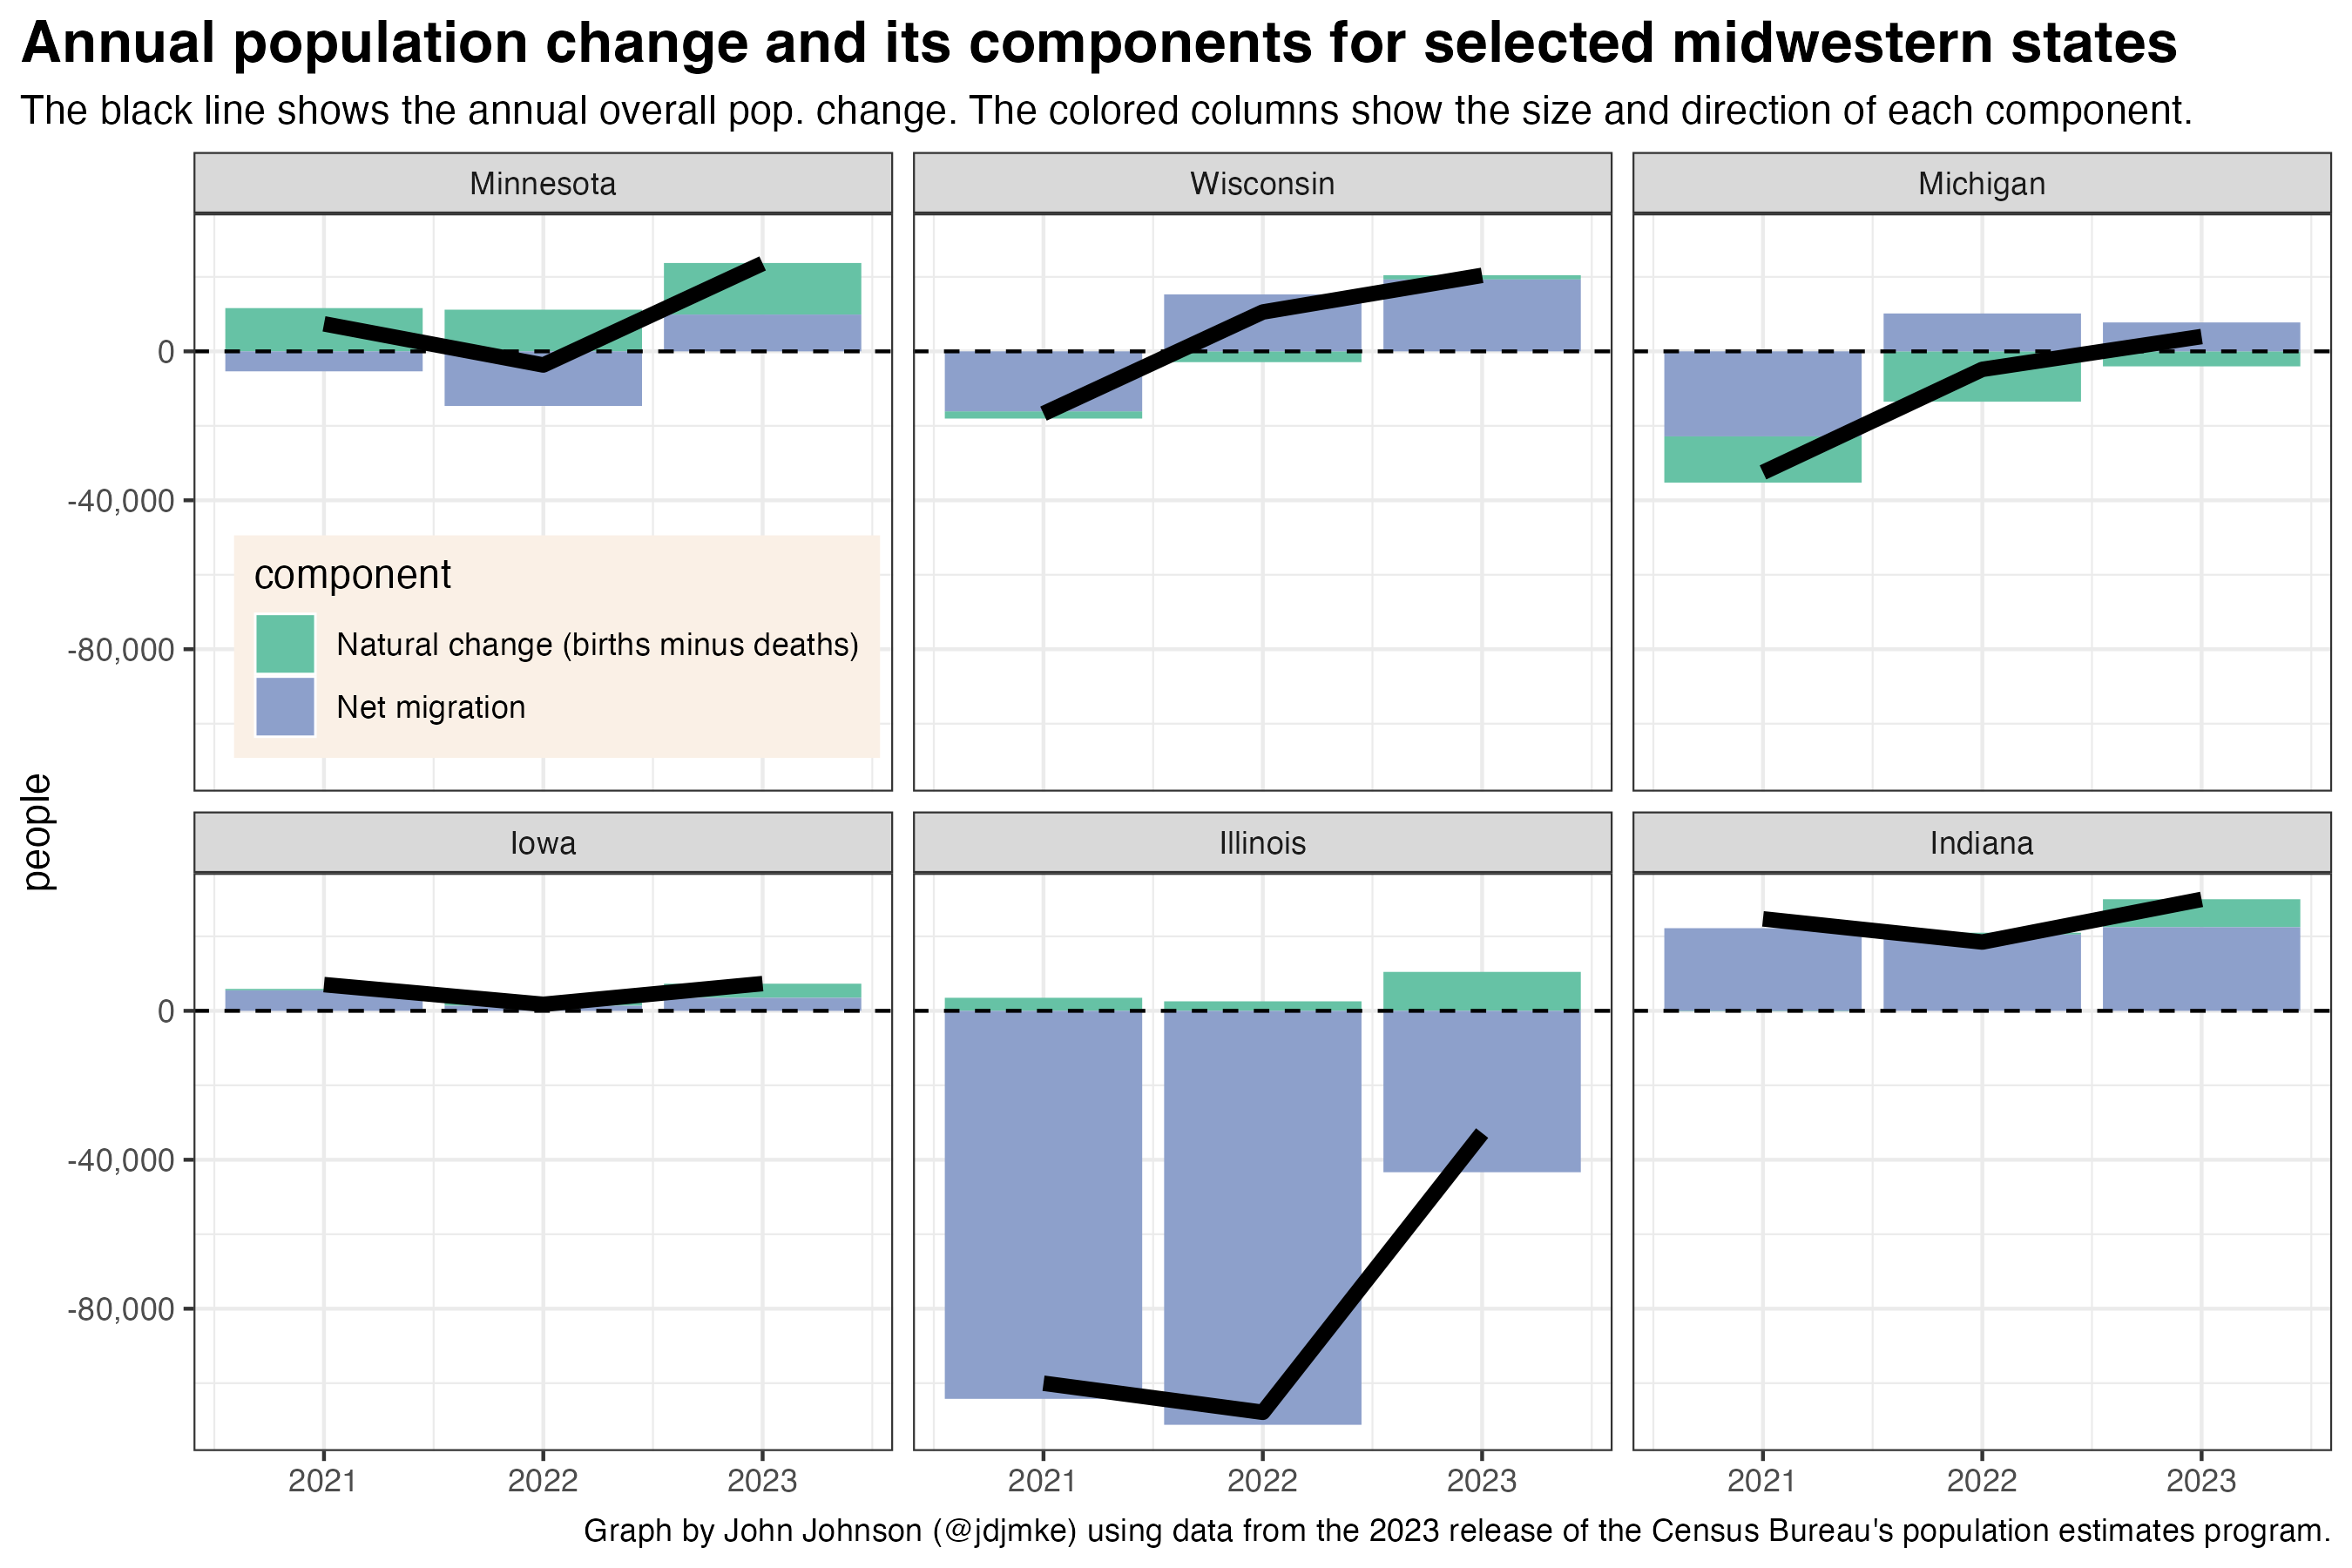
Each state has followed a different trajectory.
- Wisconsin had slightly more deaths than births in 2021 and 2022, before flipping to slightly more births in 2023. The bigger change has come from improving migration numbers. The state lost 16,000 net migrants in 2021 but gained 15,000 in 2022 and 19,000 in 2023.
- Michigan has followed a similar trajectory as Wisconsin, but with more negative natural increase and slightly less migration.
- Minnesota’s net migration has bounced around over the past few years, but its strong birth rates have kept it from shrinking much.
- Iowa is close to flat—but slightly positive—in both natural change and net migration.
- Illinois has maintained slightly positive natural change, but it gets hammered on net migration. A net of more than 100,000 people left the state in both 2021 and 2022. The outbound tide slowed to 43,000 in 2023, but Illinois remains the only state in this set to have negative net migration.
- Indiana has attracted more than 20,000 net new residents in each of the past 3 years—some of them, doubtlessly, former Illinoisans.
Milwaukee County’s population fell by an estimated 1,800 during the 12-month period ending July 2023. That was an improvement over the previous two years, when the population fell by 6,200 and 14,300, respectively. Still, the county shrank by 0.2% in 2023, compared with an average annual decline of less than 0.1% throughout the 2010s.
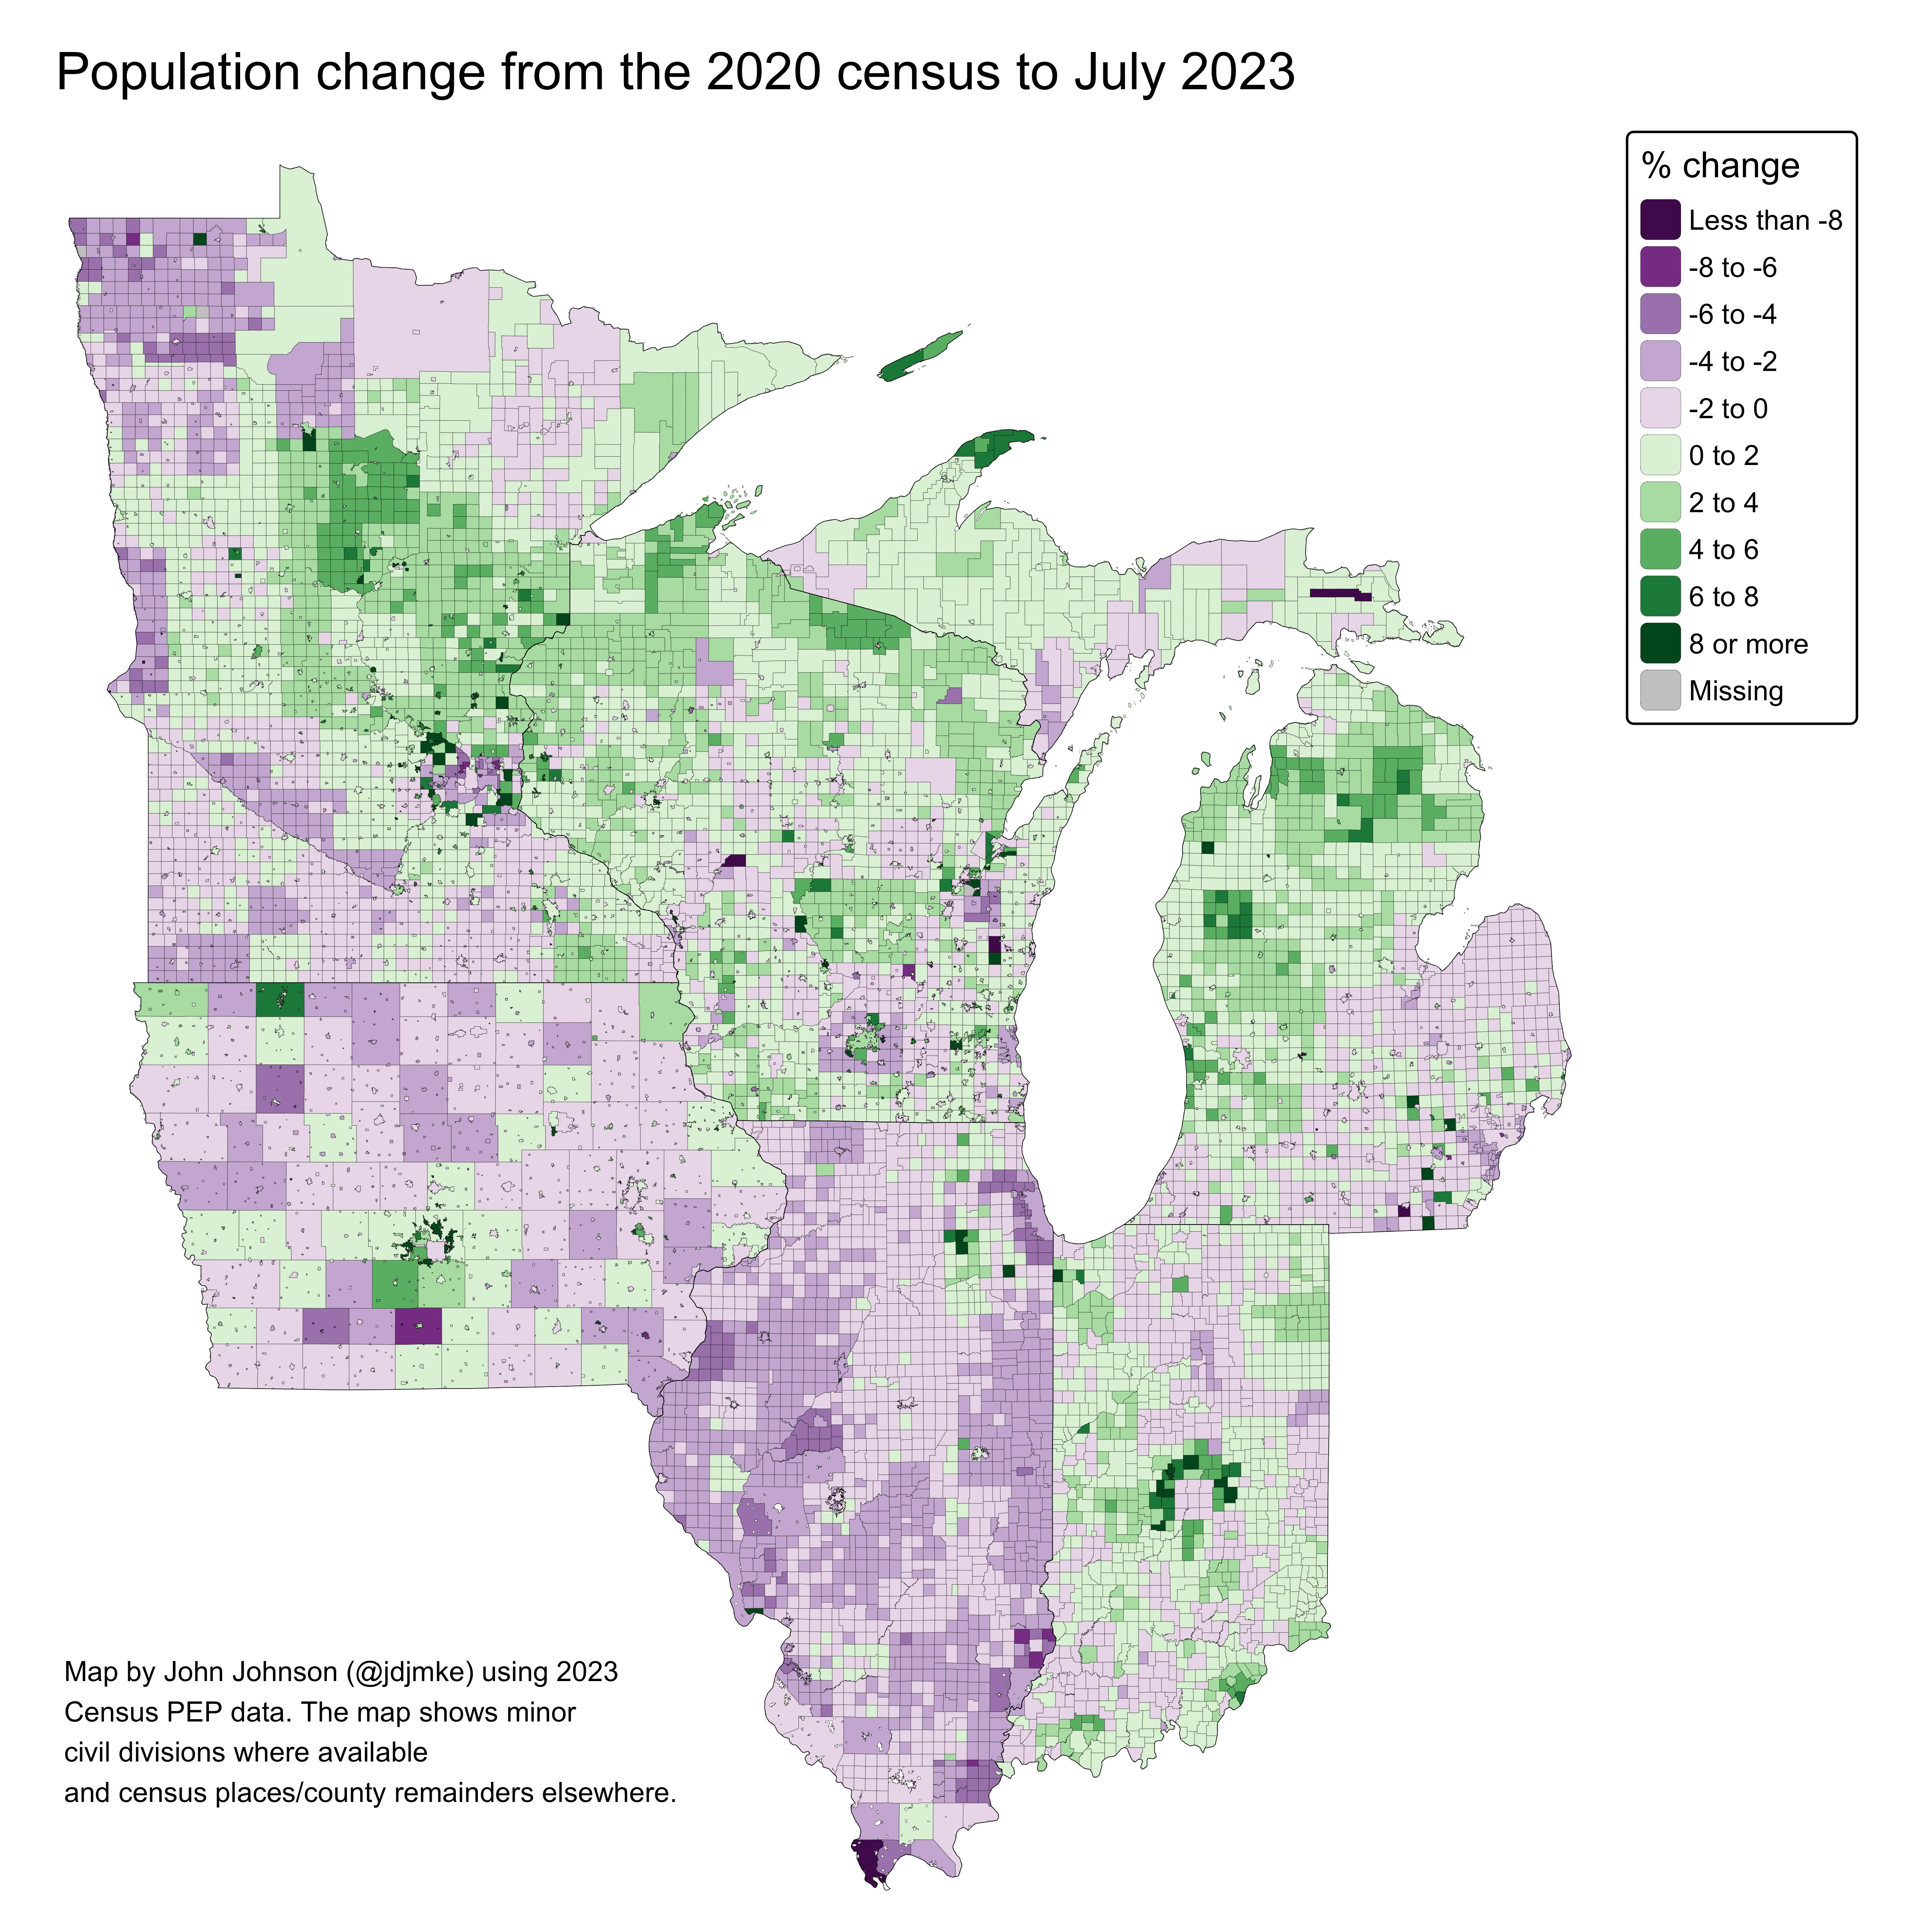
The maps below show components of population change for each county.
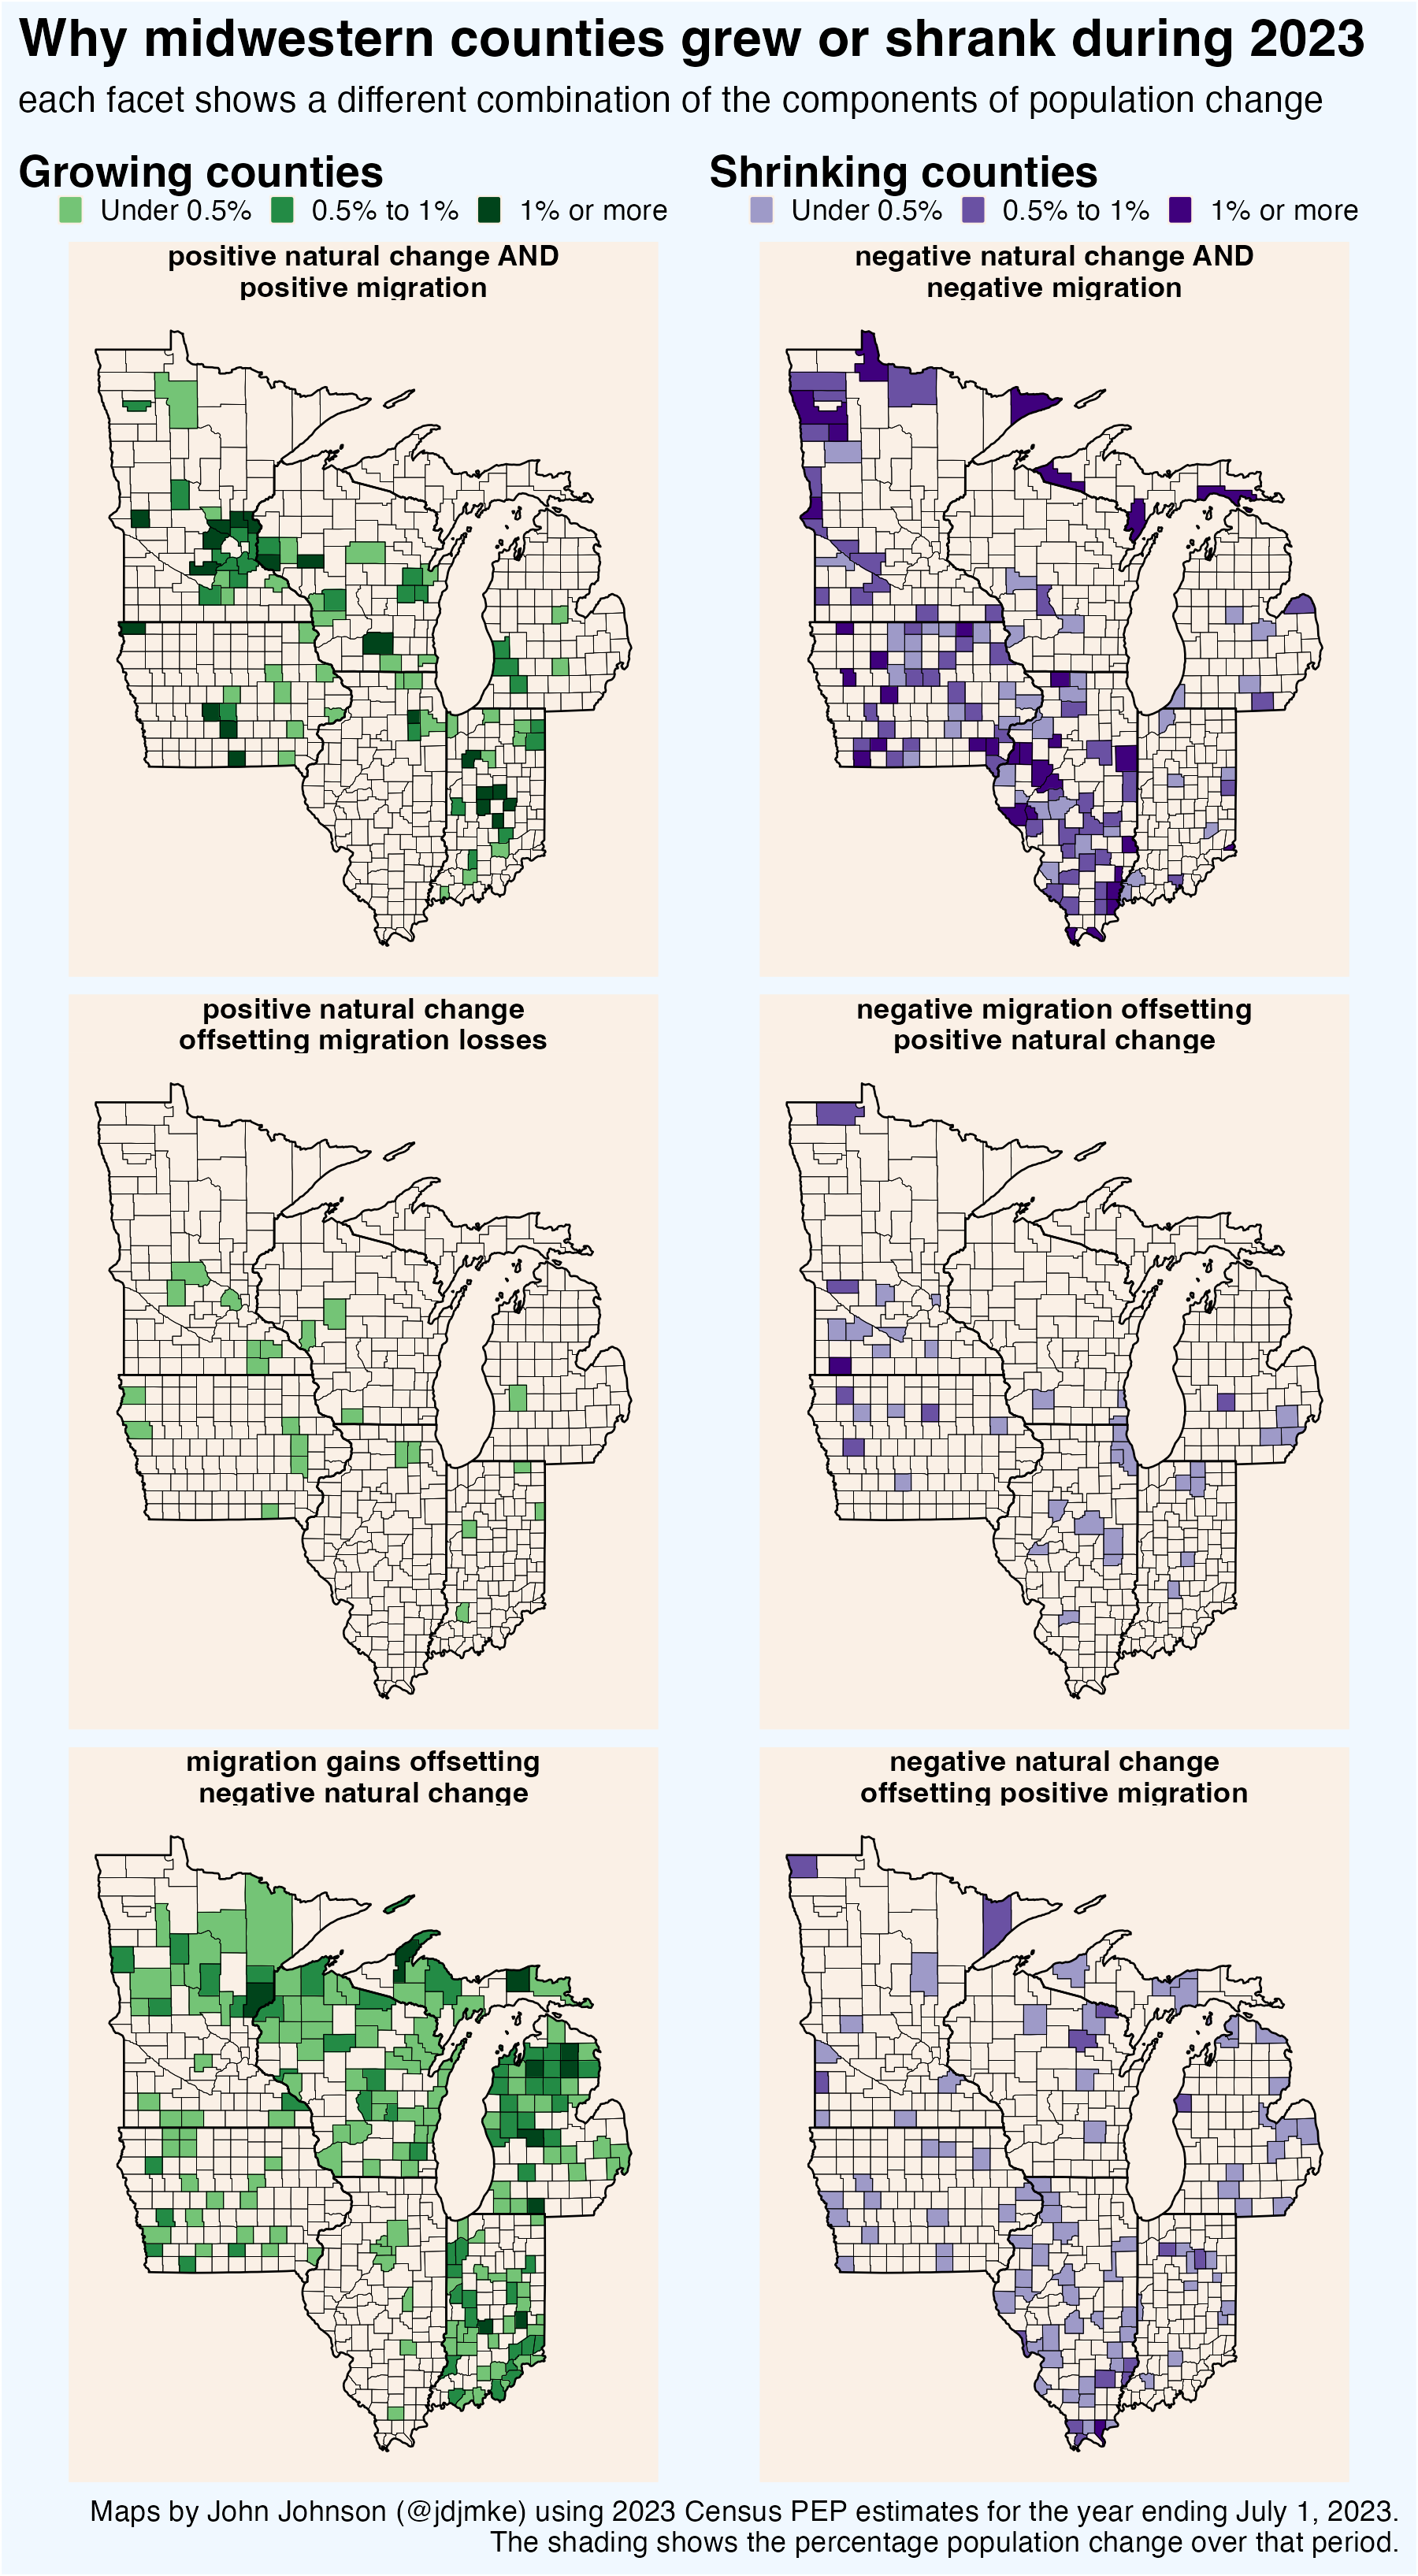
The strongest position is in the top left map, which shows counties with more births than deaths and positive net migration. It includes the counties surrounding Indianapolis and the Twin Cities—though notably not any of those cities themselves. The growth emanating (though not shared by) the Twin Cities is so strong that it reaches as far as Eau Claire, Wis. Other areas in Wisconsin in this strong position include Dane and Marathon counties, the Fox Valley, and the greater La Crosse area.
Only a handful of counties have negative migration but enough of a positive birth rate to keep growing nonetheless. The largest in this category is Hennepin County, home to Minneapolis. In Wisconsin, they include Clark, Lafayette, and Trempealeau counties.
Many more counties have aging populations, resulting in negative natural change, but enough in-migration to create population growth. Broadly speaking, this includes a great swathe across northern Michigan, Wisconsin, and Minnesota. Perhaps the remote work boom is finally creating the conditions for population growth across the Northwoods.
If the healthiest counties grow from births and migration, then the most troubled counties are shrinking for both reasons. These counties — which have more deaths than births and more leavers than comers — are found most commonly in rural Illinois and Iowa. In Wisconsin they include just Columbia, Crawford, Juneau, and Jackson counties.
Seven of the region’s largest 10 counties fall into the next category — where natural change is positive, but offset by out-migration. To put it reductively, people seem to have kids in these counties, then they leave. This status includes Milwaukee County; Cook, Kenosha, Lake, and DuPage counties in the Chicago metro; Wayne and Oakland counties in the Detroit metro; and Marion County (containing Indianapolis).
The final category, positive migration but an even larger negative natural change, occurs mainly in rural counties — particularly in Illinois.
The Census Bureau further estimates municipality population by tracking new housing unit construction and allocating the county-level population estimate into each town based on the average household size in the 2020 census. Based on this methodology, Milwaukee city’s population fell by 2,200 in 2023 to a new low of 561,400. The most significant growth came in Oak Creek, which likely added about 1,100 new residents. Most of the remaining municipalities are estimated to have shrunk slightly.
Milwaukee’s decline of 2,200 is an improvement over its loss of 2,900 in 2022 and pandemic-fueled drop of over 10,000 in 2021. But Milwaukee’s rate of decline in 2023 was still tied with Rockford, Ill., for the worst among the region’s 15 largest cities.
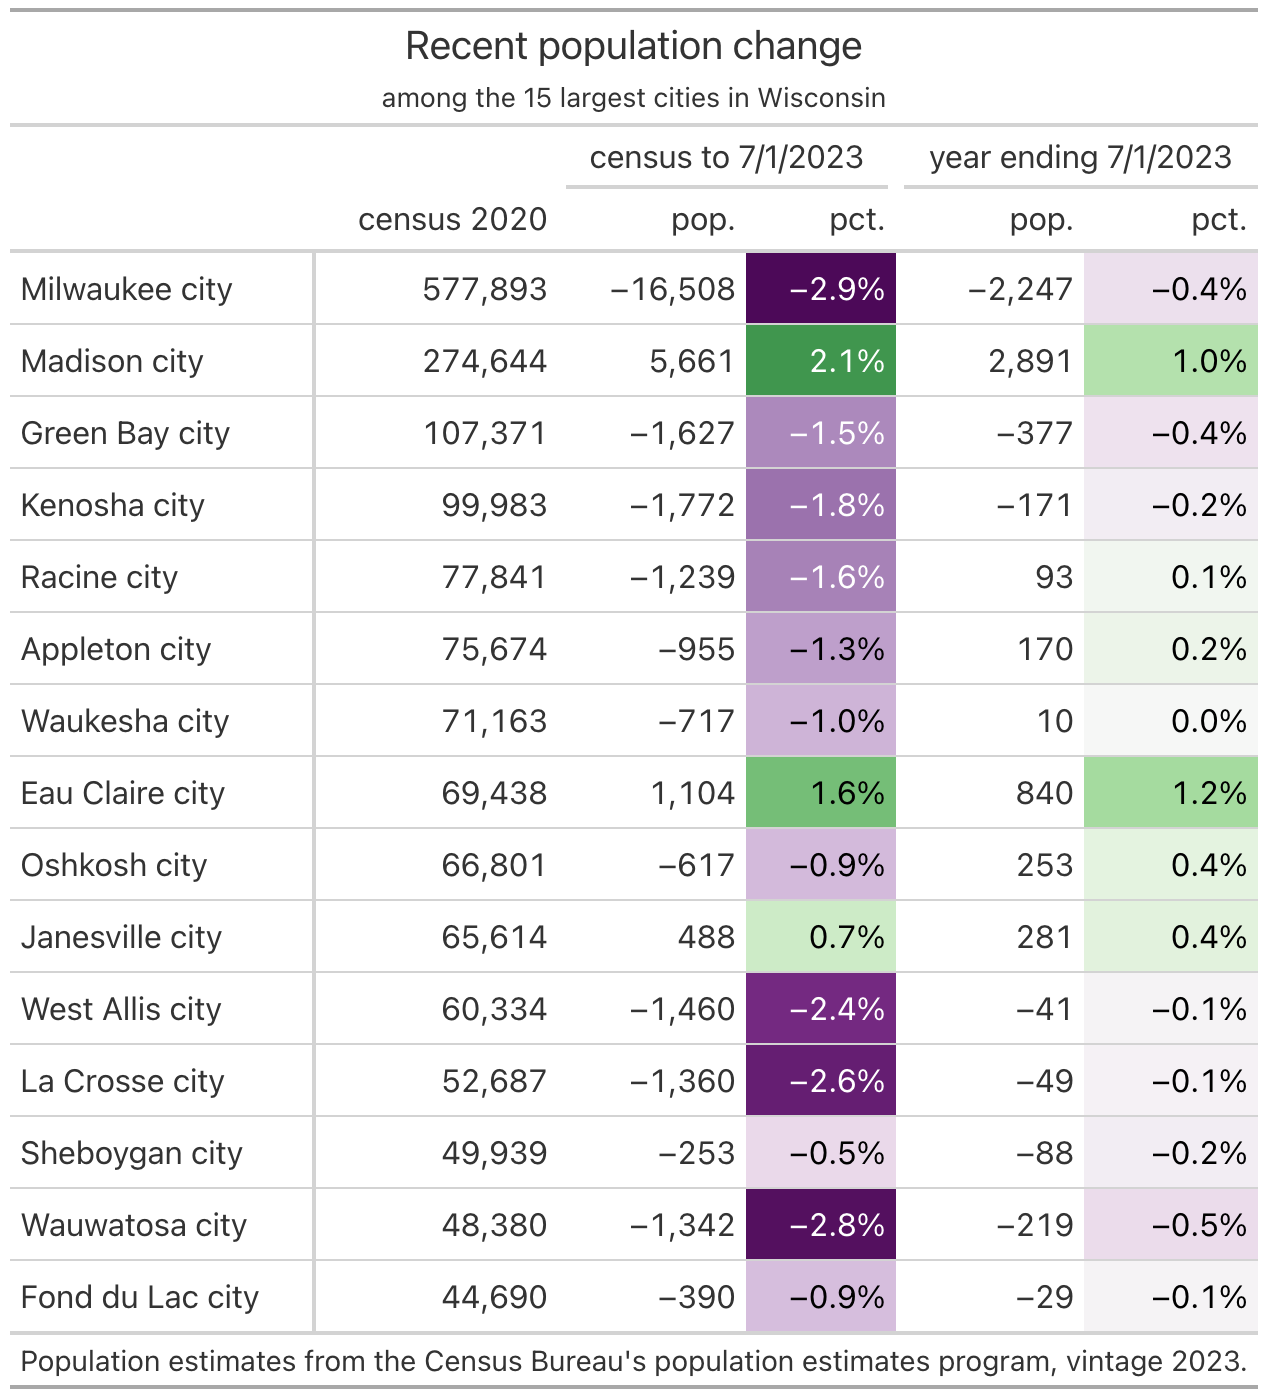
Milwaukee’s rate of change since the 2020 census is second-worst, trailing only Chicago. Madison, on the other hand, had the highest rate of growth in 2023 and the second highest since the pandemic (after Fort Wayne).
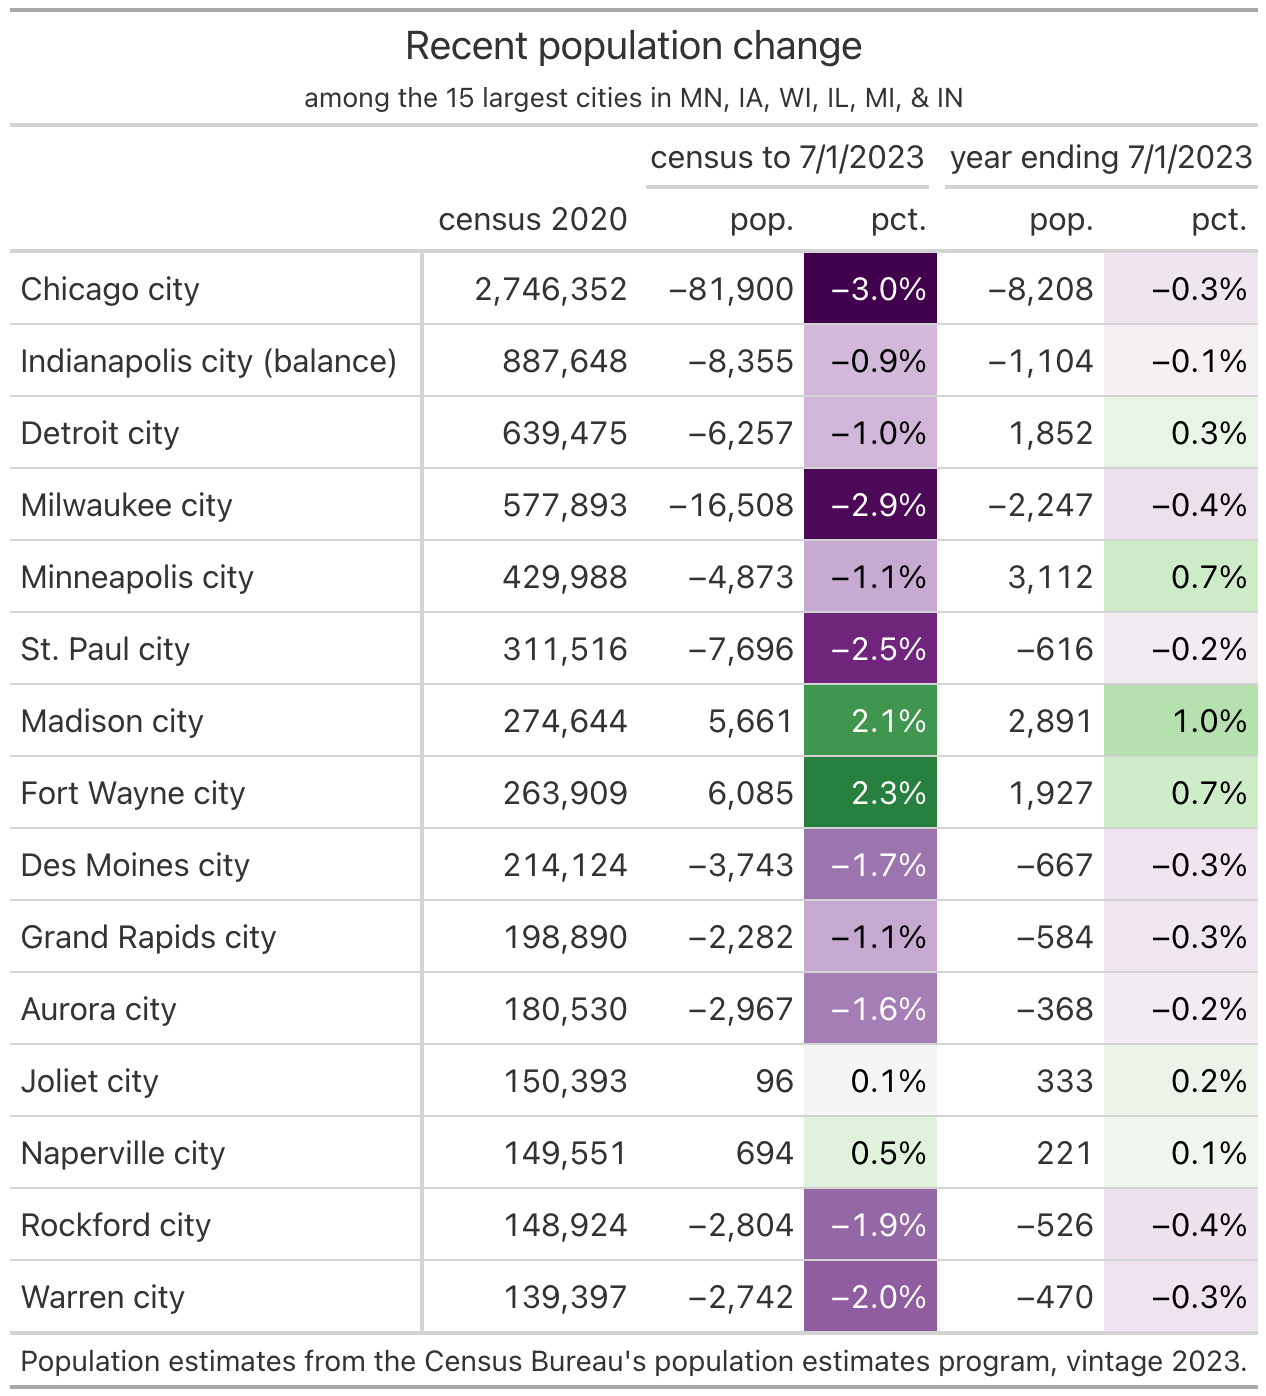
Most of the 15 largest municipalities in Wisconsin have shrunk since the 2020 census, with the exceptions of Madison, Eau Claire, and Janesville. But all of these cities do show signs of improvement in 2023. Eau Claire has shown particularly robust growth, passing Waukesha to become the state’s seventh largest city in the latest estimates.
By comparing Wisconsin with this set of neighboring states, I hope to better place our demographic situation in context. The bright spots in Wisconsin extend well beyond Madison. Many regions surrounding smaller cities like Eau Claire, Wausau, and the Fox Valley are doing quite well. The rural Northwoods is attracting enough migration to offset the natural decline of its aging population. Our rural communities are in a much healthier place than those of Illinois or Iowa.
Still, even if Wisconsin’s outlook seems better than Illinois’, Milwaukee nonetheless appears to be on the same trajectory as Chicago. In both, the population has fallen by about 3% since the pandemic began. The culprit is the same. The birth rate in each city is positive, but more people choose to move away than to move in.