Rating the Battleground Districts in the Wisconsin Legislature
The 2026 general election will decide which party controls Wisconsin’s state government, with a trifecta for either party realistically in play. Now, with campaign finance reports from the first half of the year in hand, it seems a good time to quickly tour each battleground district.
For each district, I provide a rating. Safe seats are ones where I’ll be truly surprised if the other party wins. In Lean seats, I see a clear favorite, but an upset wouldn’t be shocking. In Tossup seats, I can easily imagine the result going either way.
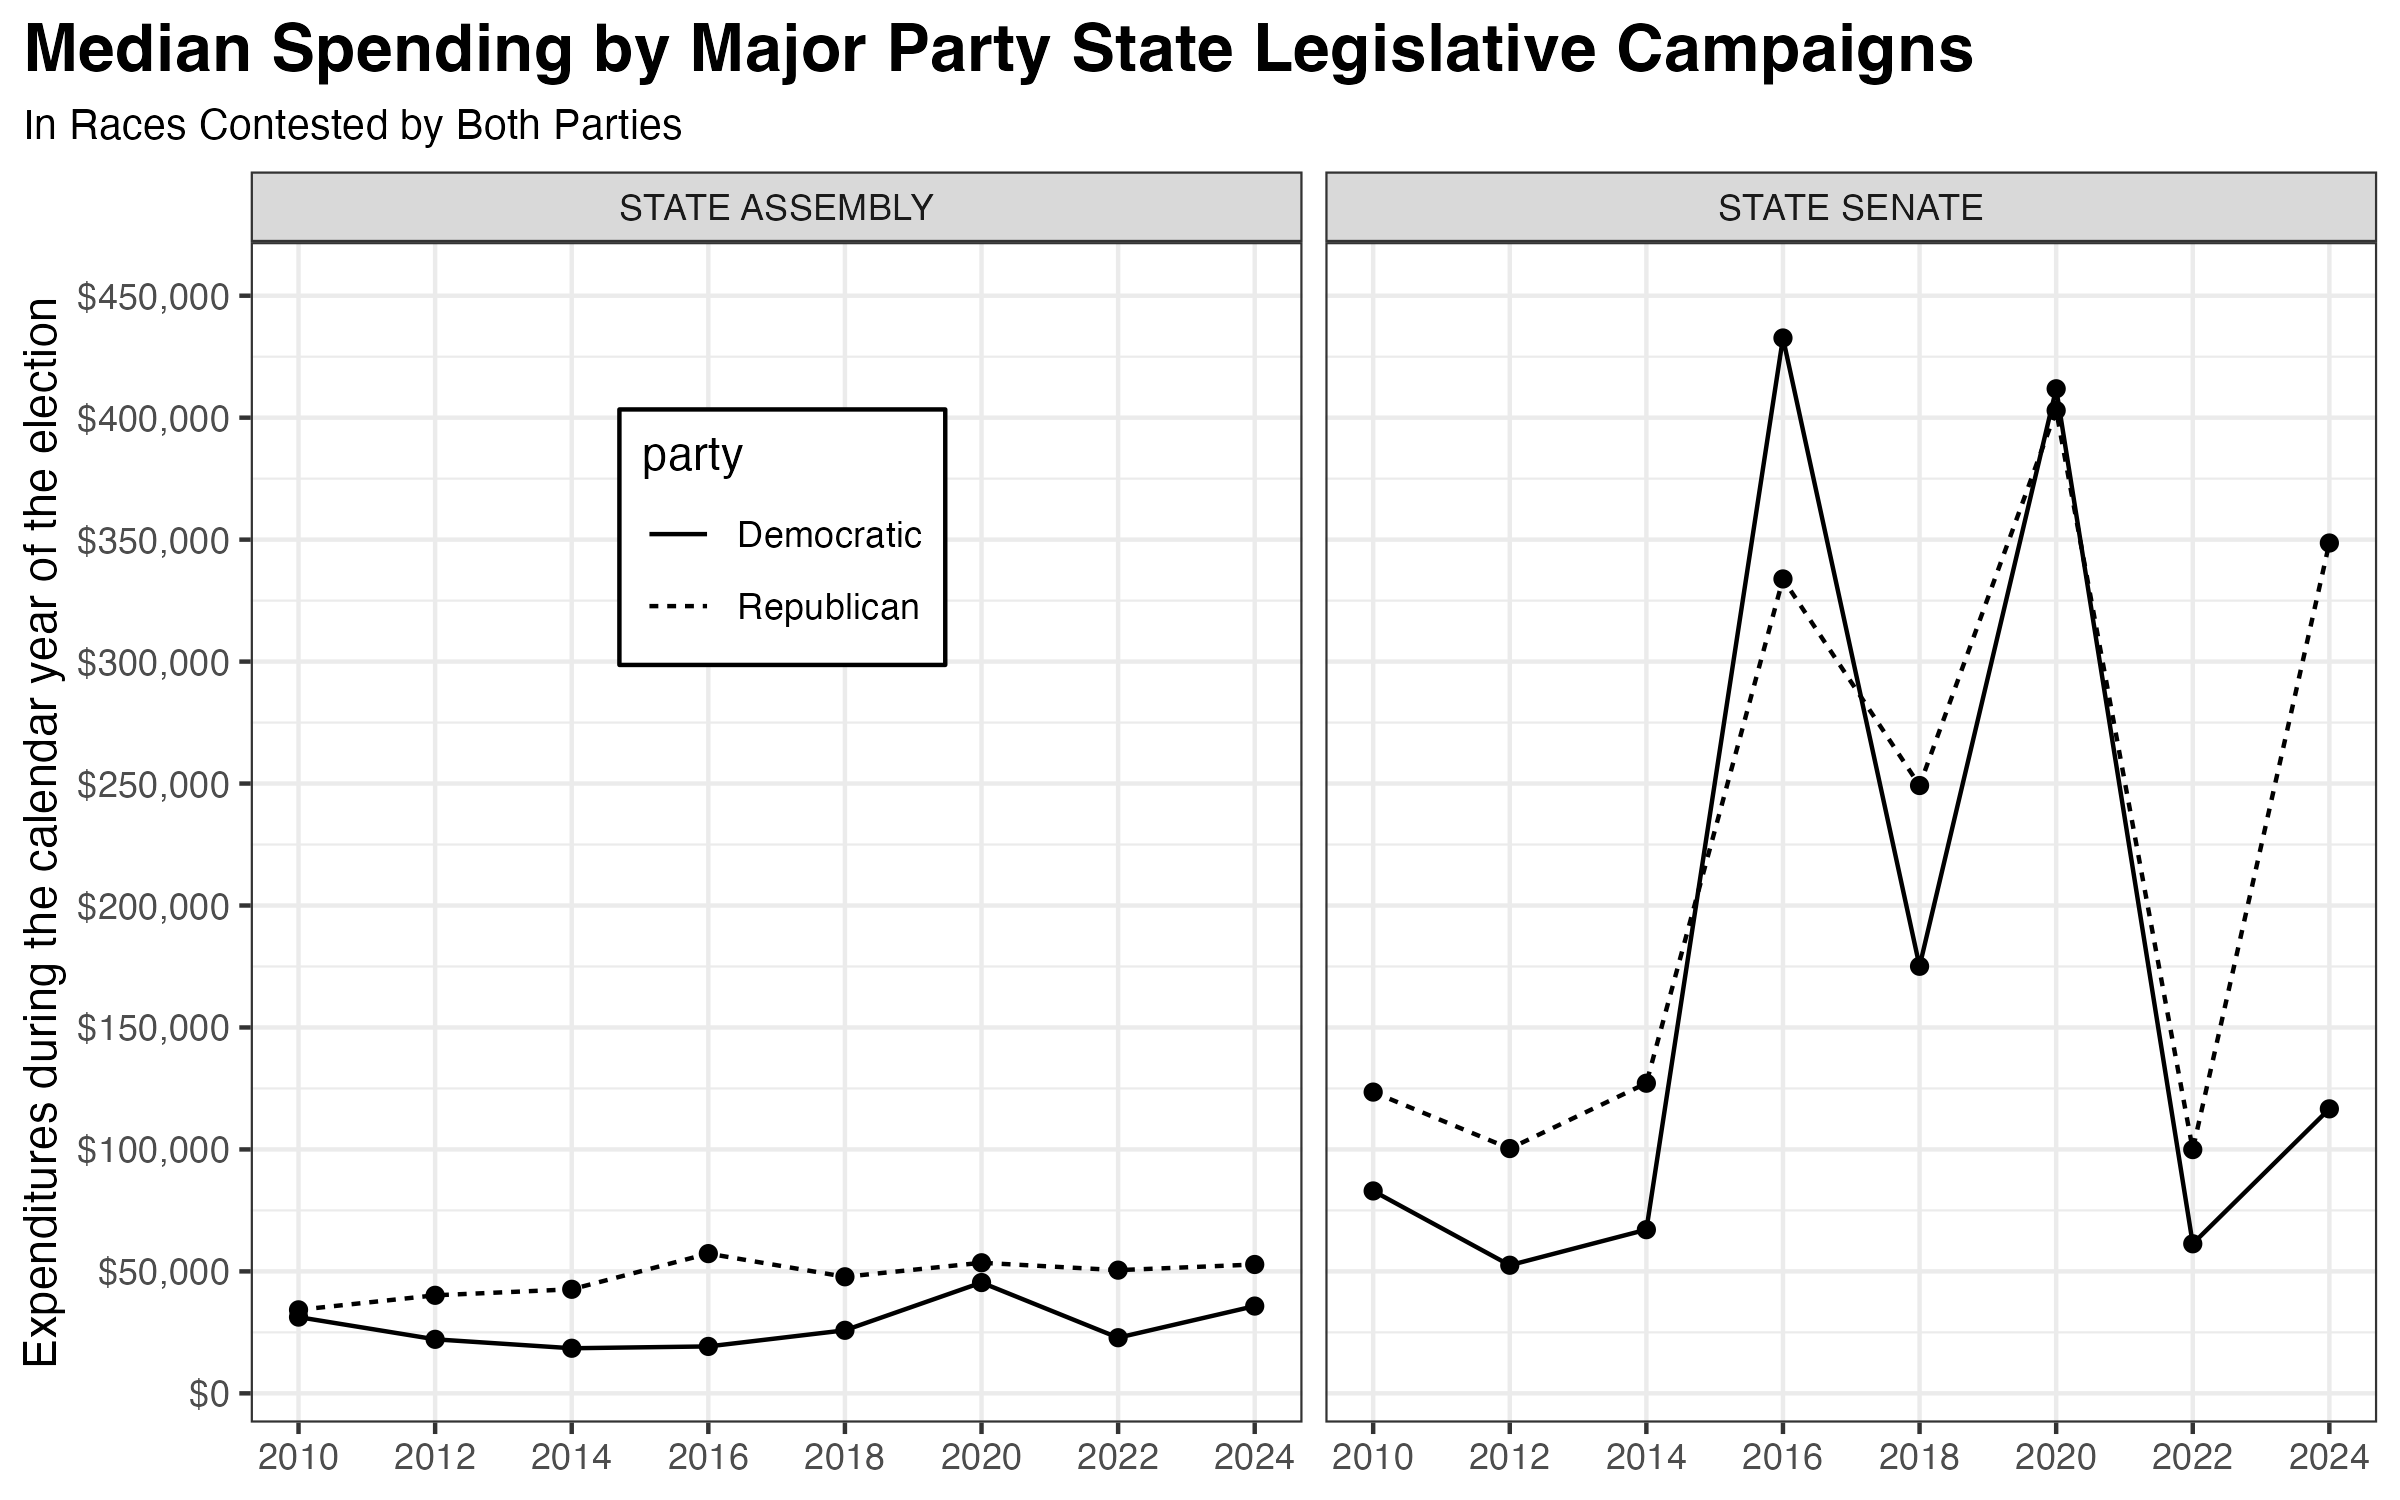
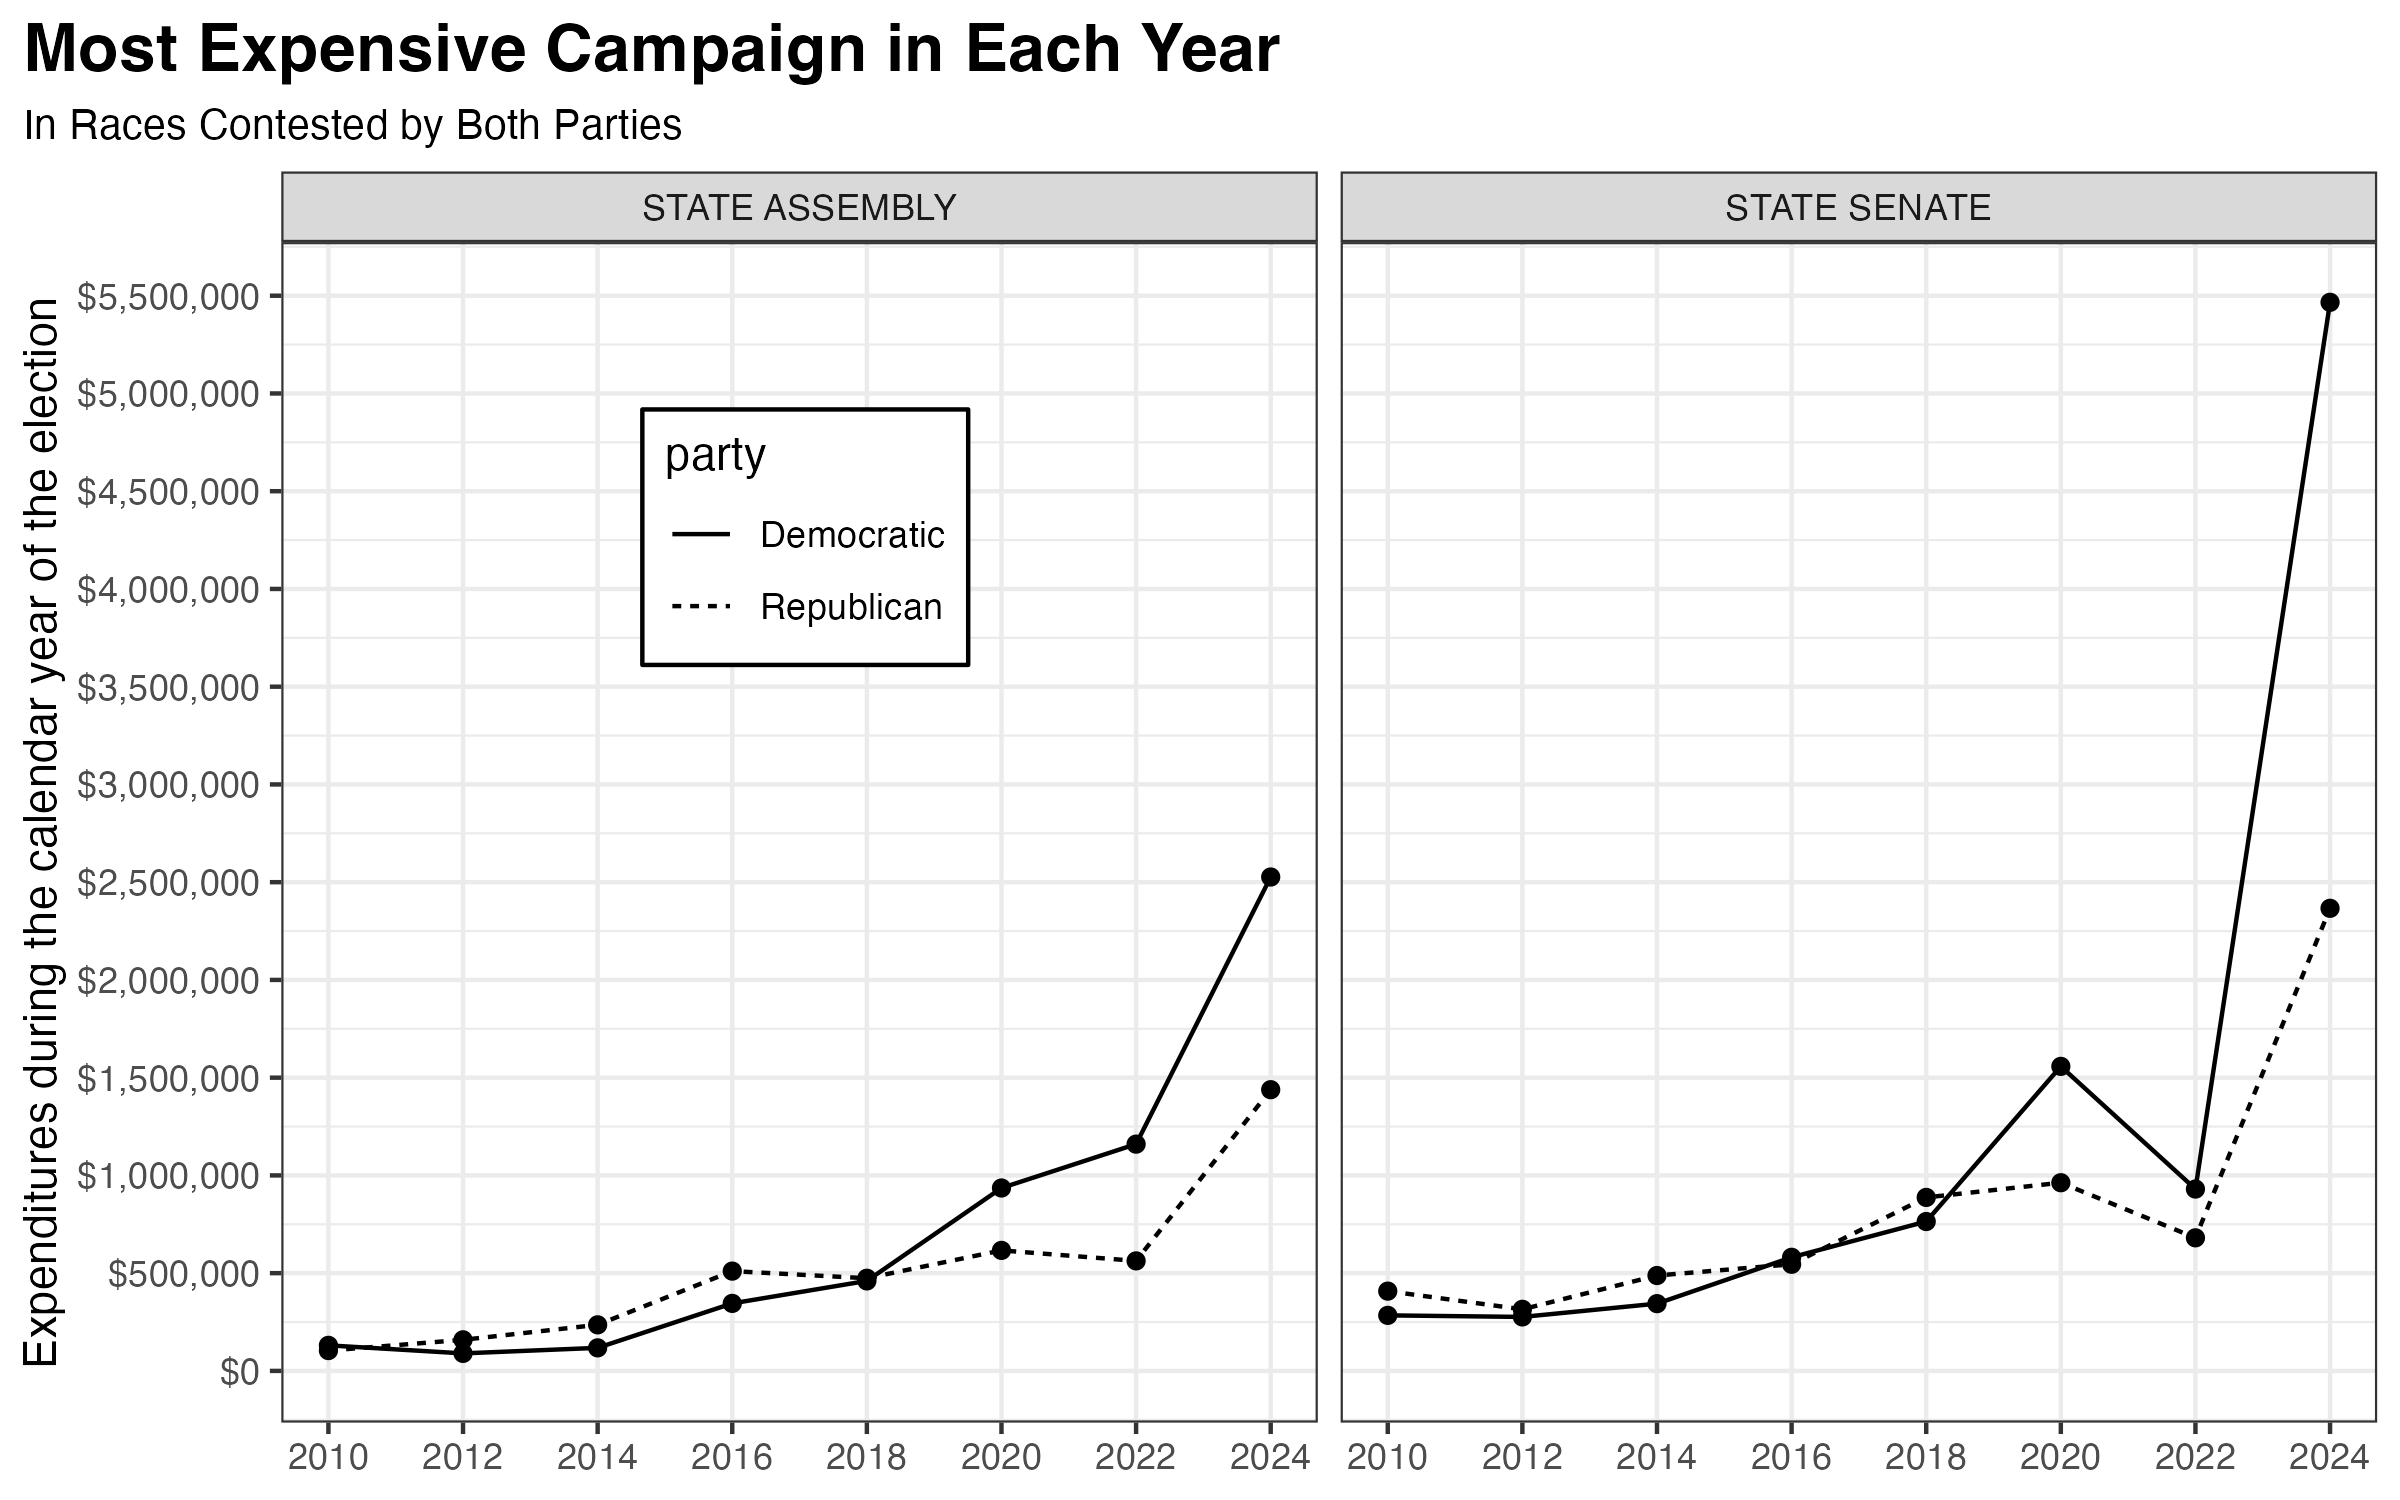
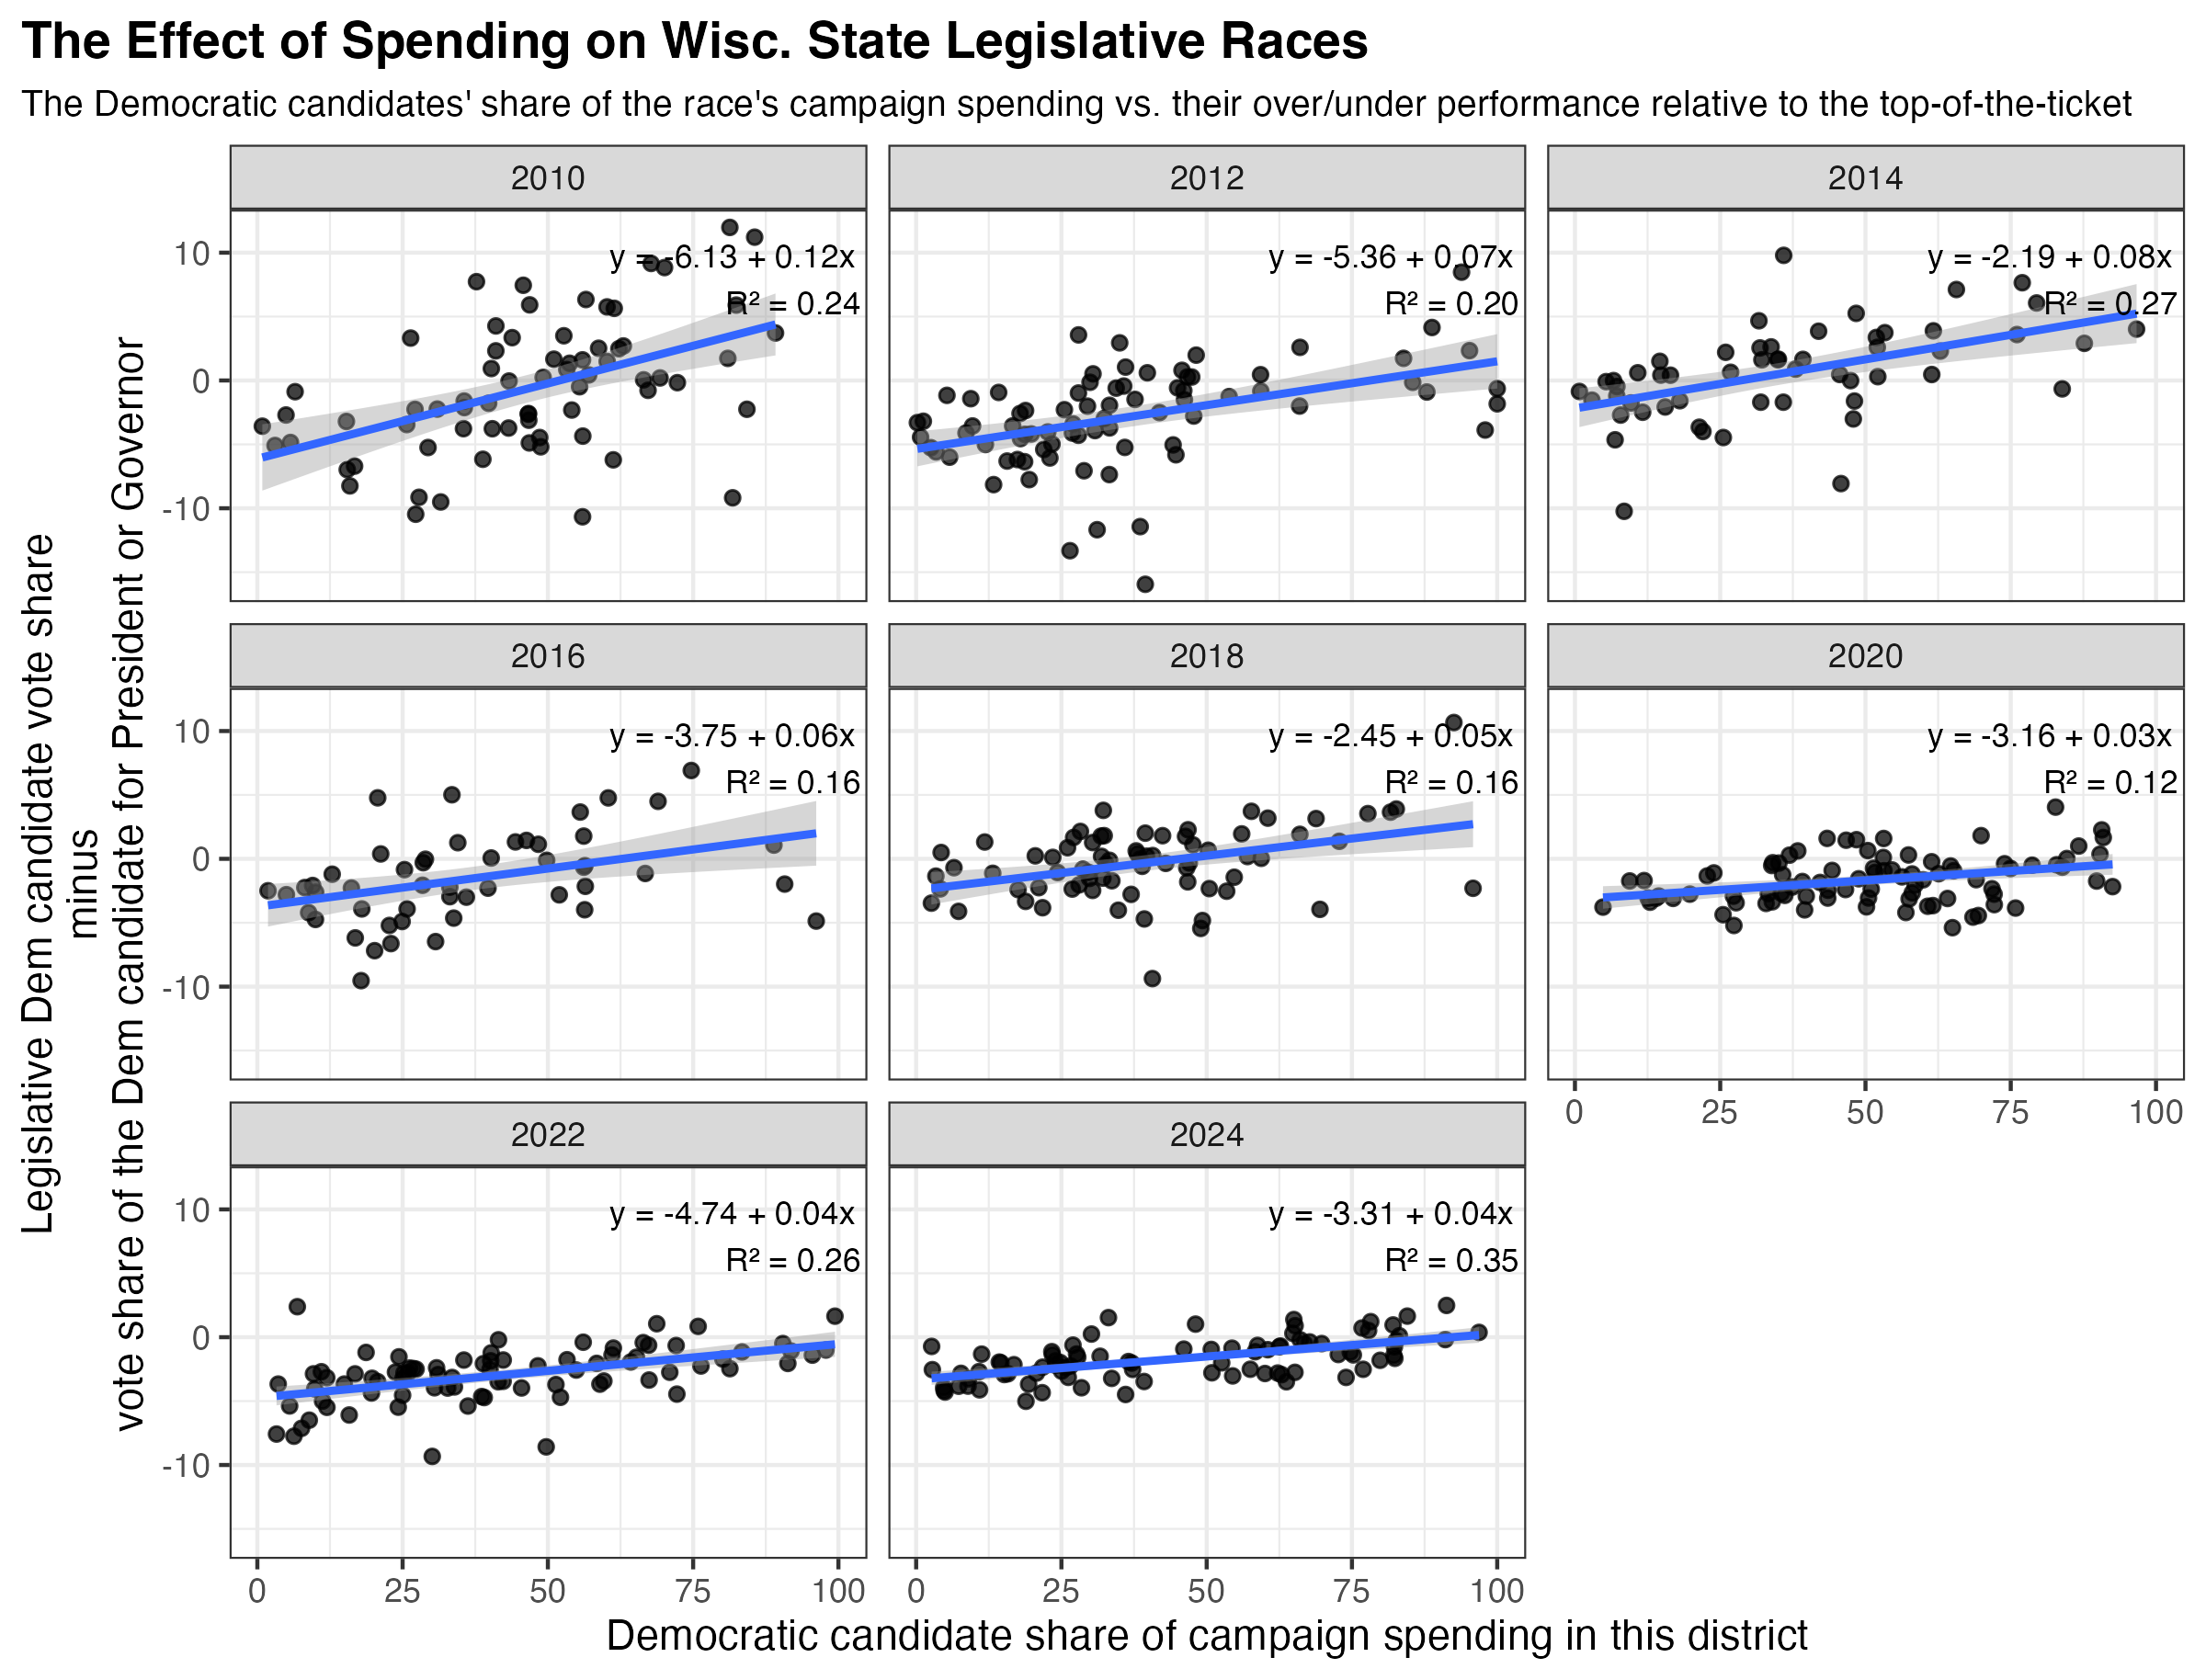
Take these ratings with a grain of salt. I considered several factors for each district, including past election results within the current boundaries of the district. If the incumbent is seeking reelection, I considered how that incumbent has fared relative to statewide candidates of the same party. As I’ve written in the past, incumbency still tends to be worth several points on the margin in Wisconsin legislative races, and, if anything, the advantages are larger for Republicans. Finally, I consider fundraising statistics through the first half of 2026. I see large fundraising hauls as an indication of which races the parties themselves believe will be competitive. I’ve calculated that the benefits of campaign spending in these races are real but quite small.
The ratings here are mine alone. For each race, I provide links to my website containing campaign finance data, past district election results, and demographic profiles. Use that data to inform your own opinion. It includes breakdowns of historic election results in current district boundaries for every state legislative seat.
All descriptions of prior election results in these districts are based on the current district boundaries, unless otherwise noted. All vote shares are the percentage of the two-party vote.
State Senate
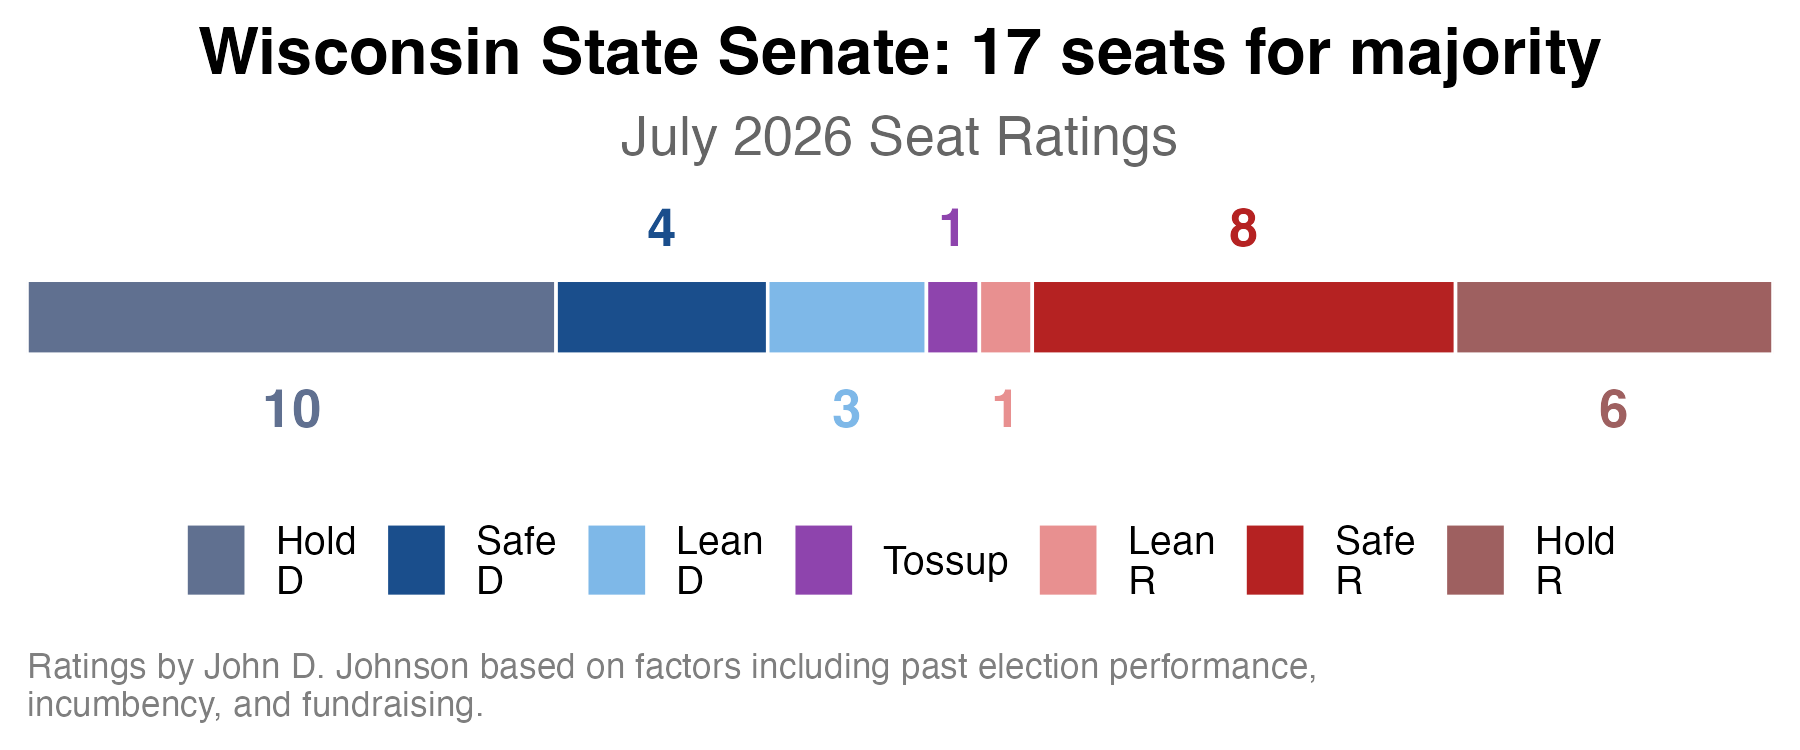
Of the State Senate’s 33 seats, Democrats already hold 10 in the even-numbered class of districts that held elections 2 years ago. They can get to a majority of the whole chamber simply by winning the 7 seats I classify as Safe or Lean D. For this reason, I rate the chamber as a whole Lean D.
District 21, Racine & southern Milw Co
This district has moved in a Democratic direction in recent cycles. Back in 2016, it voted for Trump and Ron Johnson. In 2018, it split between Walker and Baldwin. Biden won in 2020, but it split again between Evers and Johnson in 2022. In 2024, the district went blue, with Harris and Baldwin both winning about 51%.
Incumbent Republican Van Wanggaard declined to seek reelection. Only one candidate from each party qualified for the ballot, so the general election will pit Republican Jim Croft, a Franklin-based businessman, against Democrat Trevor Jung, a former Racine alder. In the first half of the year, Croft raised $123,000 to Jung’s $175,000.
Rating: Lean D. Had he run, Van Wanggaard would have faced a tough reelection campaign, given the new shape of the district following the 2024 redistricting and the growing leftward lean of the suburban areas within it. Name recognition and campaign experience might still have been enough to put Van Wanggaard over the top, but now those Republican advantages are gone.
District 5, West Allis & western Waukesha Co
This district has gone from solidly red to consistently blue, at least at the top-of-the-ticket during the Trump era. In 2016 and 2018, it voted for every Republican candidate for President, Governor, or US Senator. Since then, not a single Republican has won a majority of the vote for one of those offices. In 2024, Harris won 53% to Baldwin’s 52.5%, making it a rare place where Harris outperformed Baldwin.
Incumbent Republican Rob Hutton is not seeking reelection. The general election features Republican Mike Roberts, a physical therapist and political newcomer, against Robyn Vining, currently a Democratic member of the State Assembly.
In the first half of 2026, Roberts raised $233,000 to Vining’s $169,000.
Rating: Lean D. Any district that grew more blue between 2020 and 2024 is likely to stay that way in 2026.
District 17, Platteville
On the one hand, this district, which covers the southwestern corner of the state, seems like a safe bet for a Democratic pickup because no Republican candidate for President, Governor, or US Senator has won the district going back to 2016. On the other hand, Democratic strength has steadily shrunk here, and Republicans are fielding an incumbent with a strong track record of outperforming the rest of his party.
To illustrate: Clinton won 52.7% of the two-party vote in this district, falling to 52.6% for Biden (despite his statewide share growing) and 50.5% for Harris. Meanwhile, Marklein regularly outperforms other members of his party. In 2022, Marklein won 60% of the vote to Tim Michel’s 52% (in the 2022 boundaries of the district). In the 2018 version of the district, Marklein won 54% to Walker’s 49%. And in 2014, Marklein again outperformed, winning 55% to Walker’s 51%.
Marklein will face one of three Democrats running in the August primary. The Democrats are Jenna Jacobson, who is currently a member of the State Assembly, child-care provider and advocate Corrine Hendrickson, and Potosi businesswoman Lisa White.
Through the first half of the year, Marklein raised $300,000; Jacobson $109,000; Hendrickson $30,000; and White $8,000.
Rating: Tossup. Averaging the past several years of races makes this seat look more blue than it actually is. 2024 was the worst year for Democrats here in recent memory. Marklein’s track record of outperforming the Republican standard bearer by 4-8 points could be enough to save him, even in a bad year for the WisGOP.
District 31, Eau Claire
This district hasn’t voted for a Republican for President, Governor, or US Senator in any election since at least 2016. The results have often been close, but a slight Democratic advantage has prevailed each time. Clinton won 51% in 2016, Biden 52% in 2020, and Harris 51% again in 2024.
Democratic incumbent Jeff Smith faces Republican challenger and current Eau Claire county board member Michele Magadance Skinner. Skinner entered the race quite late, in April 2026, after GOP Senator Jesse James dropped his campaign for the 31st district. James currently represents the neighboring 23rd senate district but was seeking election to the 31st following the 2024 redistricting.
In the first half of 2026, Smith raised $163,000 to Skinner’s $120,000.
Rating: Lean D. Smith and other Democrats have held onto this seat during tough years for the party statewide. With the advantages of incumbency and the general anti-Trump mood of the state, I expect another victory for him. Still, this seat is the only remotely plausible Republican pickup opportunity, and the Committee to Elect a Republican Senate appears to be spending money on it accordingly.
District 25, Superior
If District 31 is a stretch goal for Republicans, the 25th District to its north is a stretch goal for Democrats. In its current boundaries, the district has voted solidly, if not overwhelmingly, for Republicans in every year except 2018. In 2018, Baldwin won with 53% of the vote, while Evers narrowly lost with 49%. 2024 was much worse for Democrats. Harris carried just 43% of the vote to Baldwin’s 45%.
Two former Republican Assembly members, Angie Sapik and Erick Severson, are challenging each other for the Republican nomination. The winner will face Democrat Charly Ray, a bookstore owner from Bayfield.
Through the first half of 2026, Ray raised $31,000 to $117,000 for Sapik and $39,000 for Severson.
Rating: Lean R. The northwestern part of the state, while containing historically Democratic regions along Lake Superior, has overall trended Republican. It would take a spectacular blue wave to put the 25th truly in play for Democrats.
Safe seats
In my judgement, the following districts are safe Republican seats: 33rd – Oconomowoc, 23rd – Rice Lake, 13th – Watertown, 11th – Salem Lakes, 19th – Grand Chute, 1st – Harrison, 29th – Wausau, and 9th – Sheboygan.
I rate the following safe Democratic: 15th – Janesville, 7th – Milwaukee, 3rd – Milwaukee, and 27th – Madison.
State Assembly
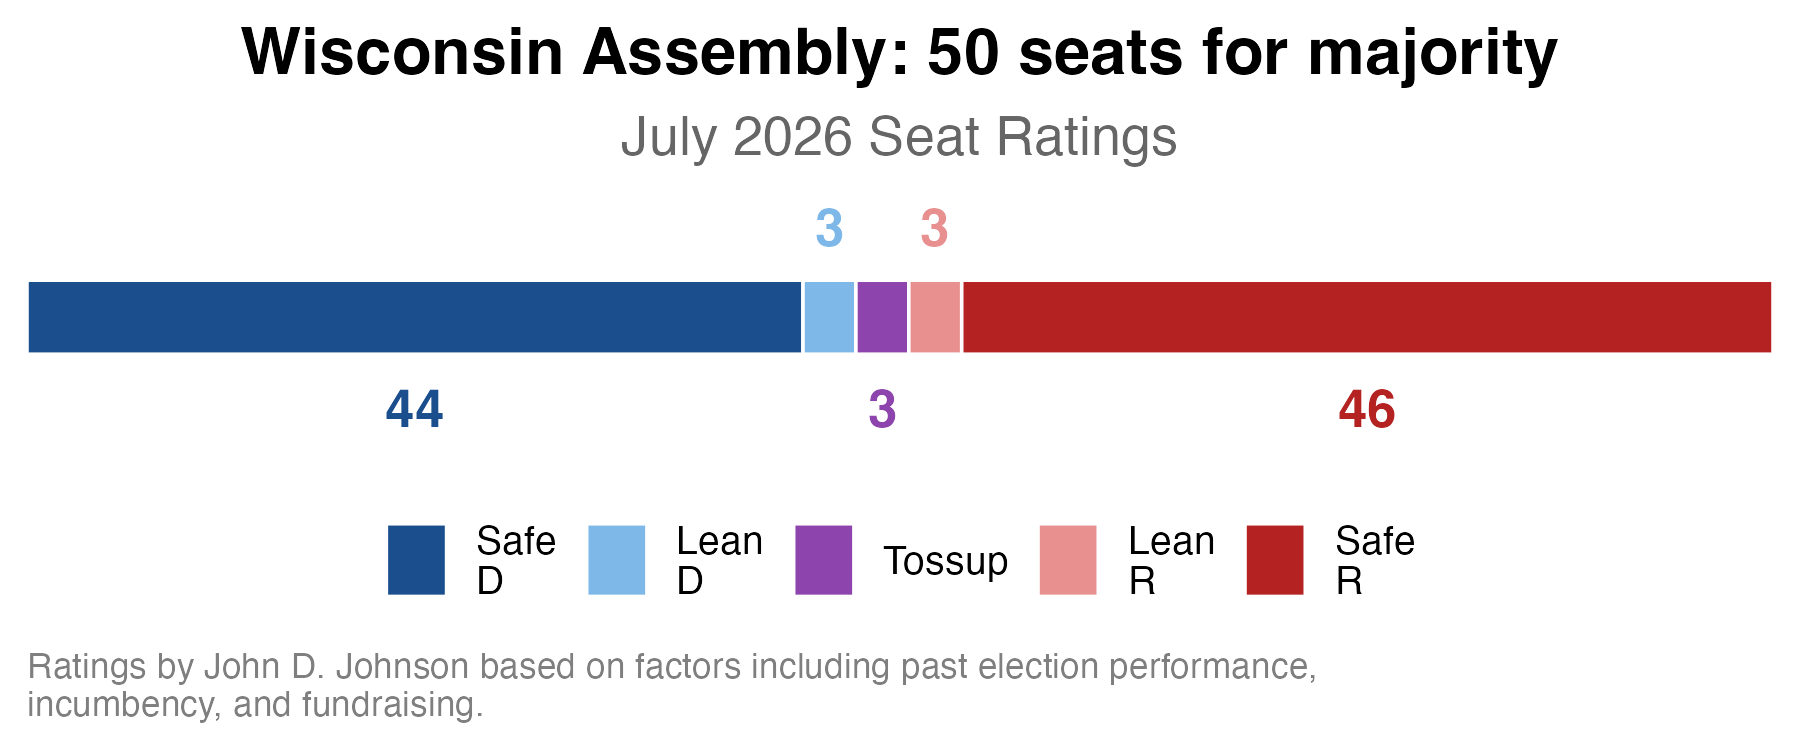
In my estimation, 47 Assembly seats are Safe or Leaning D, while 49 are Safe or Leaning R. I expect control of the chamber to come down to the three Tossup districts. For this reason, I rate the chamber as whole a Tossup. However, you could make the argument that the Assembly leans slightly Republican, since Democrats must win all three of the Tossup districts in order to win a 1-seat majority.
District 30, River Falls
On paper, a lot about the 30th Assembly District seems comfortably Republican. Since 2016, Tammy Baldwin’s 2018 landslide is the only time a Democrat won a race for President, Governor, or US Senate in this district. On the other hand, the district, in the distant Twin Cities exurbs, has shifted somewhat toward the Democrats. Kamala Harris received 48% of the vote in 2024, up from 46% for Clinton in 2016.
Republican incumbent Shannon Zimmerman faces a challenge from Democrat Kevin Knoke, a teacher and Army veteran.
Notably, this district was added to the Democratic Legislative Campaign Committee’s national list of Target Races, drawing attention from donors across the country. Through the first half of 2026, Knoke raised $66,000 to Zimmerman’s $29,000.
Rating: Lean R. The last two midterm elections have trended in the right direction for Democrats in the 30th district. Evers improved from 48.8% in 2018 to 49.8% in 2022. Still, Zimmerman is a strong incumbent who regularly outperforms Republicans at the top-of-the-ticket by several percentage points. Even in a good year for Democrats, Zimmerman’s name recognition and campaign experience could be enough to hold his seat.
District 92 – Menomonie
This district, represented by Republican Clint Moses, is located just north of Eau Claire. Politically, it leans firmly Republican, but Democrats have a few good years. Evers and Baldwin both won in 2018. In 2022, Evers won again, but only by 29 votes.
On the Republican side, Clint Moses, who is seeking reelection, raised $25,000 in the first half of the year.
Two Democrats will be on the ballot in August. One, Mel Marin, raised fewer than $500 in the first half of the year. The other, businessman Jeremiah Frederickson raised $46,000.
Rating: Lean R.
District 85 – Wausau
The 85th district covers central Wisconsin’s largest city, Wausau. Here is a true microcosm of the state. If there was ever a district to split its ticket, it would be the 85th. In 2024, Trump won the district by 180 votes and Baldwin by 289. In 2022, Evers won by 283 votes, Johnson by 800. And in 2018, Scott Walker carried the district by 1,503 votes while Tammy Baldwin won it by 1,722.
Will the trend continue in 2026? Republican incumbent Patrick Snyder is seeking reelection. In 2024, he won by 1,900 votes (53%), a great deal better than Trump’s narrow victory of 50.3%
Through June 30th, Snyder raised $26,000 compared to $64,000 raised by John Kroll, the Democratic challenger and current Marathon County board member.
Rating: Lean R. A “normal” midterm victory for Democrats would likely result in another split ticket in this district, with the advantage going to the Republican incumbent.
District 88 – De Pere
This was the most narrow Republican victory of the bunch in 2024, when Ben Franklin won by 220 votes in an open race for the substantially redrawn district.
In its new boundaries, this district has trended a bit towards the Democrats. Trump won it by about 2,000 votes in 2016. He won it again in 2020 but only by 239 votes. In 2024, it flipped to Harris by an even narrower margin–121 votes.
In 2026, Ben Franklin faces Democratic candidate Brandy Tollefson, who is a member of the De Pere school board. In the first half of the year, Franklin raised $21,000 to Tollefson’s $64,000.
Rating: Tossup. If this were an open race, I’d rate it Lean D, but given Franklin’s previous success running ahead of other Republicans, I could see this going either way. Keep an eye on fundraising in this district, which could be the difference maker.
District 94 – La Crosse
The 94th is the only Assembly district a Democratic candidate won which also went for Trump. In 2024, Trump won this district by 794 votes, and Republican Senate candidate Eric Hovde won it by 9 votes. Meanwhile, Democratic incumbent Steve Doyle won his 8th consecutive election to the seat by 217 votes.
Doyle is seeking reelection in 2026, when he will face Republican challenger Keith Purnell, a career Army veteran. In the first half of the year, Doyle raised $51,000 to Purnell’s $24,000.
Rating: Lean D. This district is always close enough to inspire a well-funded Republican campaign, but Doyle has survived tougher national political environments than 2026 is sure to be for Democrats.
District 61 – Greenfield
Bob Donovan is the Assembly Democrat’s white whale. In 2022, he won his district (then the 84th), despite Tony Evers winning it by over 53%. In that year, the Democratic candidate LuAnn Bird outspent Donovan by $327,000. After the 2024 redistricting, Donovan and Bird found themselves running in a rematch in the new 61st district. This time Bird outspent Donovan by $1.14 million. Despite this, Donovan’s vote share actually increased, from 51% to 52%.
Donovan, who raised $20,000 in the first half of the year, will face one of three Democrats in November. Those Democrats running in the August primary are Lawanda Chambers ($22,000), Ben Brist ($24,000), and Brian Bock ($4,000).
Rating: Tossup. In an open race, I’d call this Lean D, but Donovan’s remarkable track record of overperforming other Republicans in this district, even in the face of severe funding disadvantages, should not be underestimated.
District 89 – Green Bay
Democrat Ryan Spaude won this substantially redrawn district in 2024. The district, in its current boundaries, voted solidly Republican in 2016, but since then, it has moved in a Democratic direction. Trump won 52.1% in 2016, 49.6% in 2020, and 49% in 2024.
Through June 30th, Spaude raised $71,000. His opponent, Republican Bobby Lindsey, raised $9,000.
Rating: Safe D. This district is trending blue, and now it has a well-funded Democratic incumbent.
District 26 – Sheboygan
Prior to the 2024 redistricting, the City of Sheboygan was split into two Republican districts. Now the 26th district envelops the whole city into one moderately Democratic-leaning seat. There hasn’t been much trend in any direction here. Clinton won 51.7%, Biden 51.8%, and Harris 51.4%. In 2024, Democrat Joe Sheehan ever-so-slightly outperformed Harris en route to winning the district.
Sheehan raised $33,000 in the first half of the year. He will face one of three Republican hopefuls, one of whom has raised $756.93 and the other two $0.
Rating: Safe D.
District 53 – Neenah
The 53rd district, as drawn in 2024, is essentially a blue seat. Biden and Harris both carried it by 52.2%. Nonetheless, Republican Dean Kaufert won the Assembly seat in 2024 by 364 votes. This was arguably the biggest Republican upset that year, and much of it might be attributed to Kaufert’s specific political profile. A longtime politician in this very purple region, he was one of the only Republicans to vote against Act 10 while in the Assembly. After that, he served as mayor of Neenah. Kaufert is not seeking reelection, leaving the seat open in 2026.
Only one Democrat is in the race, Menasha city councilmember Becky Nichols, who raised $9,000 in the first half of the year. She will face local Republican businessman David Daniels, who raised $7,000, and independent Rachael Dowling, who raised $380.
Rating: Lean D. It was a surprise when a Republican narrowly won this seat in 2024. Given that it’s an open seat in a midterm year, I expect a Democratic victory.
District 21 – Oak Creek
Historically, the southern suburbs of Milwaukee County have leaned moderately to the right, but in the Trump era, that has changed. The current boundaries of the 21st district illustrate this. In 2016, the district gave Republican Senator Ron Johnson 53% of the vote, while Trump nearly won–losing by just 68 votes. Since then, a Democrat has won every election for President, Governor, or US Senator in the district. In 2024, Harris won 52% of the vote and Baldwin 54%.
Throughout this entire period, Republican incumbent Jessie Rodriguez has bucked the trend, continuing to win reelection. In 2024, her Democratic opponent outspent her by $1.09 million. The result? Rodriguez won 51.4% of the two-party vote–3.5 points better than Donald Trump’s vote share.
Rodriguez is not running for reelection in 2026, leaving the race wide open. The Republican in the race, Dylan Pfaffenbach, will face one of two Democrats, either Daniel J. Bukiewicz, the mayor of Oak Creek and a longtime union organizer, or David Liners, an activist endorsed by the Wisconsin Electoral Socialists.
In the first half of the year, Pfaffenbach raised $8,000; Bukiewicz raised $79,000; and Liners raised $26,000.
Rating: Lean D. Republicans were just able to hang onto this district with a popular, longstanding incumbent. In 2026, that advantage is gone.
District 51 – Dodgeville
Todd Novak is an unusual character in Wisconsin politics. He was the first openly gay Republican elected to the state legislature. During his time in office, he has established a relatively bipartisan track record (certainly, by contemporary standards). His current campaign website prominently features a favorable quote from the state’s Democratic Attorney General. All of this helps to explain why Novak has kept his seat in what is, frankly, not even a purple district. It is blue. Under the current boundaries, no Democratic candidate for President, Governor, or US Senator has won the district by less than 3.5 points.
In 2024, Harris won 51.8% of the vote and Baldwin 54%. Despite facing a well-funded Democratic challenger (he was outspent by $321,000), Novak won with 51.7% of the vote, a victory margin of 1,158 ballots.
Through the first half of 2026, Novak raised $25,000. The sole Democrat in the race, conservation warden Ben Gruber, raised $93,000. A candidate named Nathan Tataje from the American Solidarity Party will also be on the ballot, but he reported no funds raised through June 30th.
Rating: Tossup. Democrats have targeted this district for many cycles with no success. They’ll certainly put Novak’s remarkable record of outperforming his party to the test once again in 2026.
District 96 – La Crosse
Democratic candidate Tara Johnson barely won this seat in 2024, winning just 51% of the vote, and seriously underperforming Harris (54.2%) and Baldwin (55.9%). Johnson faced longtime Republican incumbent Loren Oldenburg in this substantially redrawn district. I attribute Johnson’s underperformance to Oldenburg’s strong incumbency advantage.
In 2026, Johnson is seeking reelection and Oldenburg is not pursuing a rematch. Instead, Johnson will face Republican candidate Jim Green. Through June 30th, Green raised $2,000 to Johnson’s $46,000.
Rating: Safe D. Without Oldenburg in the race, I expect the Assembly result to conform more closely to the district’s solid Democratic lean.
District 43 – Janesville
Democratic candidate Brienne Brown won an open race to represent the 43rd district in 2024. Brown won 51.3% of the vote, to Harris’ 52.7% and Baldwin’s 53.8%.
In 2026, Brown will face Republican candidate Paul McGraw. In the first half of the year, Brown raised $28,000 to McGraw’s $9,000.
Rating: Safe D. In different circumstances, a seat like this might qualify as Lean D, but in a midterm year like this one, with a smaller more politically-engaged electorate, I see little chance of a flip here. In the 2025 Wisconsin Supreme Court election, fully 60% of this district’s voter choice the Democratic-endorsed candidate.
District 91 – Eau Claire
The 91st district has been represented by Democrat Jodi Emerson since 2018. Until the 2024 redistricting, it was a heavily Democratic seat largely confined to the City of Eau Claire. The latest redistricting substantially redrew the district, adding a large swathe of more conservative outlying areas. In 2024, Emerson won reelection facing a strong campaign from a Republican challenger, who outperformed the rest of the GOP ticket. Emerson won 51.6% of the vote, to Harris’ 52.3% and Baldwin’s 53.8%.
In 2026, Emerson faces Republican Bruce Stabenow, who raised just $2,000 in the first half of the year. Meanwhile, Emerson raised $67,000.
Rating: Safe D. Emerson survived 2024, a good year for Republicans, in the new boundaries of her district. All signs point to an easier victory in 2026.
Additional districts
There are 10 additional districts with a Democratic incumbent who won with less than 55% in the 2024 general election. In most, these Democratic Assembly candidates won fewer votes than either Harris or Baldwin in their districts. Some of these candidates were elected to the Assembly for the first time in 2024, but now, in 2026, a Democratic incumbent is running for reelection in each of these seats. In all but one district (the 66th), the Democratic incumbent enjoys a considerable fundraising lead over their Republican challenger. And all of these are districts where, as is the case statewide, Democrats tend to do better when turnout is lower. For all these reasons, I rate this collection of seats Safe D. These are the following districts, listed from smallest to largest Democratic lean: 95, 46, 90, 54, 93, 71, 65, 66, 40, and 14.
There are no previously undiscussed Republican districts where the Republican won by less than 55%.
Any districts not yet mentioned are places where the incumbent won at least 55% of the two-party vote in 2024. I classify all of these as Safe R or Safe D based on the party currently occupying the seat. Swings in excess of this size do occasionally happen, but they are very rare and seldom flip a seat. A few of these districts could potentially drift into competitive territory based on unusual circumstances like a local scandal or an unexpectedly large wave election for either party. But from our vantage point of July, I doubt any of these seats will change hands in November.