What the Research Shows about Mobile Sports Betting
Wisconsin is taking steps to legalize sports betting on your phone, joining 32 states who have already done so. In November, a bipartisan bill to legalize mobile sports betting advanced out of committee in both houses of the Wisconsin legislature, before being pulled from the agenda shortly before a scheduled vote in the Assembly. Opponents to the bill include those who oppose mobile sports betting on the merits, as well the trade organization for DraftKings and Fanduel, who oppose the bill for their own, very different reasons.According to reporting by WPR, the bill’s sponsor intends to reintroduce it in early 2026.
Over the past couple of years, economists have undertaken a number of interesting studies measuring the consequences of legalized sports betting on consumers. This post summarizes some of their major findings.
Sports betting—mobile or otherwise—was limited to just a handful of locations in the country prior to 2018, when the US Supreme Court struck down the federal law banning most forms of sports gambling.
Since then, states legalized gambling at different paces and in different forms, sometimes limited to physical sportsbook locations, sometimes through the internet. Wisconsin legalized tribal sportsbooks in 2021, but they are limited to brick-and-mortar locations, of which there are currently 27.
The rollout of legal sports betting at different times in different places creates a sort of natural experiment, allowing researchers to quantify legal gambling’s consequences.
Researchers have studied questions like: how much do gamblers spend on gambling? What did they spend this money on before sports betting became easily available? How many bettors become “problem” gamblers?
We can imagine more or less troubling answers to each of these questions. Maybe sports bettors are just wagering money they would’ve otherwise spent on other kinds of entertainment. On the other hand, maybe they are gambling money they can’t afford to lose.
A 2024 paper by Scott Baker et al. tackled these questions using a transaction-level dataset of household spending. The dataset was assembled by a private firm from bank, credit card, and financial technology records. Using this data, the authors could measure all kinds of spending by households, before and after online betting legalization, including spending on sportsbooks like DraftKings and Fanduel as well as traditional investments like Vanguard or Fidelity.
In their study, about 14% of households in legalized states engaged in mobile sports betting. The average household bet $102 per quarter, but there was a lot of variation. The lowest third of bettors only deposited an average of $1.39 per quarter, while the highest third of bettors deposited $299 per quarter with an online sportsbook. Among those who ever bet, 20% deposited money only once, 70% did so at least three times, and 40% made 10 or more deposits.
Sports betting is a financial loser for most participants, so the money has to come from somewhere else. Baker and his coauthors found “that increases in sports betting do not coincide with decreases in participation in lotteries or other online gambling outlets like poker sites.” Instead, “betting activity crowds out financial investments, leading to a reduction in net deposits to brokerage accounts.” They estimate, “that the causal effect of $1 of online sports deposits is a reduction in net investment of just under $1.”
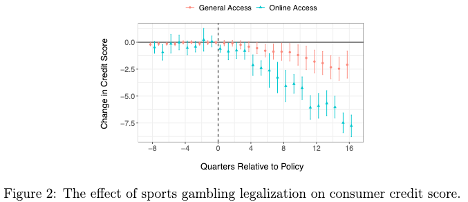
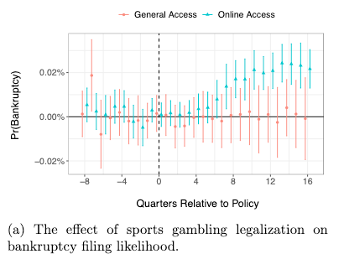
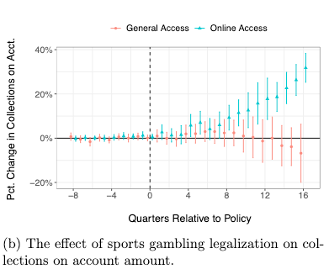
A 2025 paper by Brett Hollenbeck et al. used a representative panel of credit rating agency data to measure what happens in states after they legalize sports betting. This study is particularly relevant to Wisconsin because it compares states with only physical sportsbooks (“general access”) with those same states after they legalize mobile sportsbooks (“online access”).
They found that average credit scores declined by three times as much in states with online access to sportsbooks as in states with only physical ones.
They estimated a “roughly 10% increase” in bankruptcies in states with online sportsbooks. “[T]his increase leads to. . . roughly 30,000 more bankruptcies a year.”
States with online sportsbooks also saw statistically significant increases in debt collection balances.
The authors of this study can’t tell which people in their credit data panel are bettors, so these estimates are for the entire population of states which have legalized mobile betting. The declines in credit scores and increases in bankruptcies and debts going to collection are all surely much higher among the minority of the population who is placing bets. “Assuming that sports betting does not impact financial outcomes for the non-betting population, it implies that the average effect on actual bettors is 5-10 times larger than our estimates.”
All studies seem to agree that a great deal of gambling volume is driven by a small group of problem gamblers. A 2025 paper by Wayne J. Taylor et al. used individual-level financial records to estimate that the rate of people gambling more than 1% of their income each month grew from 0.2% to 0.9% of the population following the legalization of online sports betting. “Legalization also generated spillover effects, including a 20% increase in mass-market alcohol consumption and a 75% increase in calls to gambling helplines. State tax revenues were lifted by $0.78 per capita monthly. . . due to legalization.”
Another way of measuring problem gambling is by tracking internet searches for terms related to gambling addiction. A 2025 article in JAMA Internal Medicine did this, finding a 35% increase in such searches in Illinois and a 37% increase in Michigan following the legalization of sportsbooks.
The literature shows that legalizing mobile sportsbooks increases the number of people betting. This results in worse financial health—less saving, more debt, and more bankruptcies—for a subset of problem gamblers. All these problems are exacerbated by mobile sports betting, as opposed to physical sportsbooks.