When the election of the liberal justice Janet Protasiewicz flipped the balance of the Wisconsin Supreme Court in 2023, liberal groups responded immediately. A lawsuit was filed the day after she joined the court, which led to the new liberal majority barring further use of the existing state assembly and senate districts. Those maps had been crafted by Republican legislators and redounded greatly to their benefit. In 2022, the Democratic Governor Tony Evers won reelection with 51.1% of the vote, yet he only carried a majority in 39 of 99 Assembly and 13 of 33 Senate seats.
For fear of the Court imposing an even worse map (for them), Republican legislators responded by passing a map drawn by Evers. Evers accepted this compromise; although it was opposed by almost all state legislators from his own party. The results of this new map were on full display in November 2024. Harris lost the state with 48.7% of the vote, but she still carried a majority of the vote in 49 of 99 assembly seats and 17 of 33 senate seats.
Throughout all of this, the 8 Wisconsin congressional districts remained unchanged. In fact, the congressional map used in 2022 was barely different from the one drawn in 2011.
Spring 2025 once again saw the ideological balance of the Supreme Court at stake. This time, a victory by the conservative candidate would have flipped the majority back to its pre-2023 status quo. Instead, the liberal candidate Susan Crawford won by 10 points, and liberal groups again responded by promptly filing redistricting lawsuits, this time challenging the Congressional map.
To date, two petitions and one complaint (from different prominent firms) have been filed, each making quite different arguments as to why the state courts should toss the current map. The first two petitions were filed directly with the State Supreme Court. Although the court agreed to hear opposing and supporting briefs to the petitions, they ultimately declined to hear them in late June, issuing no comment about the merits of the arguments presented. The third complaint was filed with the Dane County circuit court shortly after the first two were rejected. For reasons I’ll discuss below, this latest case makes arguments which may bear more fruit for those seeking new maps.
You might think that adding up the results of a statewide April election in legislative districts should be simple, but it’s not.
First problem: the state currently doesn’t include political district numbers in the results for nonpartisan elections.
Second problem: votes in Wisconsin are counted, not in wards, but in combinations of wards called “reporting units,” and April nonpartisan elections can use different reporting units than in November elections.
Third problem: the reporting units used in April sometimes straddle partisan district lines.
So, my media consumer advisory is this; if you read an article telling you the results of an April election apportioned into legislative districts, you should expect to see an explanation of how the author obtained that data.
Here is how I do it. First, I identify the individual wards comprising each reporting unit. Then, I match those wards to the most recent GIS ward file I can find.[1] Every ward falls within a single political district, so I check to be sure that each ward in every reporting unit is assigned to the same district. If a reporting unit is split across multiple districts, I divide its vote according to the proportion of the reporting unit’s registered voters residing within each district.[2]
Here are the results of the 2025 April Supreme Court election between the Republican-endorsed candidate Brad Schimel and the Democratic-endorsed candidate Susan Crawford.
Crawford won 55.0% of the vote. Under the maps as currently used, this worked out to 54.5% of Assembly districts (54/99), 57.6% of Senate districts (19/33), and 50% of Congressional districts (4/8).
Table 1: Results of the 2025 Wisconsin Supreme Court Election in legislative districts
seats won by
Schimel
Crawford
State Assembly
45
54
State Senate
14
19
Congress
4
4
The next table compares those results with some of the other recent redistricting plans, either proposed or used. Under the GOP-drawn maps used in the 2022 election, Crawford’s 10-point net victory would’ve resulted in 5-seat Republican majority in the Assembly and a 3-seat Republican majority in the Senate.
Table 2: Results of the 2025 Wisconsin Supreme Court Election in select alternative legislative districts
Wisconsin’s state legislative maps now closely reflect the results at the top of the ticket. Both Donald Trump and Tammy Baldwin translated their narrow 1-point victories into 1-seat majorities of assembly districts. But actual Republican assembly candidates won a 5-seat majority.
In previous analyses, I found that incumbency advantage was worth about 4 points (net) for Republican Assembly candidates in both 2024 and 2022. This advantage means that the Republican Assembly majority can likely withstand election years resulting in a narrow statewide victory for Democrats. But anything approaching Crawford’s landslide victory puts many Republican incumbents in competitive districts much more at risk.
Here are the 6 closest battleground seats in the State Assembly. They are all seats which split their vote between the Assembly and presidential races. Five of them voted for Harris and a Republican legislator, while one voted for Trump and a Democratic legislator. In all instances, Susan Crawford defeated Schimel by double-digits.
Table 3: Election Results in Key Battleground Districts of the Wisconsin State Assembly
Dem or Lib % minus Rep or Con %
State Assembly
President
US Senate
WI Sup. Ct.
21st
-2.8
4.0
7.0
19.3
51st
-3.4
3.5
7.8
19.9
53rd
-1.2
4.4
6.1
18.0
61st
-3.2
2.2
3.7
13.5
88th
-0.7
0.3
1.2
11.3
94th
0.6
-2.1
0.0
12.3
Likewise, there are 4 battleground State Senate districts, one of which (the 31st) is currently represented by a Democrat and the rest by Republicans. Because Wisconsin elects odd-numbered senate districts during midterm years, these seats will hold their first elections under the new boundaries in 2026. As in the Assembly battlegrounds, Crawford won each of these districts by more than her statewide margin of victory.
Table 4: Election Results in Key Battleground Districts of the Wisconsin State Senate
Dem or Lib % minus Rep or Con %
President
US Senate
WI Sup. Ct.
5th
5.9
5.0
13.5
17th
1.0
4.6
17.9
21st
1.2
2.2
10.7
31st
2.2
4.7
18.0
[1] I begin with the most recent LTSB stateward ward boundary file (Jan. 2025 in this case). When recent annexations or incorporations make these boundaries already out-of-date, I obtain updated boundaries from the county. For the April 2025 election, I needed updated ward boundary files from Dane and Waukesha counties.
[2] I do this using a geocoded copy of the state’s voter file, but it could also be done using the state’s monthly ward-level registered voter report.
Many Americans love Donald Trump and even more hate him, but neither of these groups is large enough to win an election by themselves. Except when turnout is low, American elections for the past 9 years have turned with the preferences of those voters whose views of Trump are mixed.
In order to better understand these voters, the Marquette Law School Poll regularly invites a representative sample of American adults to answer the following two simple questions. What do you like about Donald Trump? What do you dislike about him? Respondents can write as much or as little as they want.
The answers to these questions, when paired with traditional multiple-choice items, show a large chunk of the electorate whose attitudes toward the president and broad policy issues, like immigration or trans rights, are malleable. These (potential) voters often hold combinations of views that are rarely found among politicians, making their support for any candidate contingent on issue salience, framing, and whatever ineffable quality makes some candidates seem more trustworthy than the rest.
At a high level, views of Trump changed little throughout the first three months of his presidency. Shortly before his inauguration, 49% of adults in our polling had a favorable opinion of him. That stood at 44% at the beginning of February and 46% in late March–all changes within the margin of error.
The overall patterns in the open-ended answers haven’t changed much either. In the latest poll, 50% of adults listed something they both like and disliked about Trump. 11% couldn’t name anything they disliked, and 36% couldn’t name anything they liked.
Summary of open-ended survey responses
in the Marquette Law School Poll, national adult sample
Attitude toward Donald Trump
survey dates
12/2-11/24
1/27-2/6/25
3/17-27/25
Can name likes and dislikes
51%
47%
50%
Doesn’t dislike anything
12%
14%
11%
Doesn’t like anything
35%
36%
36%
no answer
2%
3%
2%
This stability in overall attitude toward Trump doesn’t surprise me. After all, he has been at the center of American politics since his first primary campaign began a decade ago. Few voters lack an opinion of him and much of his behavior is already “priced in.”
But even though attitudes toward Trump himself are fairly stable, if trending a bit downward, opinions toward Trump’s favored policies are all over the place.
In our latest poll, we asked about 10 topics related to Trump’s agenda or recent Supreme Court decisions. The graph below shows the responses to each.
The most popular position across all of these questions was support for the 2020 Supreme Court ruling prohibiting workplace discrimination against “gay and transgender workers.” Eight-two percent of adults agreed with extending federal civil rights law to these workers.
At the same time, 72% of adults hope the Supreme Court upholds a Tennessee law prohibiting “medical providers from prescribing puberty-delaying medication or performing gender transition surgery for youth under 18.”
A large majority, 68%, support the deportation of undocumented immigrants when asked “Do you favor or oppose deporting immigrants who are living in the United States illegally back to their home countries?” When the wording is changed to include, “even if they have lived here for a number of years, have jobs and no criminal record?” support falls to 41% and opposition rises to 59%.
A decisive share of voters are not consistently “pro” or “anti” trans rights or deportation. Rather, their answers depend on the specific facts included in each question.
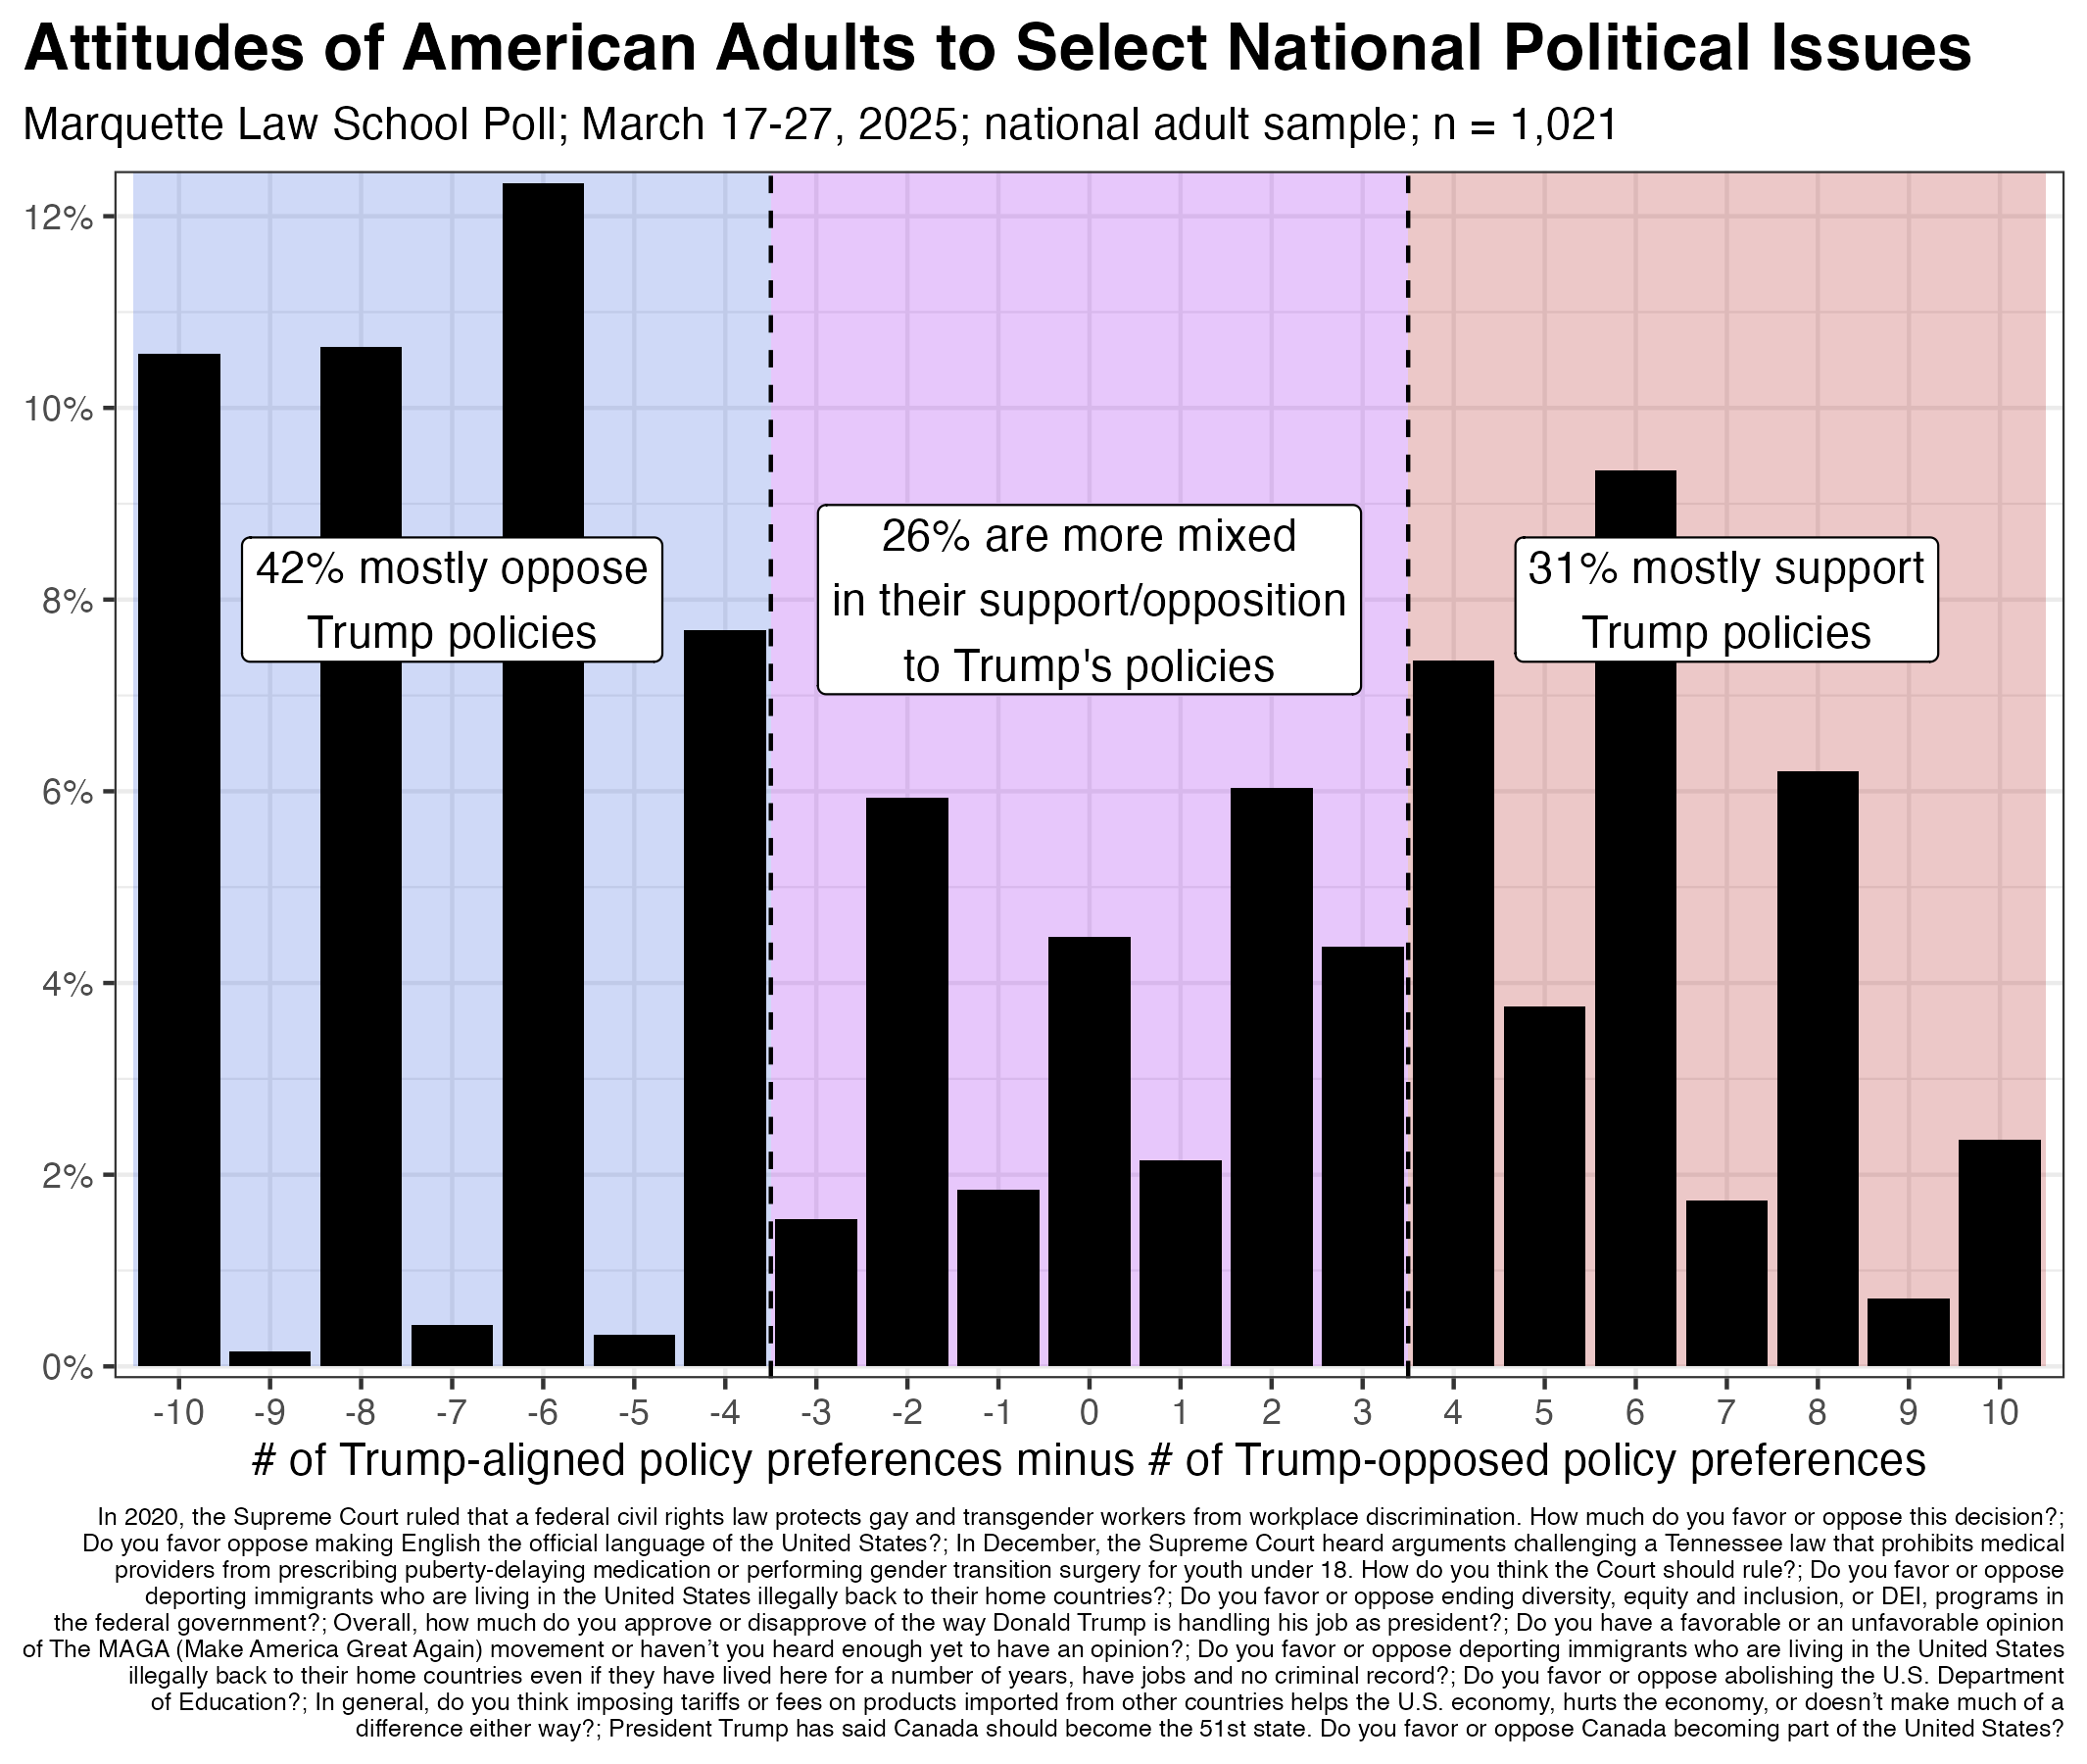
For each of the above questions, I coded a respondent as “1” if they supported the Trump/conservative position, “-1” if they chose the Democratic/liberal position, and “0” if they declined to take a side. A respondent receives a score of -10 if they took every liberal position and +10 if they always took the conservative side. The graph below shows the distribution of scores for all adults.
Few respondents fell into the most liberal or conservative categories. Forty-two percent are in the most liberal third and 31% are in the most conservative third of possible scores. Twenty-six percent of adults fell in the middle, with scores reflecting a mixture of support for conservative or liberal policies.
It is the open-ended answers from this last group that give insight into the views and beliefs of the most persuadable section of the electorate.
Click here to access our tool for viewing randomized responses to our open-ended questions. The tool allows you to filter responses by the respondent’s degree of support or opposition to Trump’s policies.