The Decline in Support for Democratic Candidates among Black Milwaukeeans is Easily Exaggerated
A recent New York Times opinion piece, “Inside the Rise of the Multiracial Right,” described growing support for Republican politicians among Black, Latino, and Asian Americans. The article offered Milwaukee as a particular example, writing, “In Milwaukee, the unity of the Black Democratic vote is splintering – along with the institutions that held it together for so long.”
As evidence, the author quotes 5 Black Milwaukeeans disillusioned with the Democratic Party for various reasons, but the article includes not a single statistic about election results in the city. Likely, this is because the facts don’t match this narrative. In Milwaukee, the decline in support for Democratic candidates among Black voters has been very slight—noticeably less than the national average.
Across the nation overall, Pew estimates that 91% of Black voters cast a ballot for Clinton in 2016, 92% voted for Biden in 2020, and 83% for Harris in 2024. Those estimates were made using validated-voter survey data. The progressive data firm Catalist used a modelled version of the national voter file to estimate that Clinton won 93% of Black voters, Biden 89%, and Harris 85%.
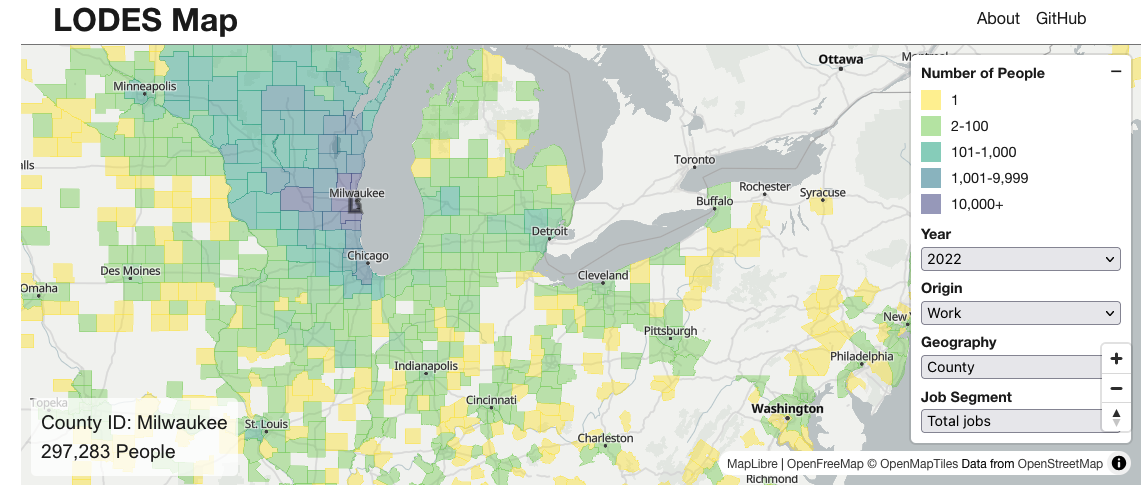
I lack access to either of those kinds of data for Milwaukee County specifically. But Milwaukee’s extremely high degree of racial segregation means that patterns in ward election results reveal much about how different demographic groups vote.
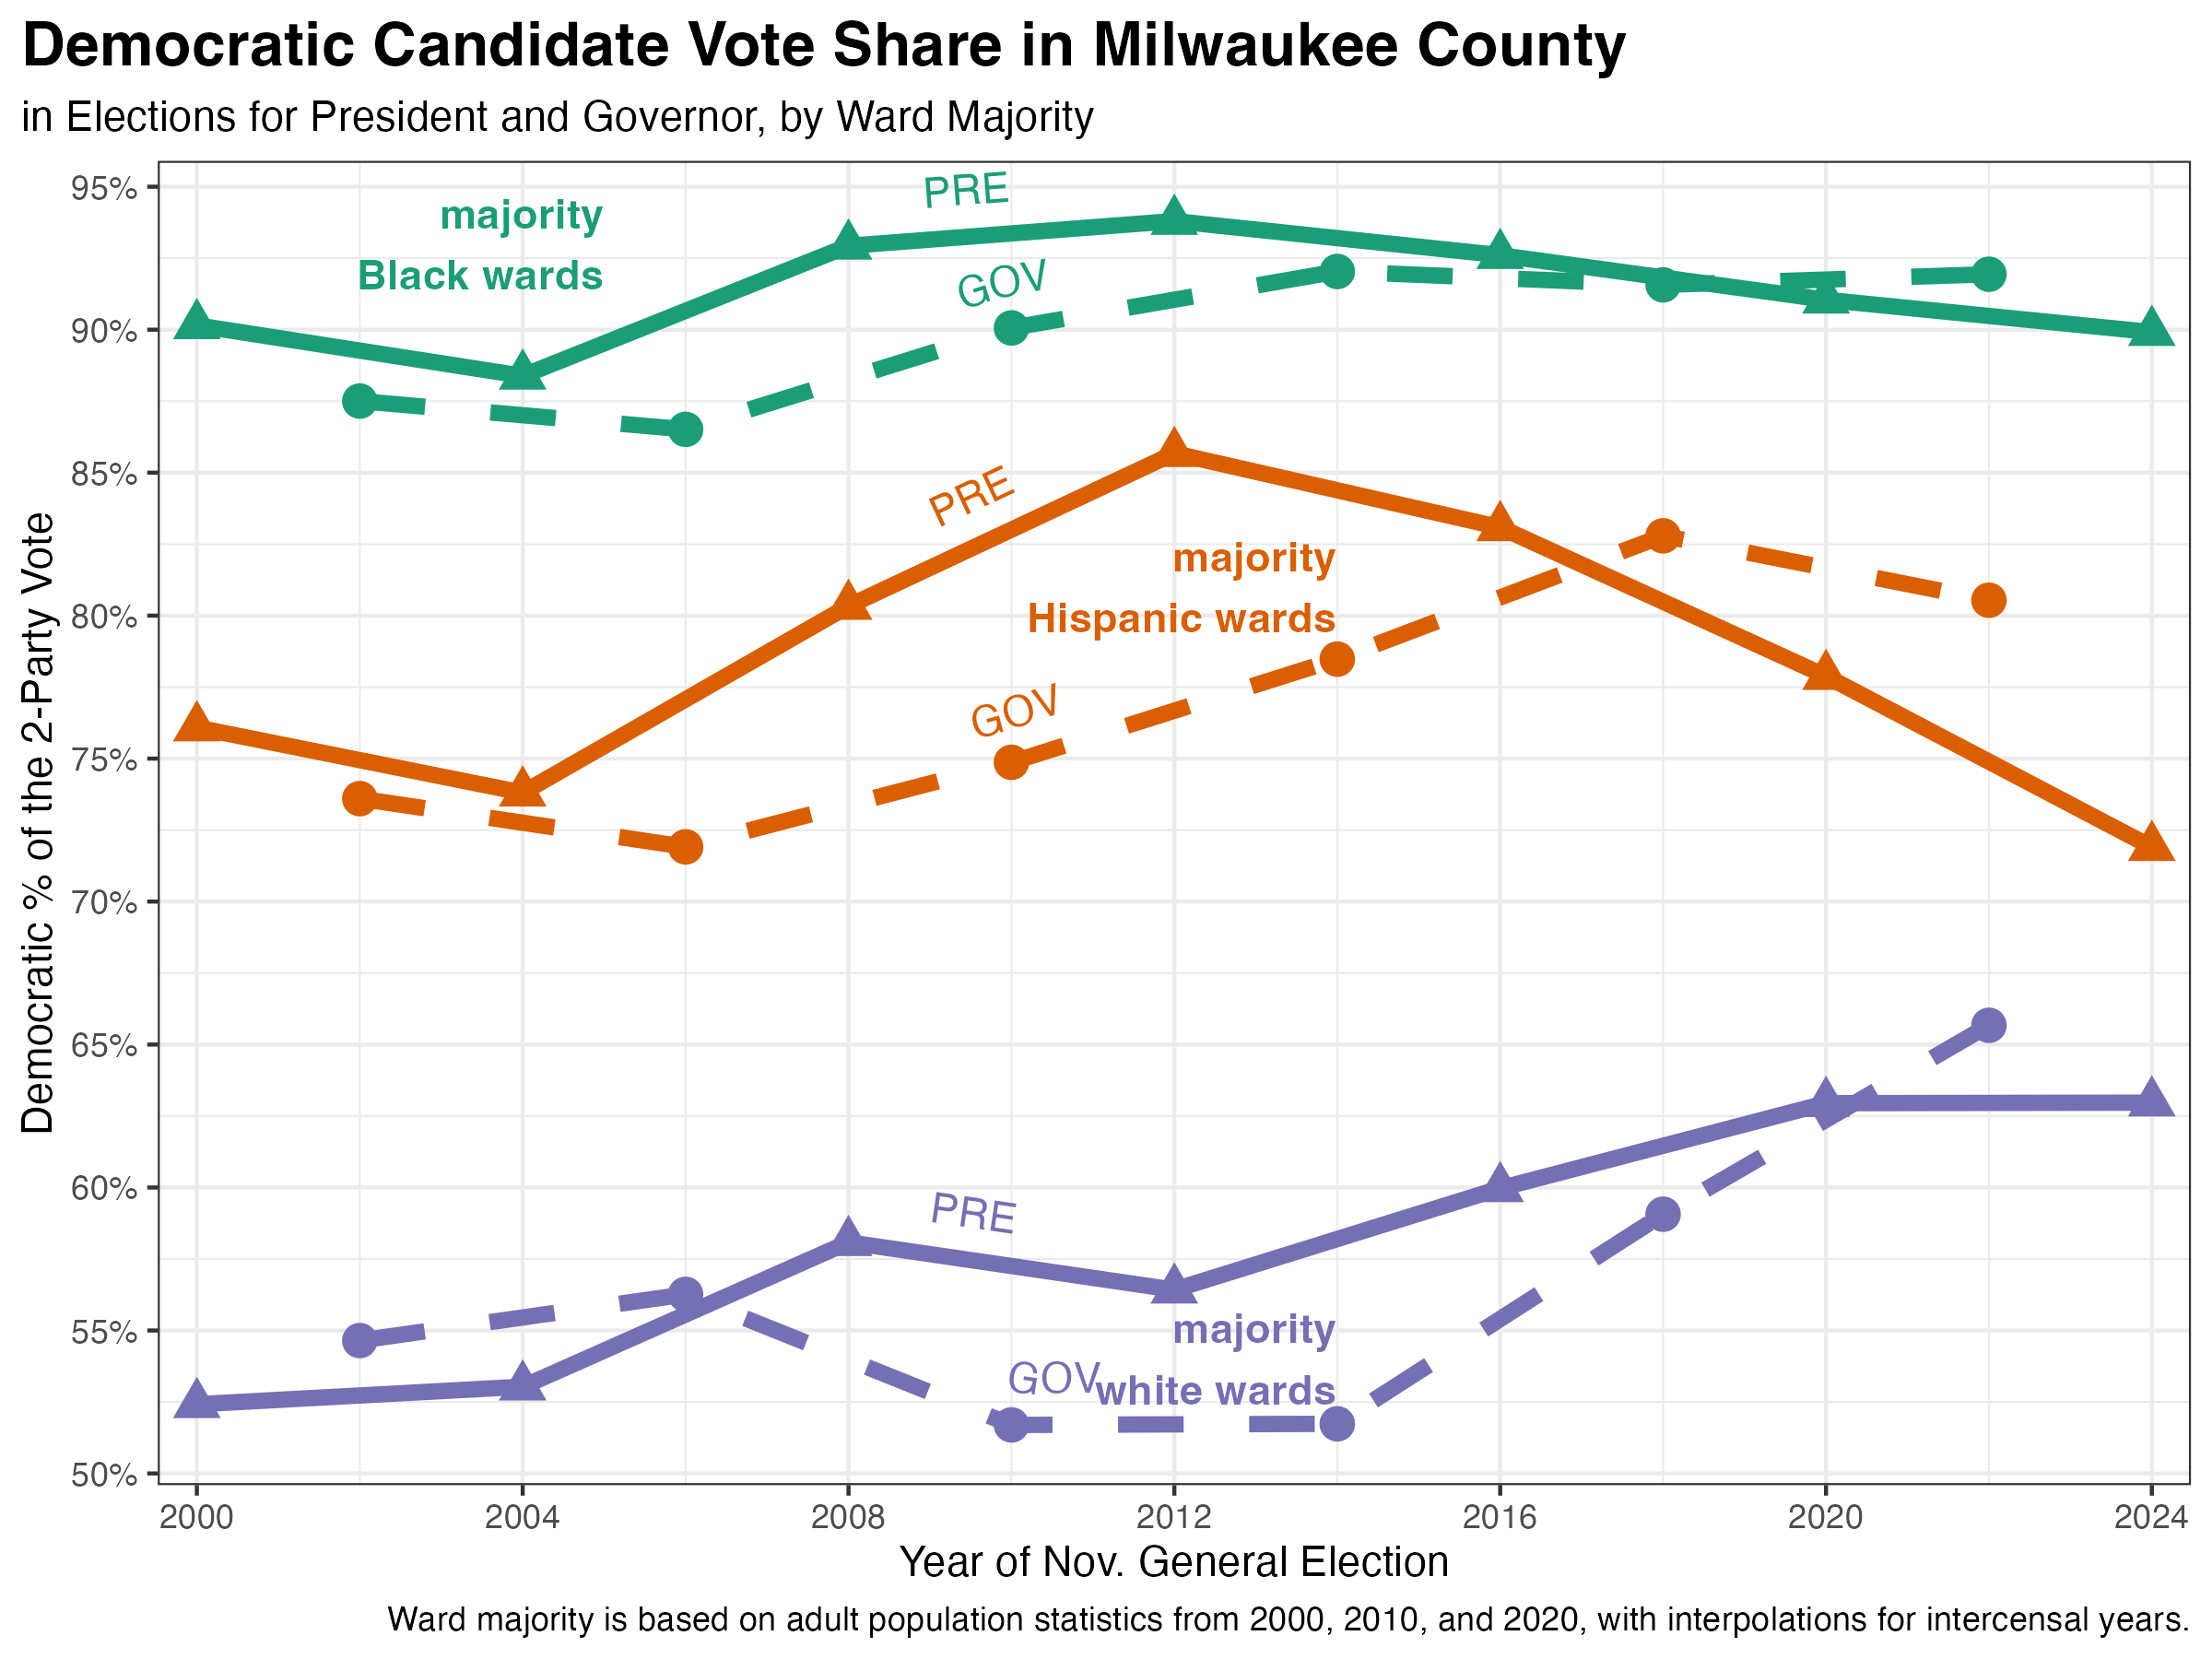
A simple approach is just to measure how the county’s majority Black, white, and Hispanic wards voted. I calculated each ward’s majority using census block redistricting data (and cubic spline interpolation for intercensal years).
Majority Black wards gave the Democratic presidential candidate 90% of the vote in 2000, 88% in 2004, 93% in 2008, 94% in 2012, 93% in 2016, 91% in 2020, and 90% in 2024.
Compare that slight decline with the pattern in majority Hispanic wards. They gave the Democratic candidate 76% in 2000, 74% in 2004, 80% in 2008, 86% in 2012, 83% in 2016, 78% in 2020, and 72% in 2024.
Majority white wards moved in the opposite direction, growing more Democratic with time. They gave the Democratic presidential nominee 52% in 2000, 53% in 2004, 58% in 2008, 56% in 2012, 60% in 2016, 63% in 2020, and 63% again in 2024.
The simple ward-majority approach reveals clear patterns, but it hides the size of some changes. For instance, many non-Hispanic white people live in majority Hispanic wards, so, if those white people grow more Democratic as Latinos grow more Republican, the ward-majority calculation will underestimate the rightward shift among Latino voters.
For a more rigorous approach, I ran a regression model predicting Democratic vote share in each ward with independent variables for each racial group’s share of the adult population along with interaction terms for each individual election. In the model, 2000 is the base year.
The model predicts that a hypothetical 100% non-Hispanic white ward would’ve given the 2000 Democratic presidential candidate Al Gore 44% of the vote. Every 1 percentage point increase in the Black share of the population correlates with a 0.5 point increase in Gore’s share of the vote. Every 1 point increase in the Hispanic share correlates with a 0.3 point increase for Gore.
Over time, Democrats improved with white voters in Milwaukee County. The model predicts that Obama would’ve won about 48% of the vote in a hypothetically entirely white in 2008. Biden would’ve won 52% in 2020 and Harris 56% in 2024.
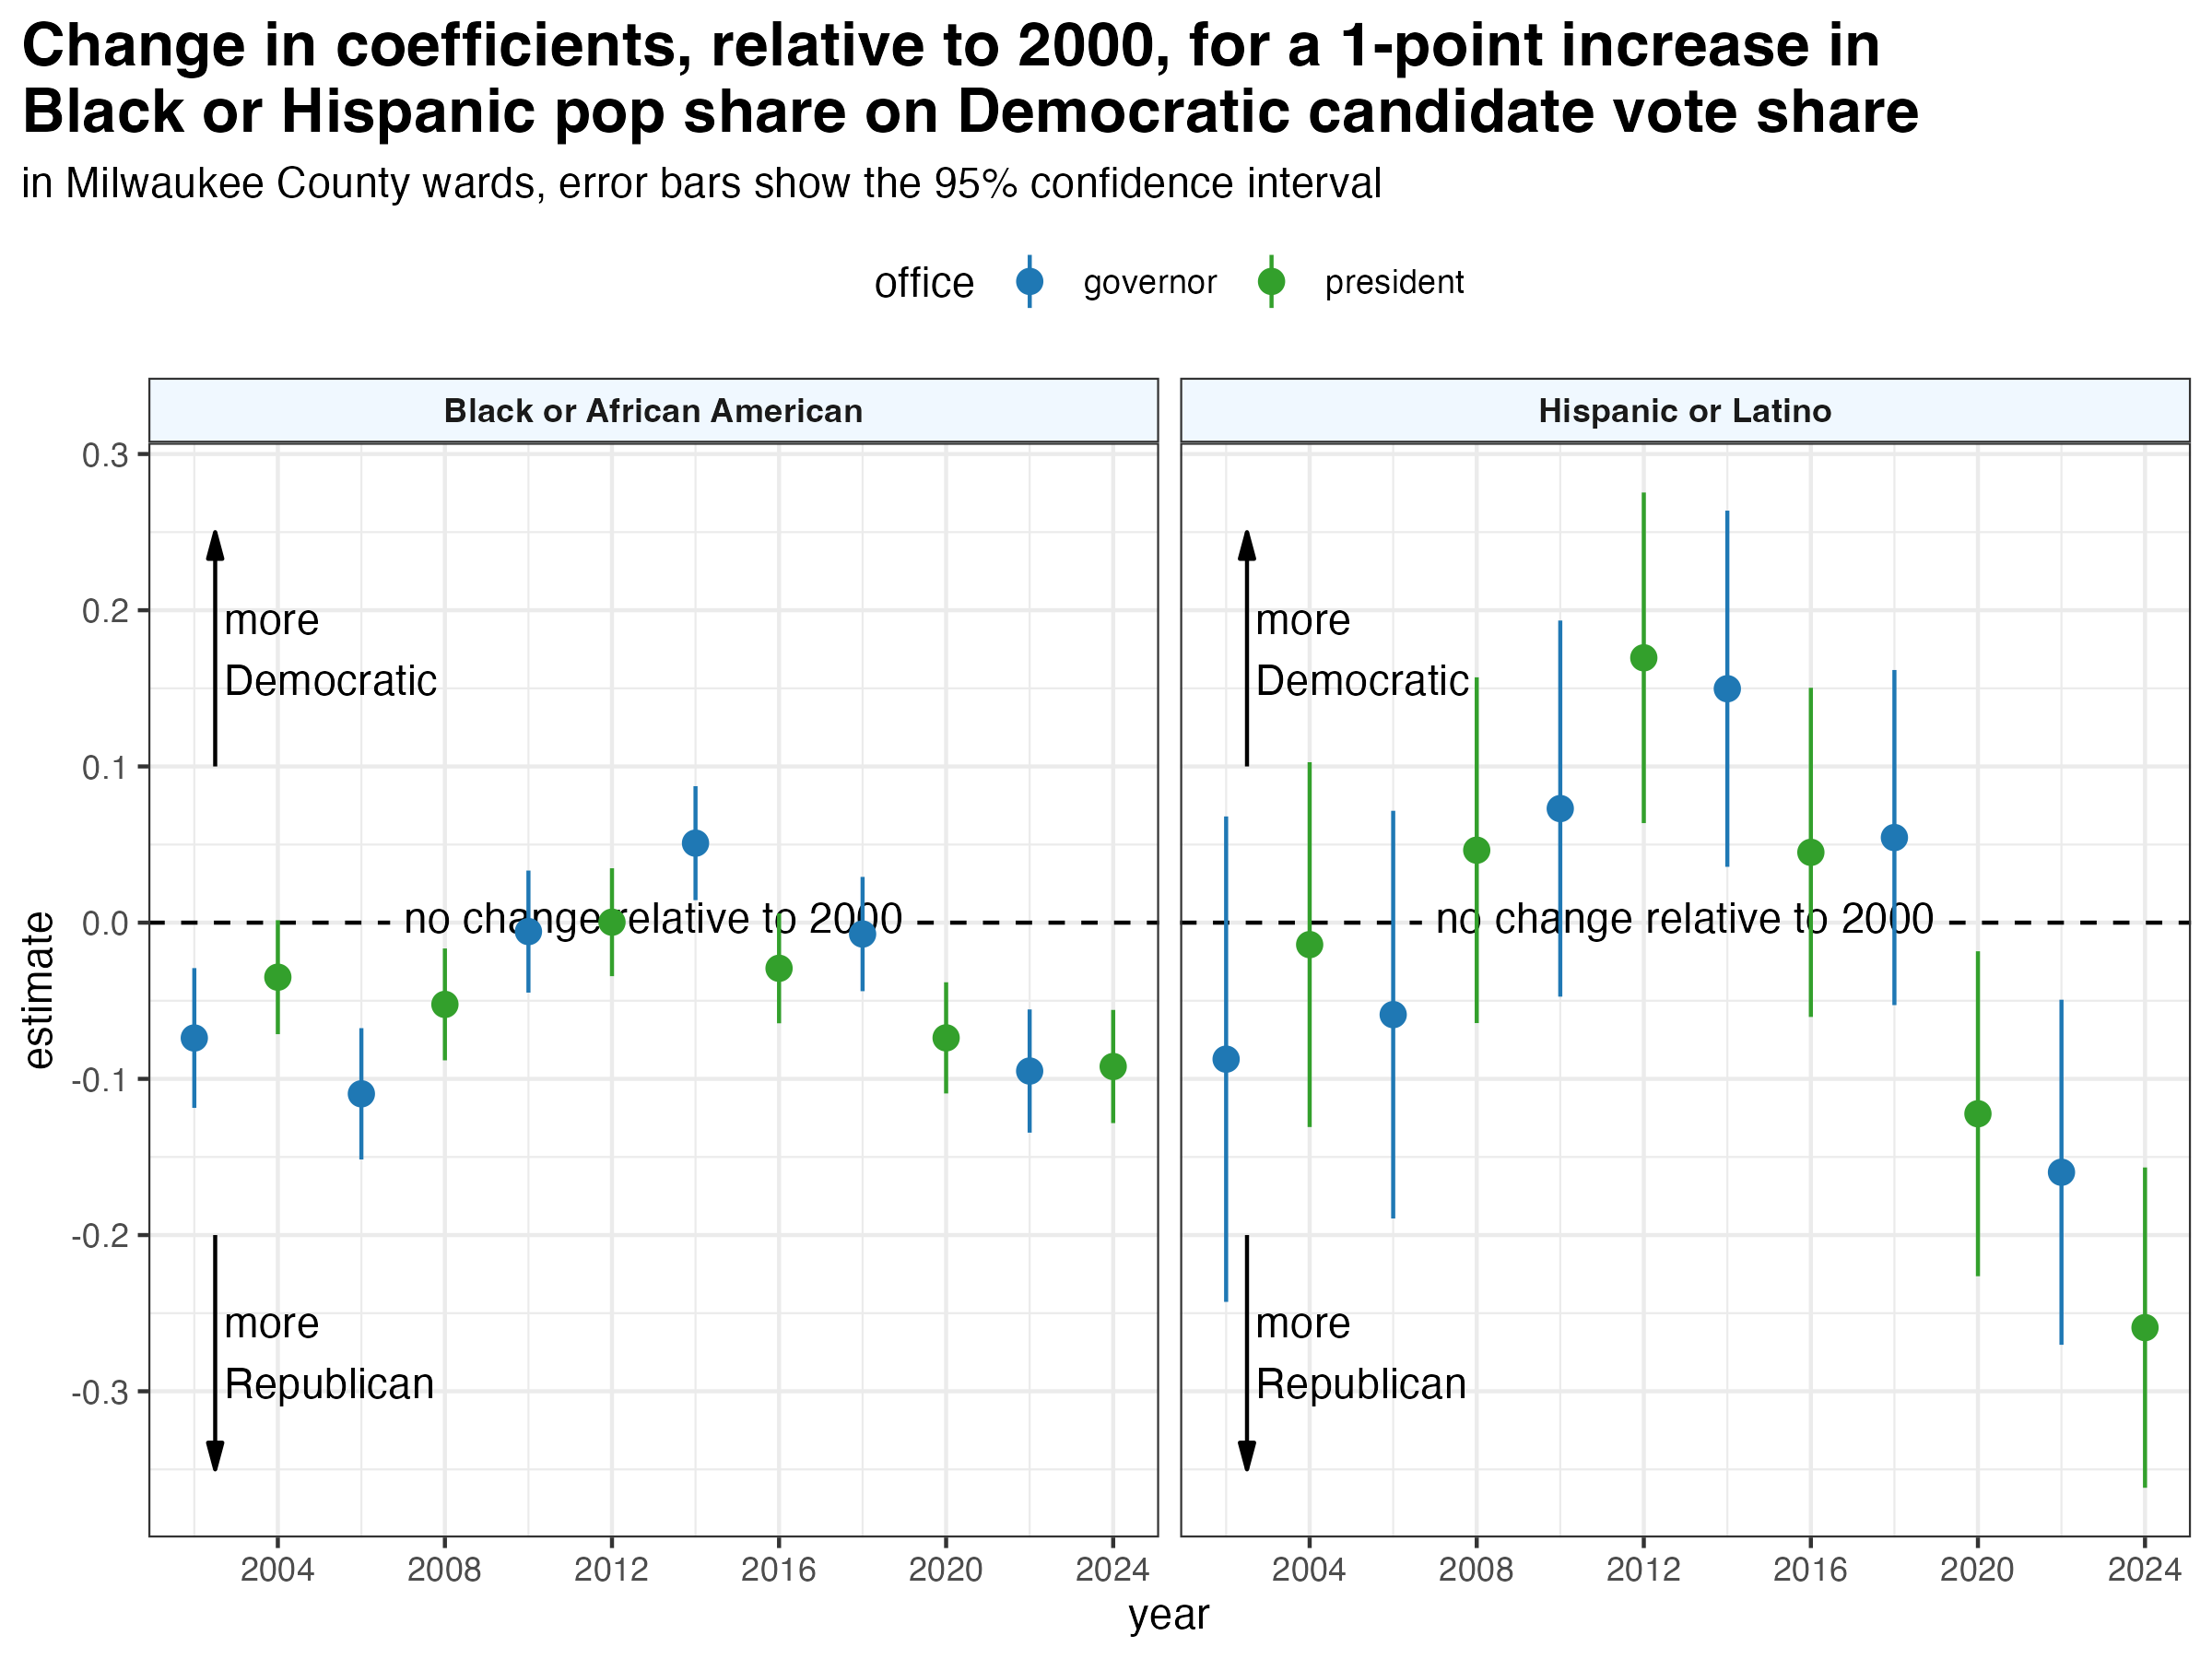
The graph below shows how the model’s coefficients changed for the Black and Hispanic population share in subsequent years, relative to 2000. Relative to 2012, we see a clear shift toward the Republicans among both groups, but the shift is about four times as large for Hispanic voters as Black voters. Each of Trump’s elections saw a large increase in support among Hispanic voters. Among Black voters, Trump’s improvement was much smaller overall and statistically insignificant between 2020 and 2024.
Here is what the election data for Milwaukee County shows us. Black voters are by far the mostly Democratic-leaning group, followed by Hispanic voters, then white voters. This order has remained the same over the past 25 years, while the gaps between these groups have lessened.
Milwaukee County’s white voters probably gave Bush a majority over both Gore and Kerry. Since then, white voters in the county have moved left, now giving Democratic candidates a comfortable majority.
At the same time, Hispanic voters first trended Democratic, giving Obama large victories, with his peak popularity coming in 2012. Trump made strong gains with Milwaukee’s Latino population in each campaign.
Black voters in Milwaukee County shifted only slightly toward Trump, giving him a bit more of the vote in 2016 than Romney received in 2012. Another small shift toward Trump followed in 2020, but from 2020 to 2024 no statistically significant shift is evident.
As I’ve written elsewhere, Wisconsin’s electorate varies from the national average in a few ways. No state has been as narrowly divided in three consecutive presidential elections as Wisconsin in Trump’s three campaigns. Turnout dropped nationally but increased here from 2020 to 2024. Although I lack data measuring this, I suspect that per capita campaign spending rivals any historical precedent as well. And throughout the Trump era, the rightward turn among Milwaukee’s Black voters has been muted compared to the national change observed by Pew and Catalist.