Wisconsin School Vaccination Rates: an interactive map
The Washington Post recently published an interactive article which shared kindergarten immunization data collected from public schools in 34 states. The data shows plunging vaccine rates across the country.
I was shocked by how low some of the numbers were, and I wanted to understand how they compared to school numbers as a whole. It’s possible than some kindergartners haven’t yet received all of the vaccination they will receive.
For example, Neeskara Elementary had an MMR vaccination rate of 12% and an overall compliance rate of 7%. Fortunately, the schoolwide numbers for Neeskara, according to WI DHS, are an MMR rate of 60% and an overall rate of 50%. Given that herd immunity against measles requires “about 95% of a population to be vaccinated,” Neeskara is still disturbingly low, but there is a world of difference between 7% and 60%. Most of the children attending Neeskara have received this vaccine–just not most kindergartners at the beginning of the year.
At MacDowell Montessori, kindergartners reported an MMR rate of 26% and an overall rate of 26%. The schoolwide numbers are 92% for MMR and 62% overall. Likewise, kindergartners at Hayes Bilingual School were at 33% for MMR and 27% overall. The schoolwide numbers are 76% MMR and 61% overall.
More details from WI DHS
Besides listing the MMR and overall vaccine compliance rates for each school, the WI DHS data also provides information about why students aren’t vaccine compliant. In most Milwaukee schools with low vaccination rates, the cause isn’t that parents have filled out vaccine waivers. According to the DHS statistics, it’s more common for students who are out-of-compliance to be classified as “in process,” “behind schedule,” or just “no record” rather than having explicitly opted-out of vaccinations by completing a waiver.
At Neeskara, for example, 20% are “behind schedule” and 28% have “no record.” Scarcely any students actually have a vaccine waiver on file. Similarly, Riverside High School has truly dismal 12% vaccine compliance rate. Eighty percent of its students are “behind schedule” and 7% are “no record.” Few, if any, have waived vaccine requirements.
Schools where many students have waived vaccines are uncommon, but they do exist. At Tamarack Waldorf, on Milwaukee’s East Side, 67% of students have met minimum vaccination requirements. Sixteen percent have “waived all vaccines” and 24% have completed a “personal conviction waiver.” The distinction between these classifications is unclear to me. So is the distinction between students who are listed as “in progress” vs. “behind schedule.”
In general, the quality of the school-level data provided by WI DHS raises as many questions as it answers. At North Division, for instance, 65% of students were classified as “met minimum requirements” in 2024, with just 5% having “no record.” The next year, in 2025, fewer than 5% “met minimum requirements” and 80% had “no record.” Absent some extraordinary turnover over students between those two years, I struggle to imagine how this could be possible. More likely: the data was reported incorrectly in one or both of the years.
Many schools also fail to submit their reports every year. In 2025, 377 schools statewide (13% of the total) failed to submit a report. But 197 of those schools had submitted a report the previous year, in 2024.
The current self-reported school vaccination data collected by WI DHS is incomplete and inconsistent where available. The failure to report this data accurately (or at all) poses real challenges to public health efforts. A health department might want to plan its vaccine outreach campaigns around those schools where children are unvaccinated, not because their parents have opted them out of immunizations, but simply because those children are apparently not receiving medical care. Better data would improve this kind of targeting.
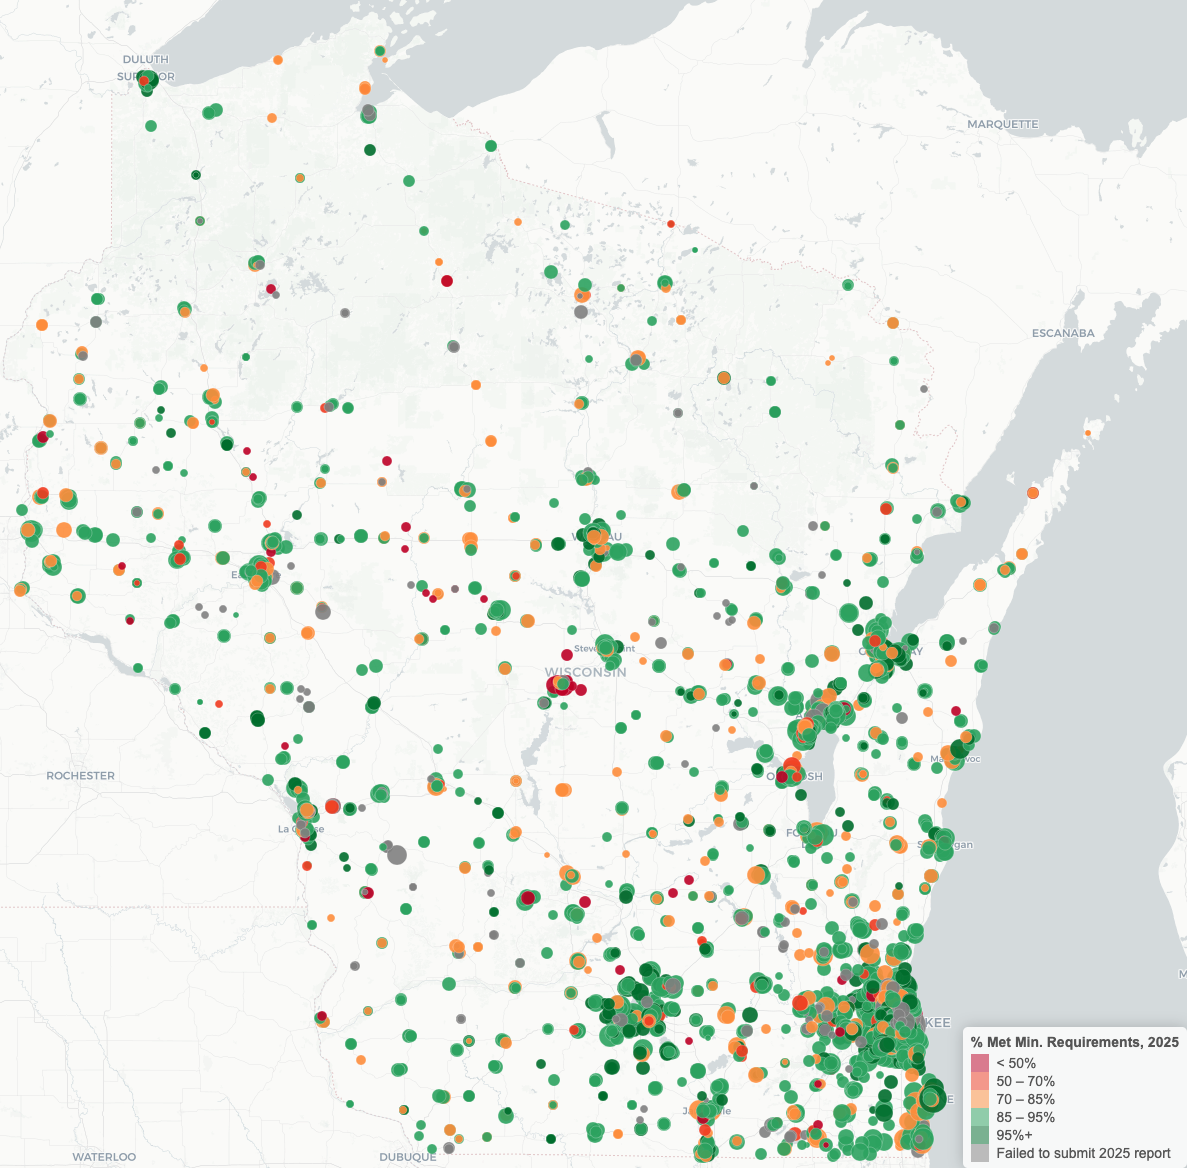
I’ve built an interactive map showing the available data for every school in the state. Click the image below to open it. Mousing over each school will reveal its name and 2025 overall vaccine compliance rate. Click the school to display a table showing more detailed vaccine statistics for each year from 2022 through 2025. If the school failed to submit a report in any of those years, all values for the year will be NA.
Updated 2/25 to correctly identify that the Washington Post story uses kindergarten vaccination rates, not schoolwide rates.