When the Wisconsin Supreme Court tossed the state’s legislative district maps in December 2023, they invited the legislature and governor to once more seek an agreement on state legislative maps. The Court also simultaneously solicited proposed remedial maps from the parties to the original court case—one of whom was Gov. Evers himself.
The Court ultimately accepted submissions from six parties, 4 liberal or Democratic and 2 conservative or Republican. Having had the chance to review all the proposals and fearing what the Court’s new liberal majority might do, Republican legislators suddenly found themselves in the unexpected position of supporting Evers’ own proposal. On February 13, both houses of the legislature passed Evers’ map submission, with near uniform Republican support and only one vote in each chamber from Democrats.
Republicans explained their sudden support for Evers map as simply picking the worst of several bad options. In Senator Van Wanggaard’s words, “Republicans were not stuck between a rock and hard place. It was a matter of choosing to be stabbed, shot, poisoned or led to the guillotine. We chose to be stabbed, so we can live to fight another day.”
As I write this, Gov. Evers has not yet signed these maps; although, he has indicated he likely will.
The differences between the partisan lean of Evers’ plan and the three other Democratic-aligned proposals are small but measurable. The Court’s consultants calculated separate partisan bias scores and mean-minus-median-gaps for each plan in their report. For each measure, Evers map is not the best (of the four) for Republicans in either house, but it does have the most favorable Republican score when averaged across both houses.
The consultants also calculate each plan’s “majoritarian concordance,” or the reliability with which it converts an electoral majority into a legislative majority. Considering both houses across 13 statewide races since 2016, the Evers map fails the majority concordance standard 6 times—all in instances where a losing GOP candidate would’ve still won a majority of legislative seats.[1] No other plan fairs quite so well for Republicans.
Another benefit to Republicans is a small reduction in paired incumbents, relative to the other Democratic-aligned plans. The governor’s plan places 25 Republican Assembly incumbents into a district with another incumbent, compared to between 27 and 31 in the other plans. In the Senate, the Evers plan pairs 1 more Republican incumbent than the Senate Democrat’s proposed map, but fewer than either the Law Forward or Wright proposals.[2]
These partisan differences between the Democratic-aligned plans appear, if anything, smaller in the 2022 elections, when the Evers map would’ve performed very similarly to the Law Forward plan. The graphic below compares the partisan lean of the tipping point seat in each house under three different election scenarios.
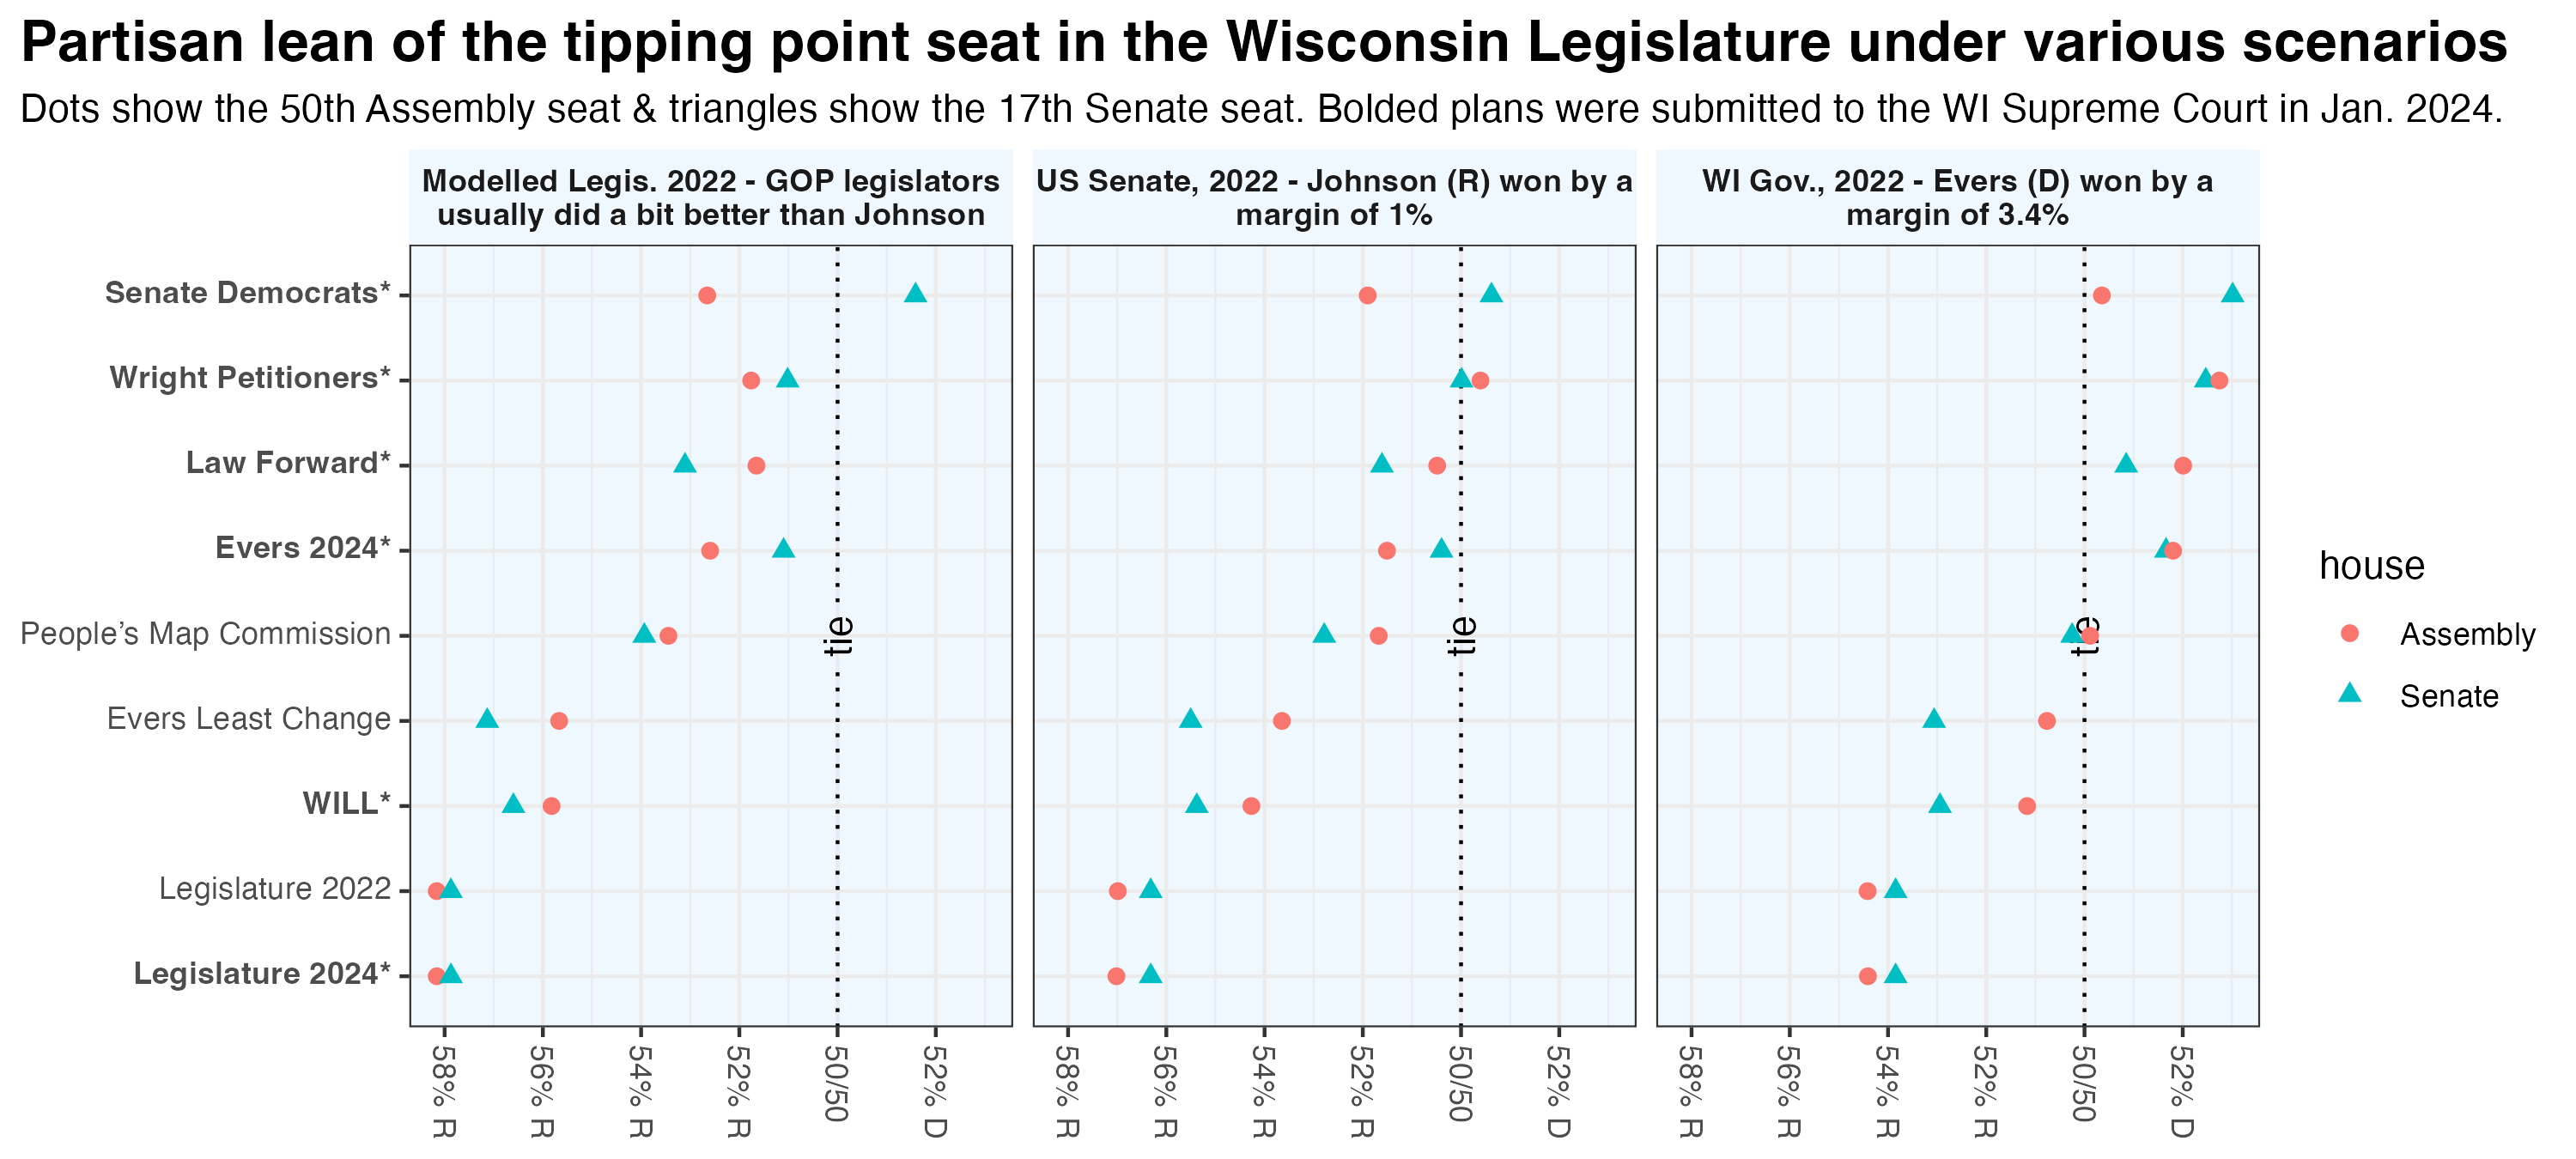
The rightmost graph shows the share of the vote won by Tony Evers in his reelection campaign. Evers won the state by 3.4 percentage points, enough to give him a majority of the seats in both houses under all four of the Democratic-aligned proposals. (Note: These statistics cover all 33 state senate districts).
The middle graph shows the share of the vote won by Ron Johnson in his reelection campaign. Johnson won the state by one percentage point. That narrow victory would’ve won a majority of the seats in both houses under the Evers and Law Forward plans. Johnson still would’ve narrowly lost both houses under the plan submitted by the Wright Petitioners. Under the Senate Democrats map, Johnson would’ve won a majority of seats in the Assembly and lost a majority in the state senate.
Of course, state legislative races are decided by their own candidates—not top of the ticket races. We can’t simply add up state legislative votes in new districts, because many of the old races were not contested by both parties. Instead, I employ a statistical model using top-of-the-ticket races to estimate state legislative results, had both parties run candidates. The results of that model are shown in the leftmost graph. In general, state legislative Republicans did about 1 point better than Ron Johnson.
Indeed, under my modeled estimate of 2022 state legislative races, Republicans would’ve likely held a majority in every house of every plan, except for the state senate in the Senate Democrats proposal. (Again, this considers all 33 seats, not just the 17 odd-numbered districts being elected in 2022).
The 2022 result is not a prediction of 2024. The larger presidential electorate, heightened attention, greater fundraising, and variable incumbency effects may change the contours of those legislative races in consequential ways.
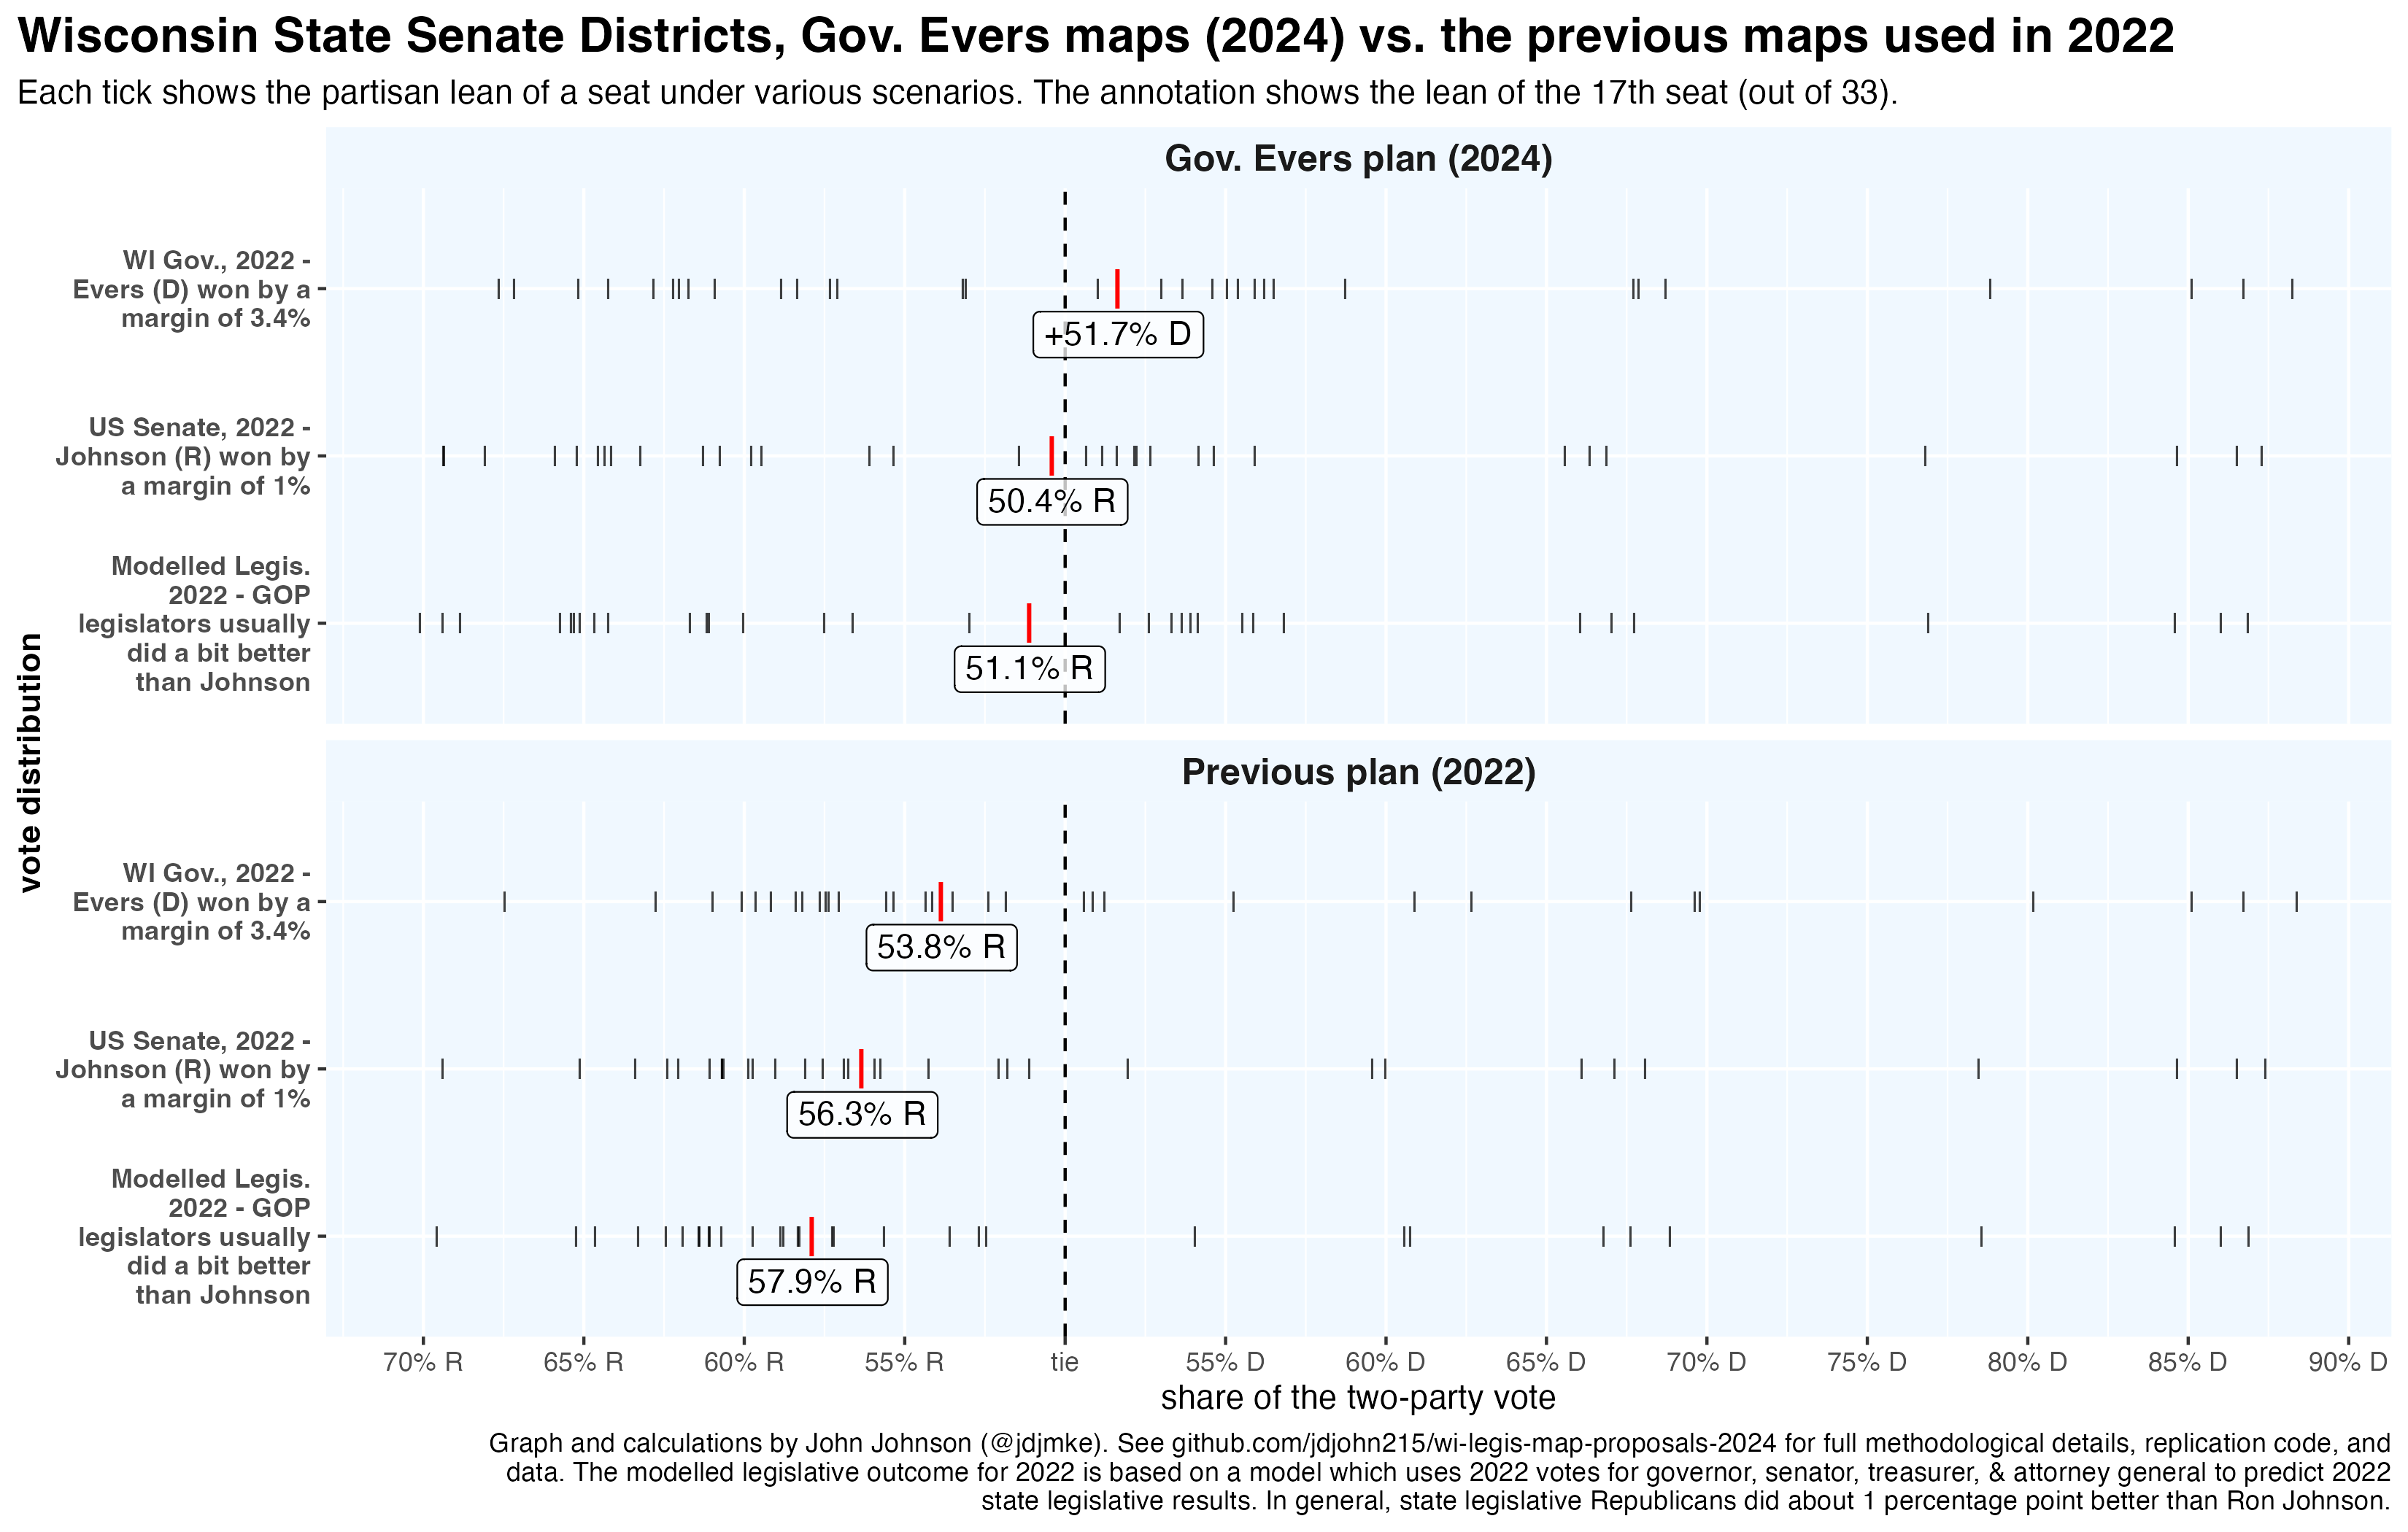
Still, these three election scenarios give a reasonable sense of the range of outcomes in recent Wisconsin elections. With that in mind, here are graphs showing the lean of each legislative seat under the Evers proposal compared with the previous map.
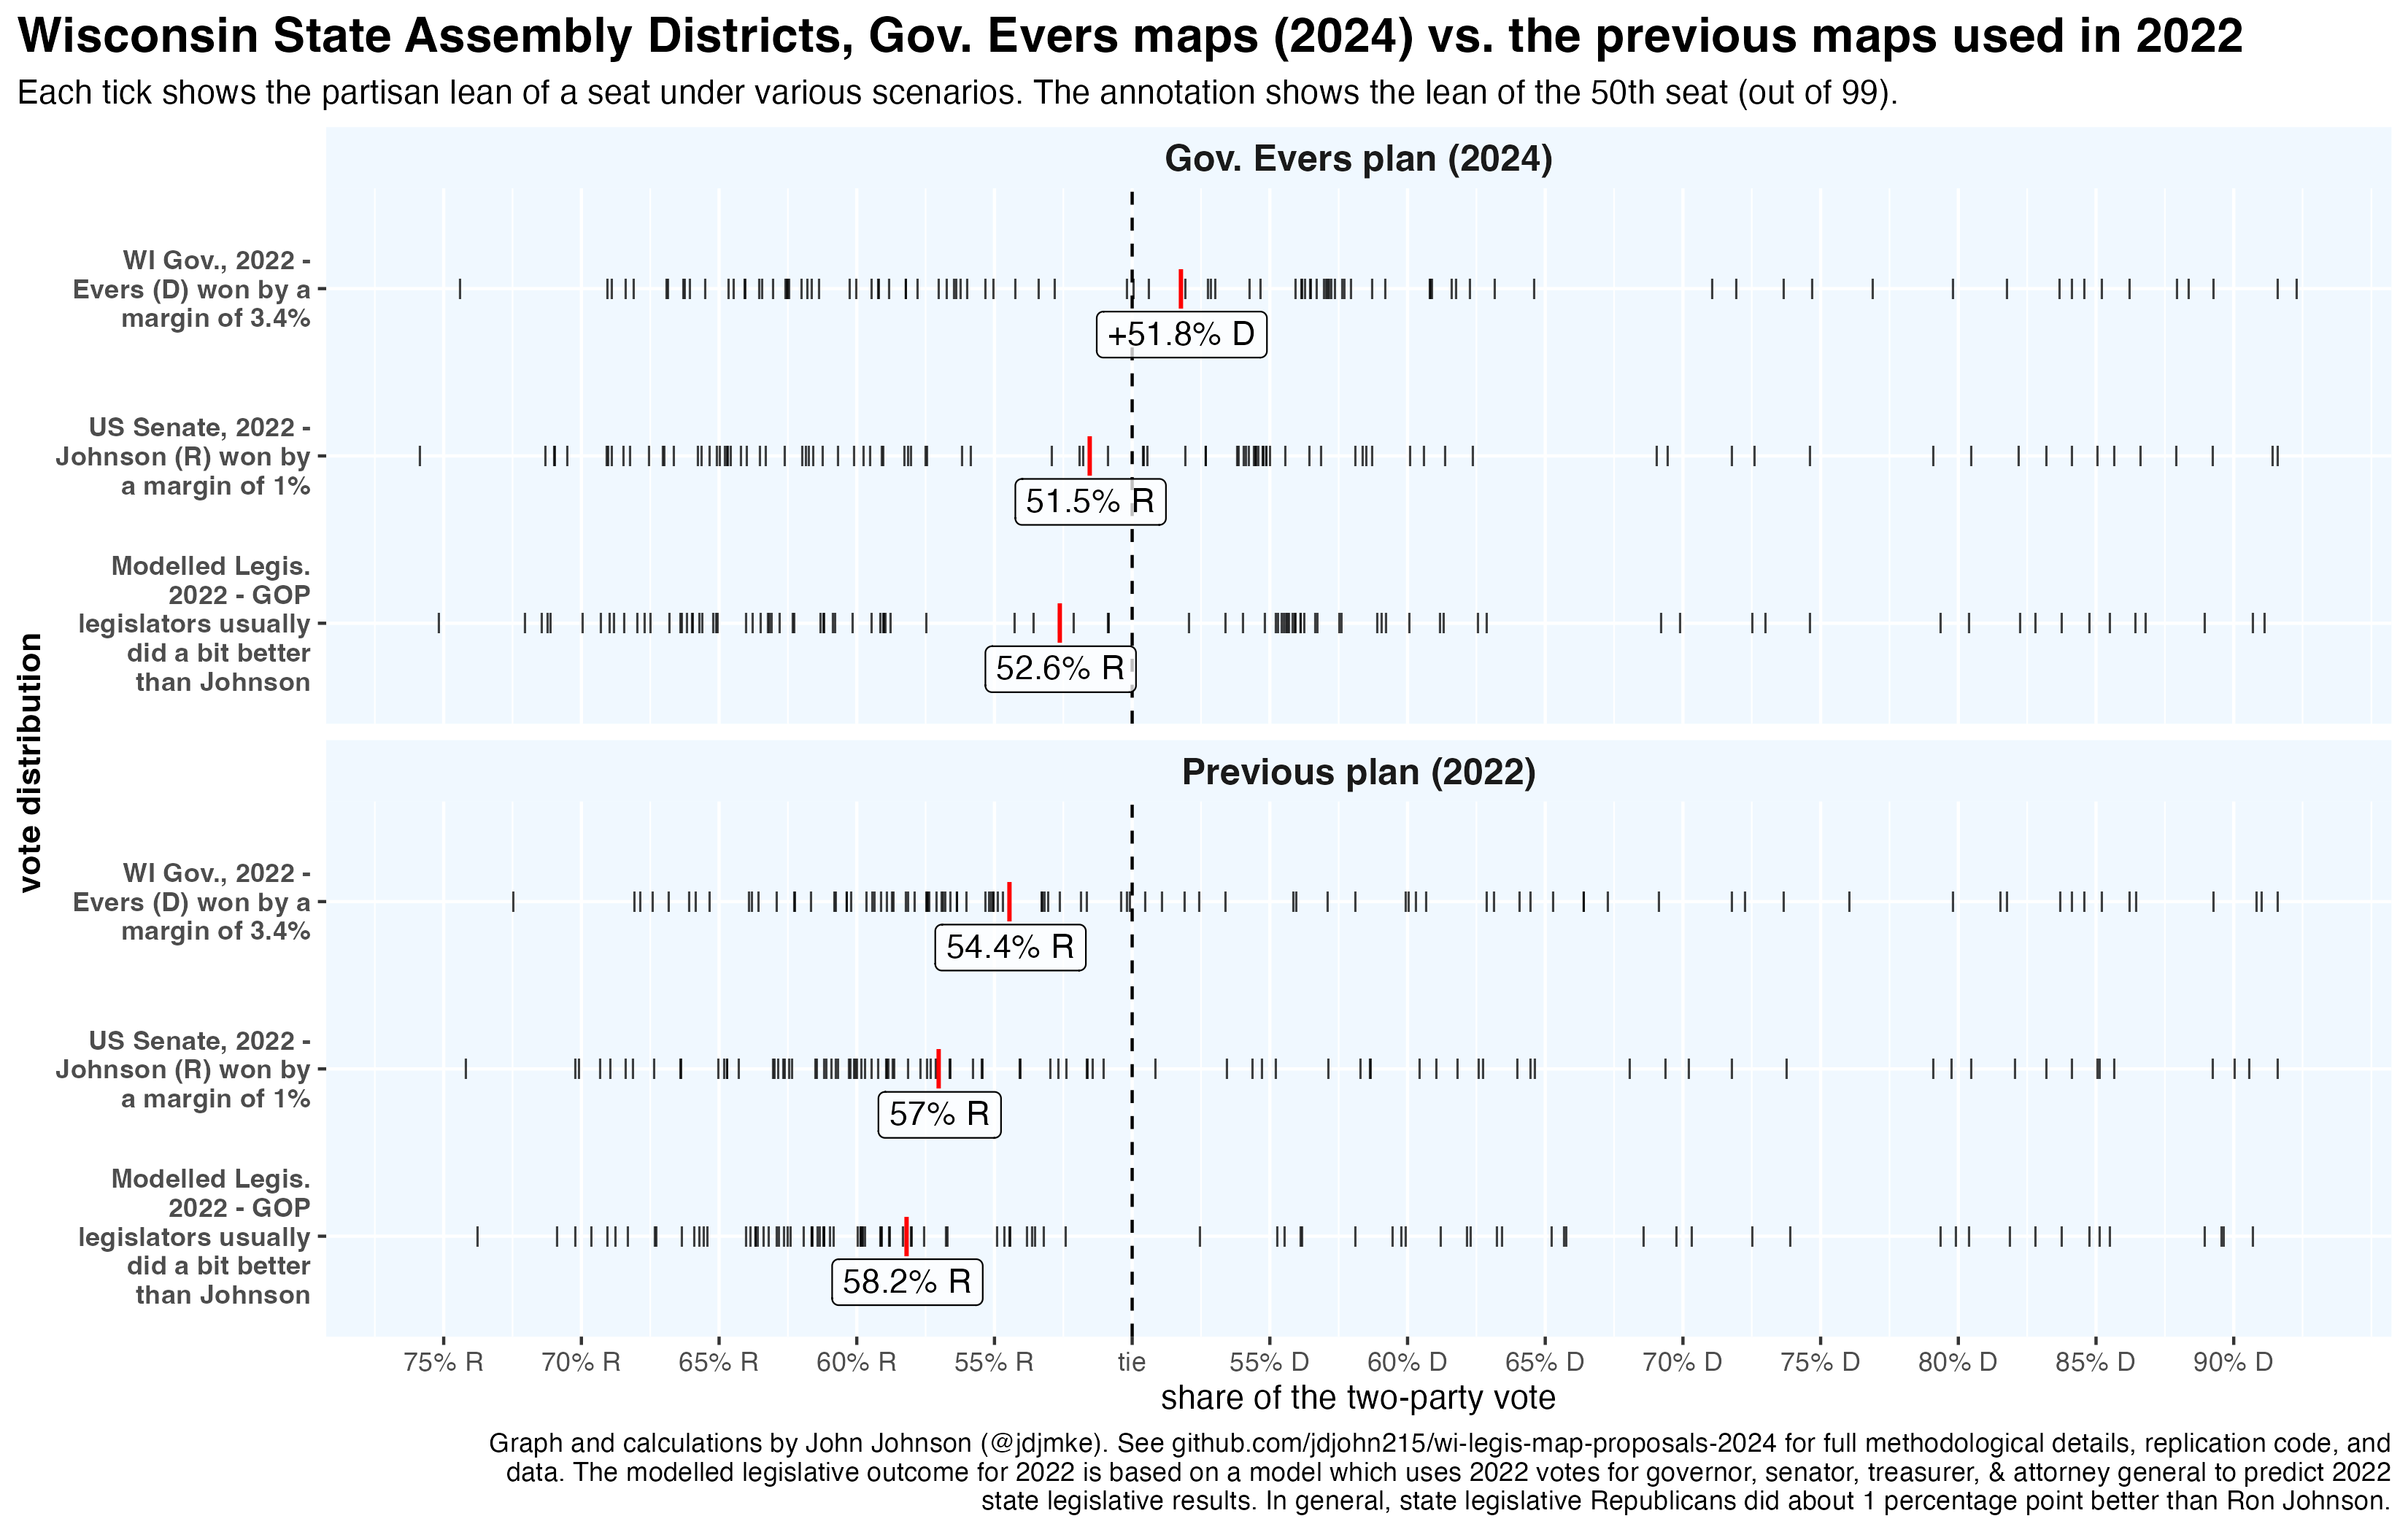
In these graphs, each tick mark shows the partisan lean of one seat. The larger, red tick mark shows the tipping point seat—the one that determines majority control. This is another way of visualizing the statistics I discussed above. In both houses, the tipping point seat was won by both Gov. Evers and Senator Ron Johnson in their 2022 reelection campaigns. State legislative Republicans did slightly better than Johnson, but even in that scenario, the tipping point seat is far more competitive than in any scenario under the old maps.
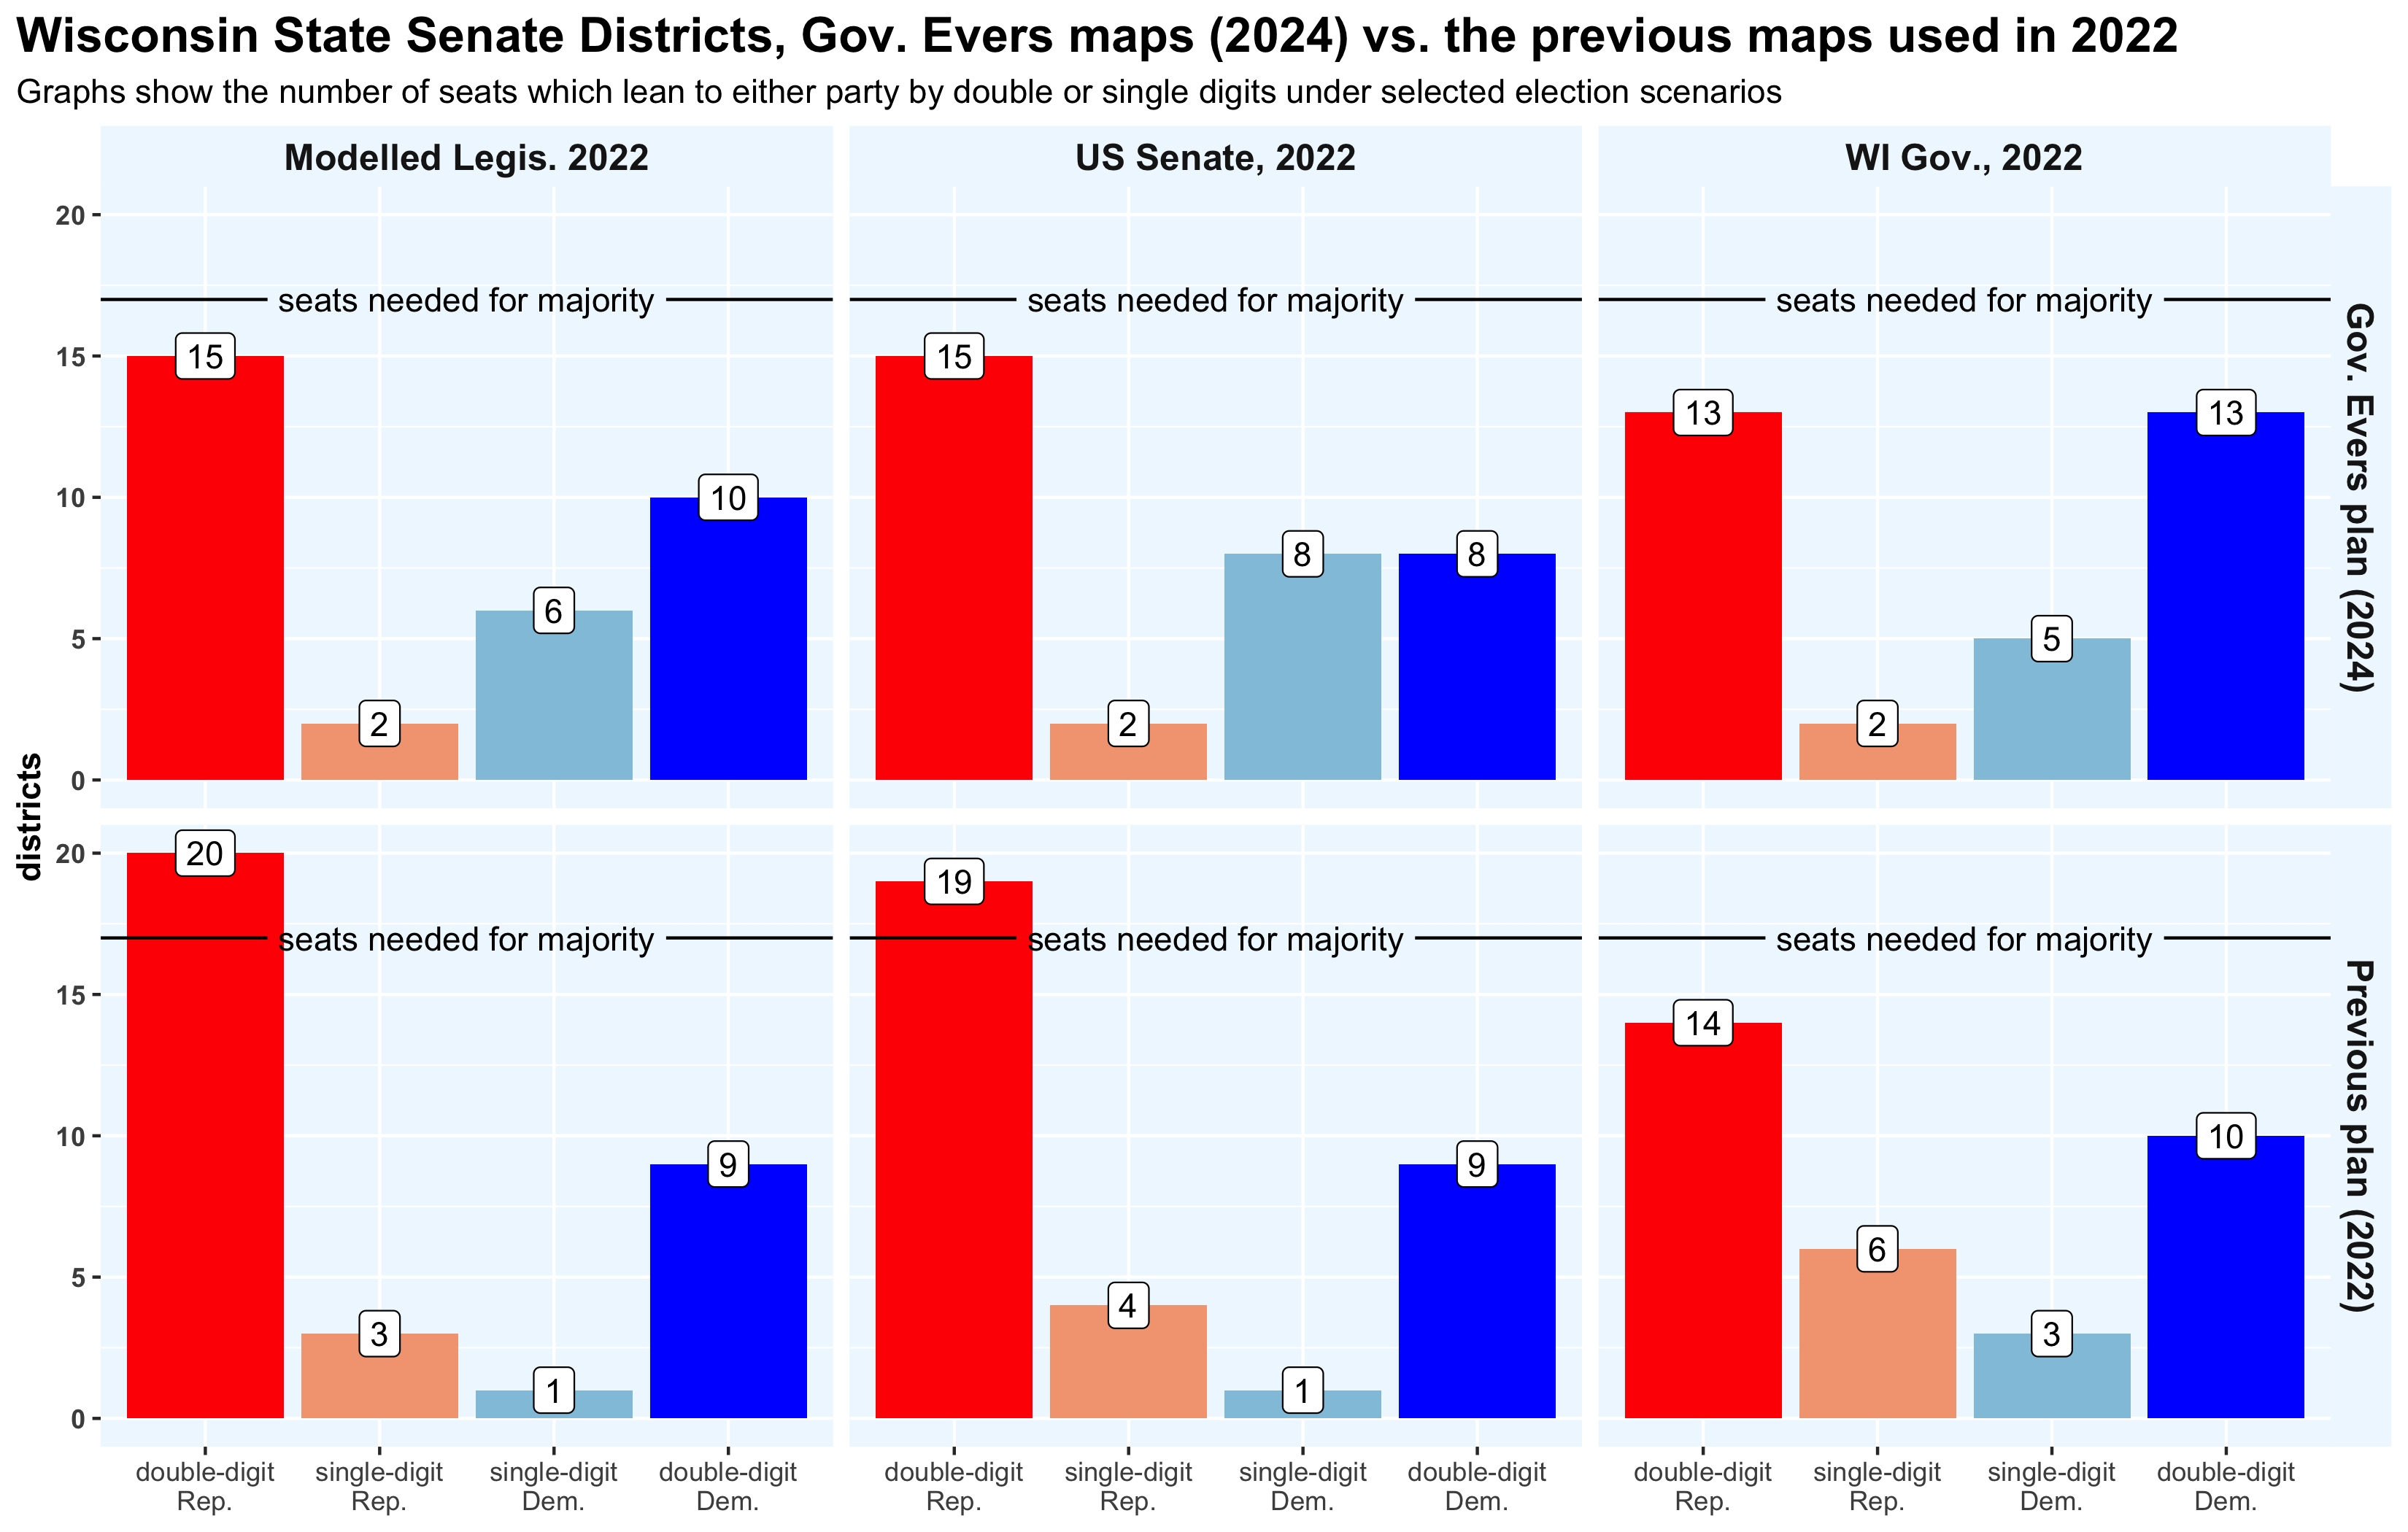
Here is a greatly simplified version of the above graph. In these graphs, I have simply counted the number of seats leaning to each party by double and single digit margins, under each scenario. The first row shows the Evers map, the second row shows the previous maps.
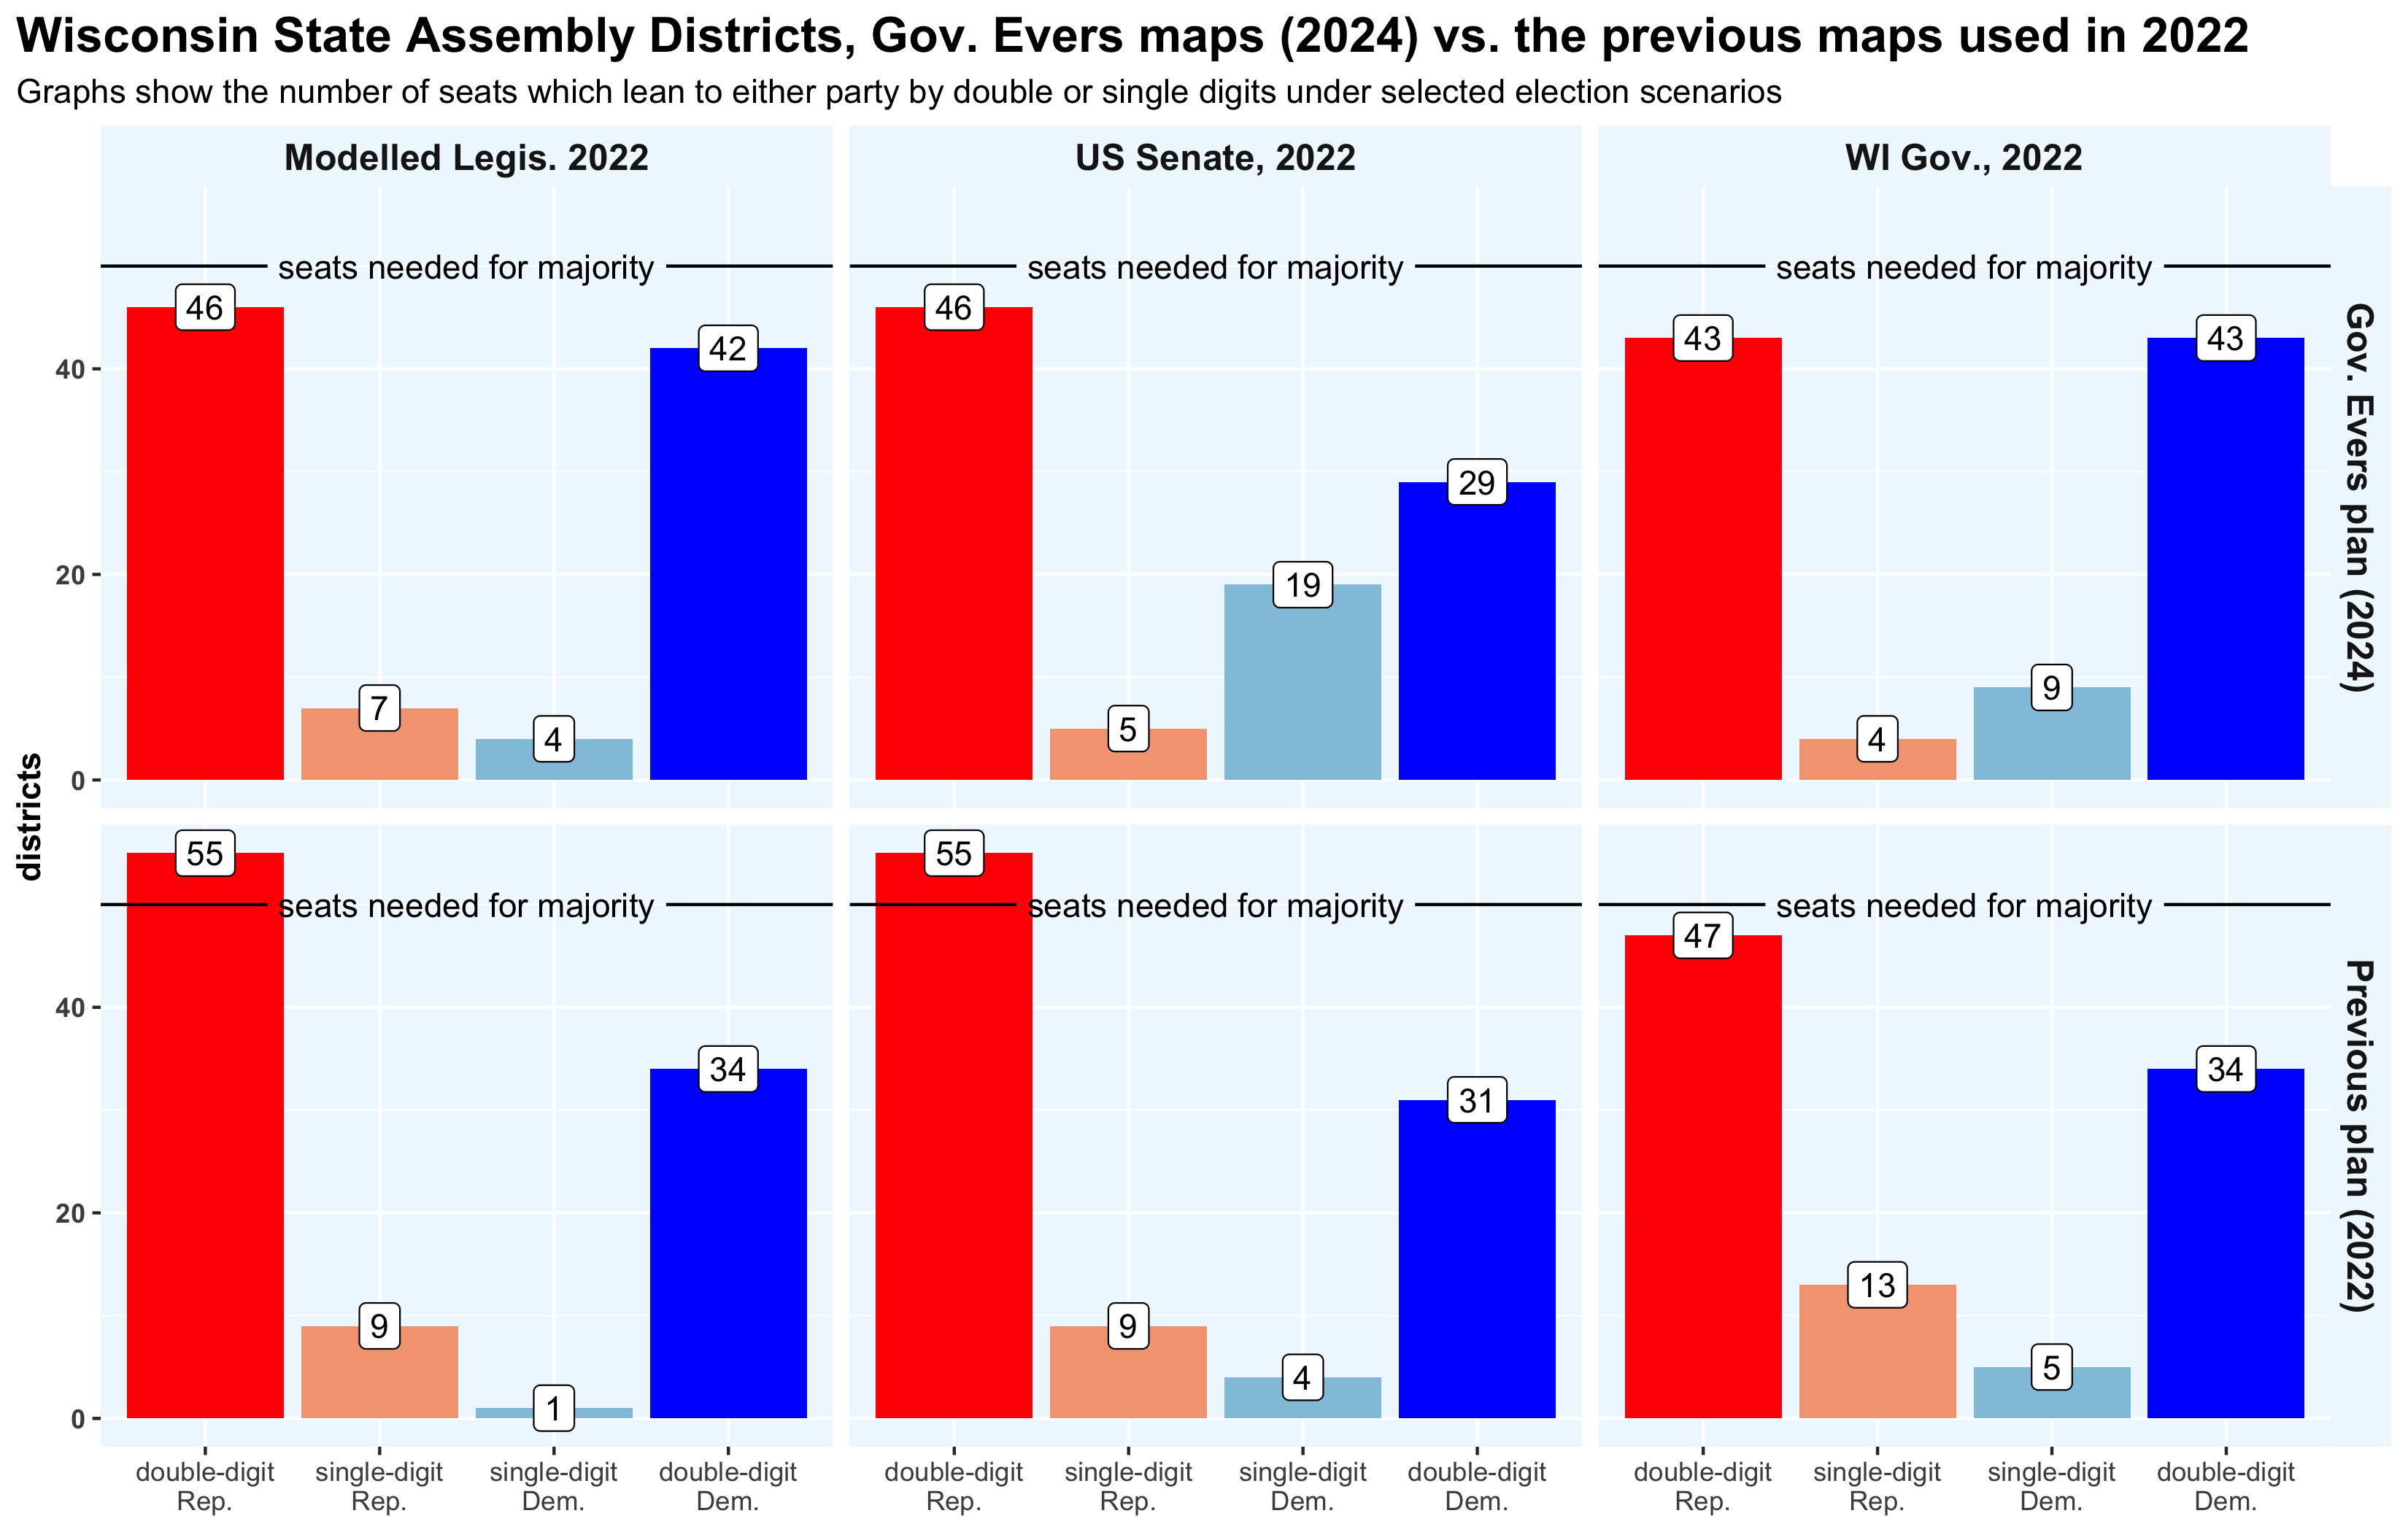
Under the old maps, Ron Johnson won a double-digit victory in 55/99 Assembly districts and 19/33 Senate districts. That falls to 46 and 15, respectively, under the Evers proposal—short of a majority.
Under all three scenarios and in both houses, the Evers map creates a situation where majority control will be decided by a set of more competitive districts.
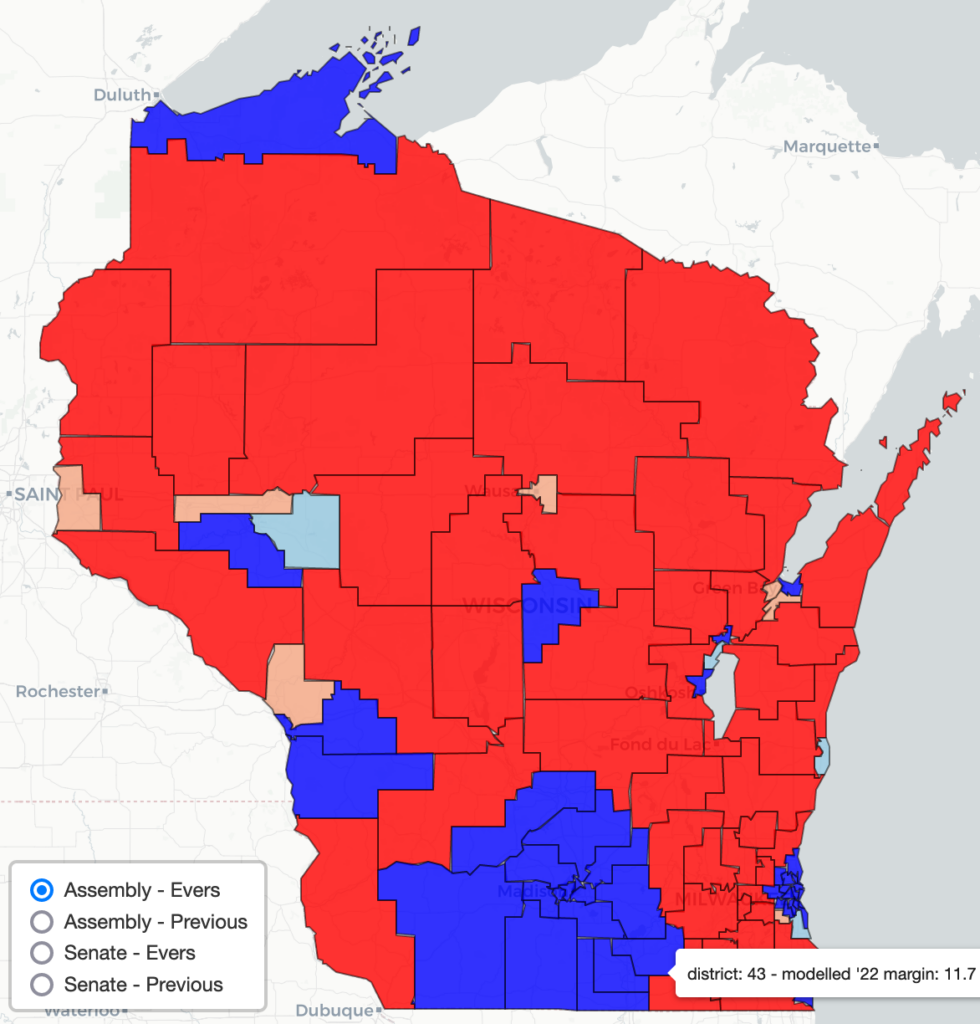
Click the image below to open an interactive map where you can view the Evers map and the previous district boundaries, with the districts shaded by my modeled 2022 legislative margin. For simplicity’s sake, the rest of this discussion will reference only that election scenario.
The Evers map creates 42 Assembly districts with a double-digit Democratic lean and 4 districts with a single-digit lean. Here are where those changes take place.
- The south central region now includes 16 D-leaning seats, up from 12 previously. None of these are particularly competitive.
- Racine/Kenosha now include 4 D-leaning seats, up from 3.
- The Milwaukee metro includes 14 double-digit D-leaning seats, up from 13. The area retains 1 district with a single-digit Democratic lean.
- The City of Sheboygan is unified, becoming a district with a single-digit Democratic lean.
- Oshkosh/Neenah/Appleton are drawn to include 3 D-leaning seats, rather than 2.
- The Eau Claire area is drawn to include 2 D-leaning seats, rather than 1.
- Northwestern Wisconsin is redrawn to include one D-leaning seat, stretching along the coast from Superior to Ashland.
- The La Crosse area is drawn to include 2 D-leaning seats, rather than 1.
To win a majority in November 2024 under the Evers map, Democrats could win all of the seats which lean toward them, plus four of the 7 districts with a single-digit Republican lean. The most likely targets include districts 61 (SW Milwaukee suburbs), 88 and 89 (both in the Green Bay area), and either 85 (Wausau) or 30 (Hudson).
Similarly, to win a majority in the state senate, Democrats would need to win the 10 seats with a double-digit Democratic lean, all 6 seats with a single digit lean in their favor, and one of the two seats with a single-digit Republican lean. Both of those seats are in the Milwaukee suburbs. District 21 stretches from Racine, through Oak Creek and Franklin, up to the southwestern part of the city. District 8 includes much of Milwaukee County’s north shore, as well as southern Ozaukee County.
Because only even-numbered districts will hold election in 2024, I see essentially no chance of Democrats winning a majority this November. However, Democrats have three likely pickup opportunities in 2024 with the Evers senate map—districts 14 (NW of Madison), 18 (Fox Valley), and 30 (Green Bay). Any one of these pickups would end the GOP supermajority in the upper chamber. Winning all of them will put the senate majority very much in play during the 2026 cycle.
[1] These races are Secretary of State 2022 and President 2020 among Assembly seats as well as AG 2018 and Governor 2018 among both Senate and Assembly seats.
[2] Incumbent pairing statistics are from page 13 of the Legislature’s response brief.
![Read more about the article What’s going on with Milwaukee’s population [update]](https://law.marquette.edu/facultyblog/wp-content/uploads/2019/09/download-300x250.png)
Surprised that you didn’t include the map that Evers independent non partisan commission came up with. I still believe that the non partisan commission is the long term way to go so I would have liked to see that map versus these four gerrymandered maps
Steve, I do include the “People’s Map Commission” in this tipping point analysis (by that name), and also in this earlier post.
Which odd-numbered Senate districts have incumbents who now live outside the district? If I understand correctly, state law (Wis. Stat. § 17.03(4)(b)) requires that those districts hold elections.
Hi Sam. Unfortunately, the parties sealed their file with the most current addresses for each incumbent. From what I (and our law librarians can find) the most recent discussion of how Wis. Stat. § 17.03(4)(b) pertains to this situation took place in the 1980s. Two Attorney General opinions concluded that the candidate “vacates his office when he moves away from his district, but he does not vacate his office when the district moves away from him.” That line is from the 1987 opinion 76 Atty. Gen. 10, which discusses county supervisor districts, but the principle is the same. A 1982 opinion, 71 Op. Att’y Gen. 157, addresses state senators specifically. “One or more senators in odd numbered districts do not reside within the boundaries of the new district bearing the number similar to that of the district from which such senators were elected. No vacancy would result by reason of sec. 17.03(4), Stats., since the senator remains an inhabitant of the ‘district from which he or she is elected.’ However, such a person would have to move into the new boundaries and qualify as an elector to be elected to represent the newly created district. Wis. Const, art. IV, § 6.”