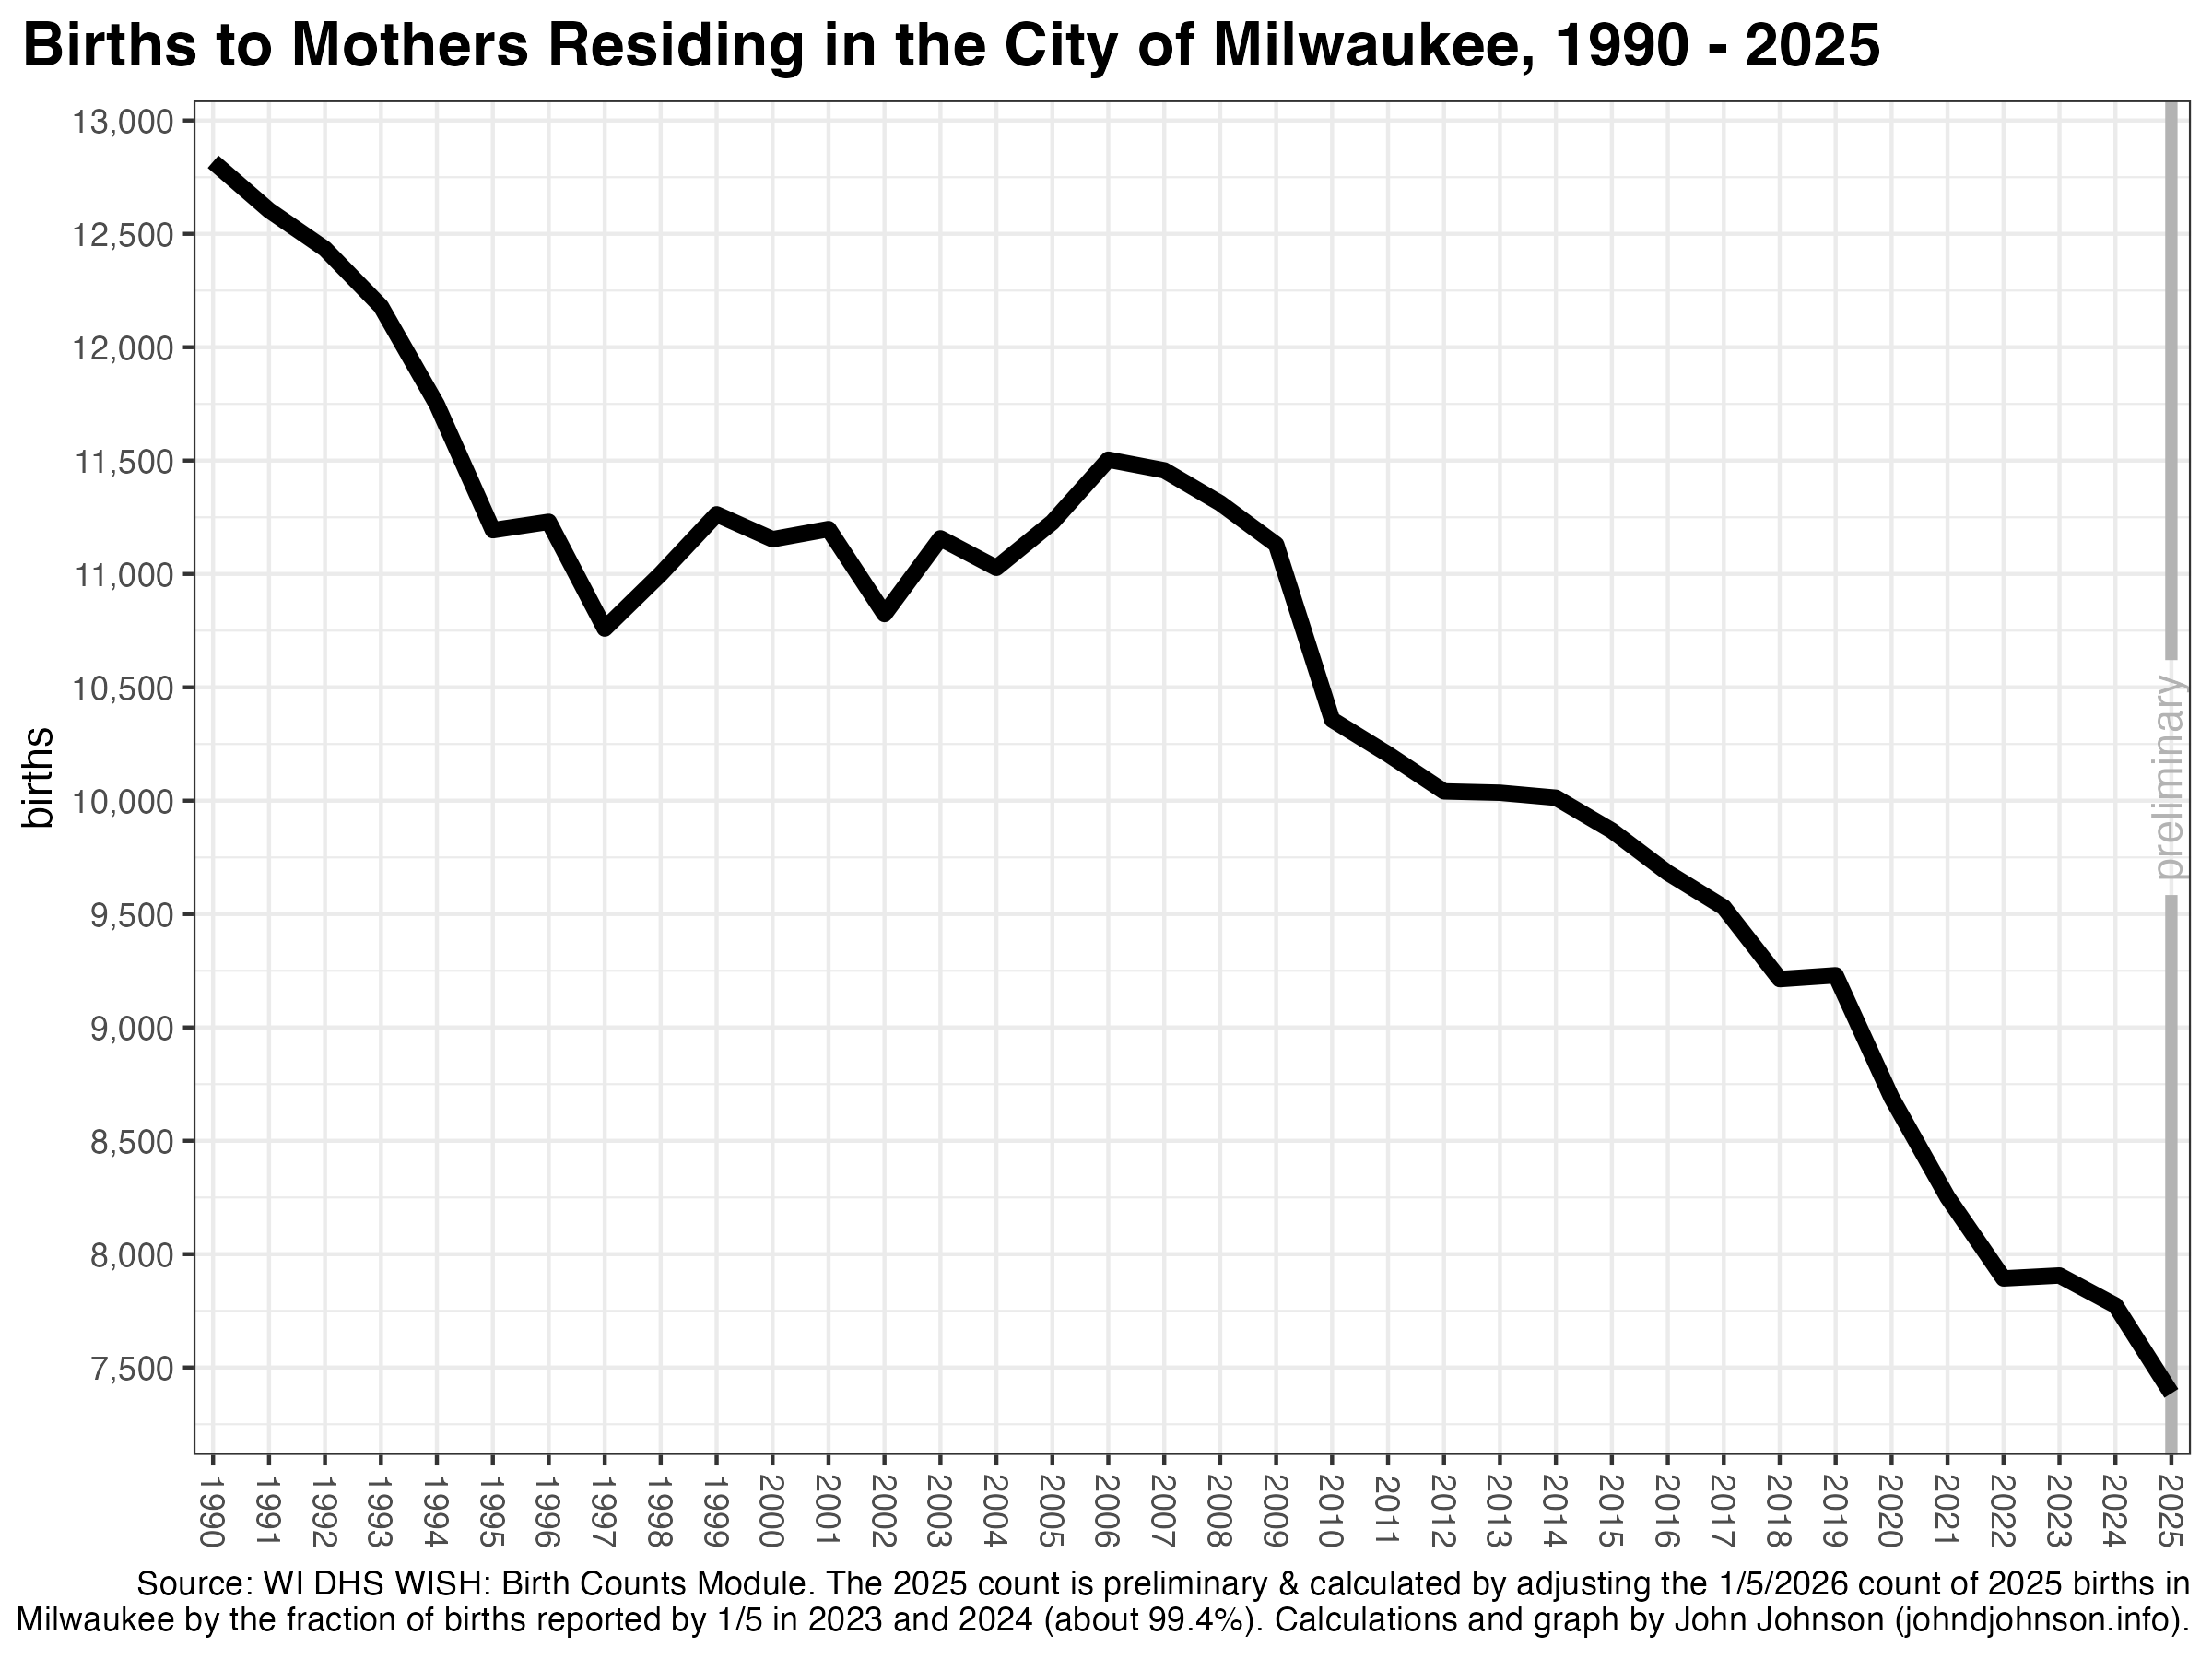
The fewest babies on record were born to Milwaukee mothers in 2025, according to preliminary vital statistics records.
As of January 5th, the state’s vital statistics database shows 7,343 Milwaukee births in 2025. Based on the reporting pattern in previous years, I estimate that the total number of 2025 births will stand at about 7,386 after the last records trickle in.[i]
This is a 5.0% decline from 2024, when 7,774 babies were born to Milwaukee moms. It is a 15.0% decline since 2020 and a 28.7% decline since 2010.
Births are only one component of population puzzle. Each year, people of all ages move both in and out of Milwaukee. But the number of births is the first ingredient of our future population, and the number of babies born has ripple effects in every following year. For example, in a response (at least partly) to declining demand, one large Milwaukee hospital stopped delivering babies altogether in 2022.
The drop in births throughout the 2010s also explains why Milwaukee’s population loss in the 2020 census was so surprising. The 2020 census came in well below what projections based on administrative data predicted. Those projections used birth and death records collected at the county level, and they estimated the county’s overall population accurately. The problem was that the Census Bureau model allocated births to each municipality based on patterns from the 2010 census, when, in fact, the share of babies born in the suburbs grew, relative to the city: a fact independently confirmed by both the 2020 census and local vital statistics.[ii]
Birth counts quickly affect school enrollments. Milwaukee’s births actually remained steady—even growing a bit—between the late 1990s and the late 2000s. This had a stabilizing effect on school enrollments, benefiting each sector of the city’s fragmented school system. There were actually more first graders attending a Milwaukee school in the 2014-15 school year than in 2005-06.
Then enrollment began to fall. The Great Recession, accompanied by an extreme mortgage foreclosure crisis in Milwaukee, coincided with a sharp drop in births. Newborn counts fell from 11,457 in 2007 to 9,213 in 2018. By 2023-24, there were 1,500 fewer first graders attending a Milwaukee school than in 2014-15.
During the COVID-19 pandemic, births dropped by 14.5% from 2019 to 2022. This was nearly three times the statewide decline of 5.1% over this period, so the drop in Milwaukee likely reflects prospective parents leaving the city in addition to couples putting off having a kid. Supporting this, census data shows a net outflow of 15,800 people leaving Milwaukee in the year ending July 1, 2021. Things improved after that, and net migration actually turned slightly positive in the year ending July 1, 2024, when the city gained about 500 residents in this way.
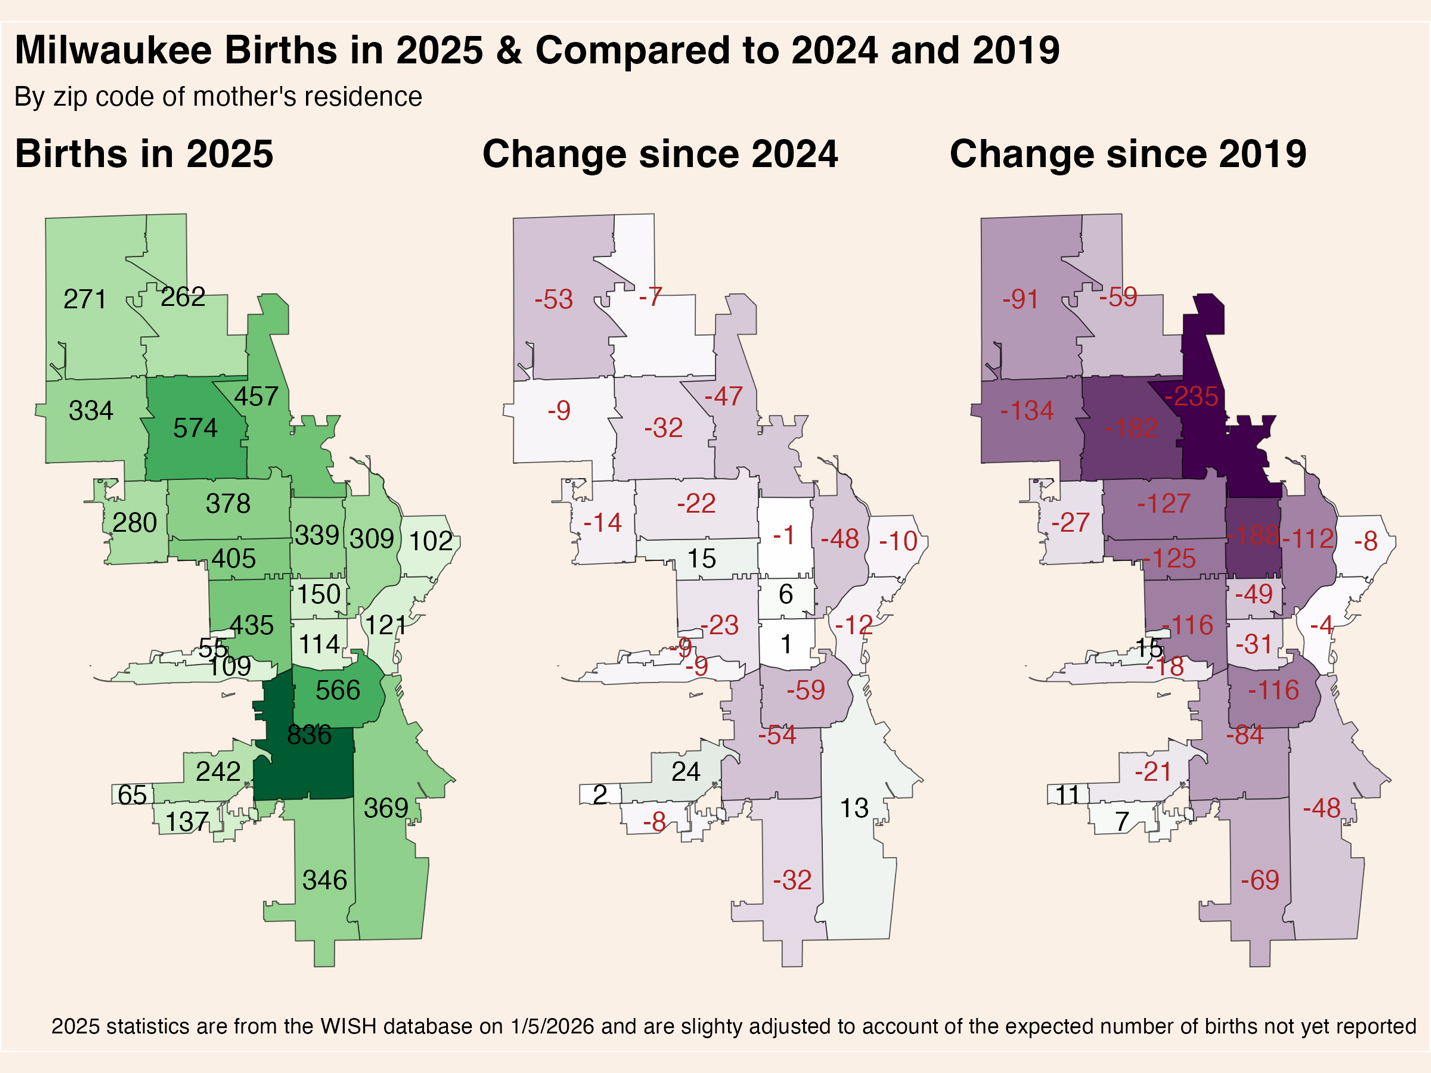
Mirroring this net migration pattern, births fell most sharply in the calendar years 2020 and 2021, before remaining more stable in 2023 and 2024. The renewed sharp drop in 2025 may indicate a resumption of negative net migration for the city or changes to the age profile and childbearing preferences of existing residents. Some hints might be gleaned from the map of where births have fallen in Milwaukee.
These three maps show, from left to right, the total number of babies born in each City of Milwaukee zip code during 2025, the change from 2024 to 2025, and the change from 2019 to 2025.
The cumulative effect of Milwaukee’s years-long run of declining births is large. As we begin 2026, 39,210 babies were born in Milwaukee over the past 5 years. At the beginning of 2020, that number was 46,345. Here are some final thoughts:
There is no sign that Milwaukee’s baby bust has bottomed out. Two years ago, I thought it might have, but the latest data points toward continued declines of several hundred babies each year.
Schools across all sectors will face declining enrollment for the foreseeable future, with each cohort likely being smaller than the last.
While it is true that fertility rates are declining nearly everywhere, I think the rapidity (and location) of Milwaukee’s baby bust points to out-migration of prospective parents as a large factor. Much of this could be solved if more young couples felt Milwaukee was a good place to raise a family. In general, in Milwaukee’s healthiest and safest neighborhoods, the baby bust is either small or not happening at all.
[i] In the last couple years, a little over half of one percent of birth records were still outstanding by the following January 5th.
[ii] The Census Bureau Population Estimates Program uses vital statistics and modeled migration data to estimate county-level population. It then allocated the county-level population into municipalities based on the number of housing units in each (another tracked metric) and the average household size in the previous decennial census. In Milwaukee, the city’s average household size actually fell from 2.5 in 2010 to 2.39 in 2020, while in the Milwaukee County suburbs, the average household size stayed about the same.
How likely am I to be called for jury duty? If called, how likely am I to actually be seated for a trial? Do jurors represent a true cross-section of the population? I have wondered about all these questions, and, recently, I came across a report from Milwaukee County Circuit Court making it possible to answer them.
I’ll cut to the chase. If you live in Milwaukee County, your annual odds of receiving a summons for jury duty are either 0 or 1-in-4, depending on your situation. But, assuming you are eligible to be a juror, your odds of actually becoming one are roughly 1-in-100. And while the pool from which jurors are summoned closely matches the demographics of Milwaukee County as a whole, the people who actually show up for jury duty are not so representative.
Odds of Jury Service, from Initial Summons to Sworn Juror
To calculate the odds of receiving a juror summons, we must first subtract the number of people who completed jury duty in the past four years because, in Milwaukee, those people are exempt from service. Last year, the court issued 127,057 summonses, but only 46,199 (36%) of them resulted in someone completing jury duty. Assuming these numbers remain constant, in any given year, about 127,000 summonses will be issued to a pool of about 500,000 people. In other words, if you’re eligible for jury duty, you have a 25% chance of receiving a summons each year. Once you’ve served, you won’t get another summons for at least 4 years.
Receiving a summons is no strong indication that you’ll wind up serving. Of the 127,000 summons issued in 2024, only about 18,000 resulted in somebody actually having to appear for jury duty. In 28,000 cases, the juror was available but their service was cancelled. In the remaining cases, the juror was ineligible or unavailable to serve, the most common reasons being postponement of service (29,300) or non-response (26,200).
If you’re part of the 14% of people receiving a jury summons who actually find themselves sitting in the waiting room at the Courthouse, the odds are good you’ll be sent to a courtroom for voir dire (the legal term for actual jury selection). In 2024, 16,927 people were sent to one of 524 voir dires (it’s possible some people participated in more than one voir dire proceeding). Of those, 72% were questioned and 36% were chosen to be a sworn juror.
To sum it all up, if you haven’t had jury duty for four years, there is about a 25% chance you’ll get a summons next year. If you do get a summons, there is a roughly 36% chance you’ll become eligible and available to serve, a 14% chance you’ll actually have to visit the courthouse, and a 5% chance you’ll be placed on a jury.
Jury Pool Demographics
Of course, those probabilities assume each person has an equal likelihood of selection at each stage of the process. This assumption is basically true in the initial draw of people receiving a jury summons, but it is distinctly not true in the second stage, self-response.
Following state law, the Milwaukee Circuit Court draws its jury pool from a list of state ID card holders provided by WisDOT. This is a good system. As I’ve written, nearly all Wisconsin adults have one of these cards.[i] Indeed, Milwaukee County’s master jury list included about 682,000 names in 2024, which was equal to 97% of the county’s estimated adult population of 701,000.
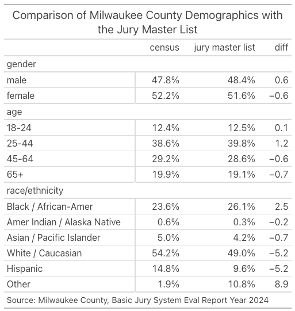
The demographics of the jury master list are about the same as the county’s, as shown in the table below. There are some differences by race, but, as I understand it, these are mostly the consequence of differences between how the Census Bureau and WisDOT measure race and ethnicity.
The big discrepancies occur among the 21% of people who receive a jury summons but don’t respond. In 2024, the rate of non-response was 12% for white, 19% for Asian, 30% for Hispanic, 39% for other, and 44% for Black summons recipients. A much smaller number, about 6% of those receiving a summons, were disqualified from service. Asians and Hispanics were the most likely to be disqualified at 32% and 19%, respectively. This likely reflects language barriers. Wisconsin law requires jurors to be fluent English speakers. Prospective white and Black jurors were disqualified at rates of 6% and 3%, respectively.
Given these statistics, efforts to improve the demographic representativeness of Milwaukee’s juries should focus on the reasons why some people don’t respond to their jury summons in the first place. The summons process itself is demonstrably fair.
[i] My analysis compared DOA records with census estimates derived from vital statistics. I estimated that the share of the adult population with a state-issued ID card lies somewhere between 94% and 100%. Those less likely to have an ID include college students, recent movers from out-of-state, 18 and 19 year olds, and poor people. All else being equal, Black and Asian Wisconsinites are more likely to have an ID than white ones.
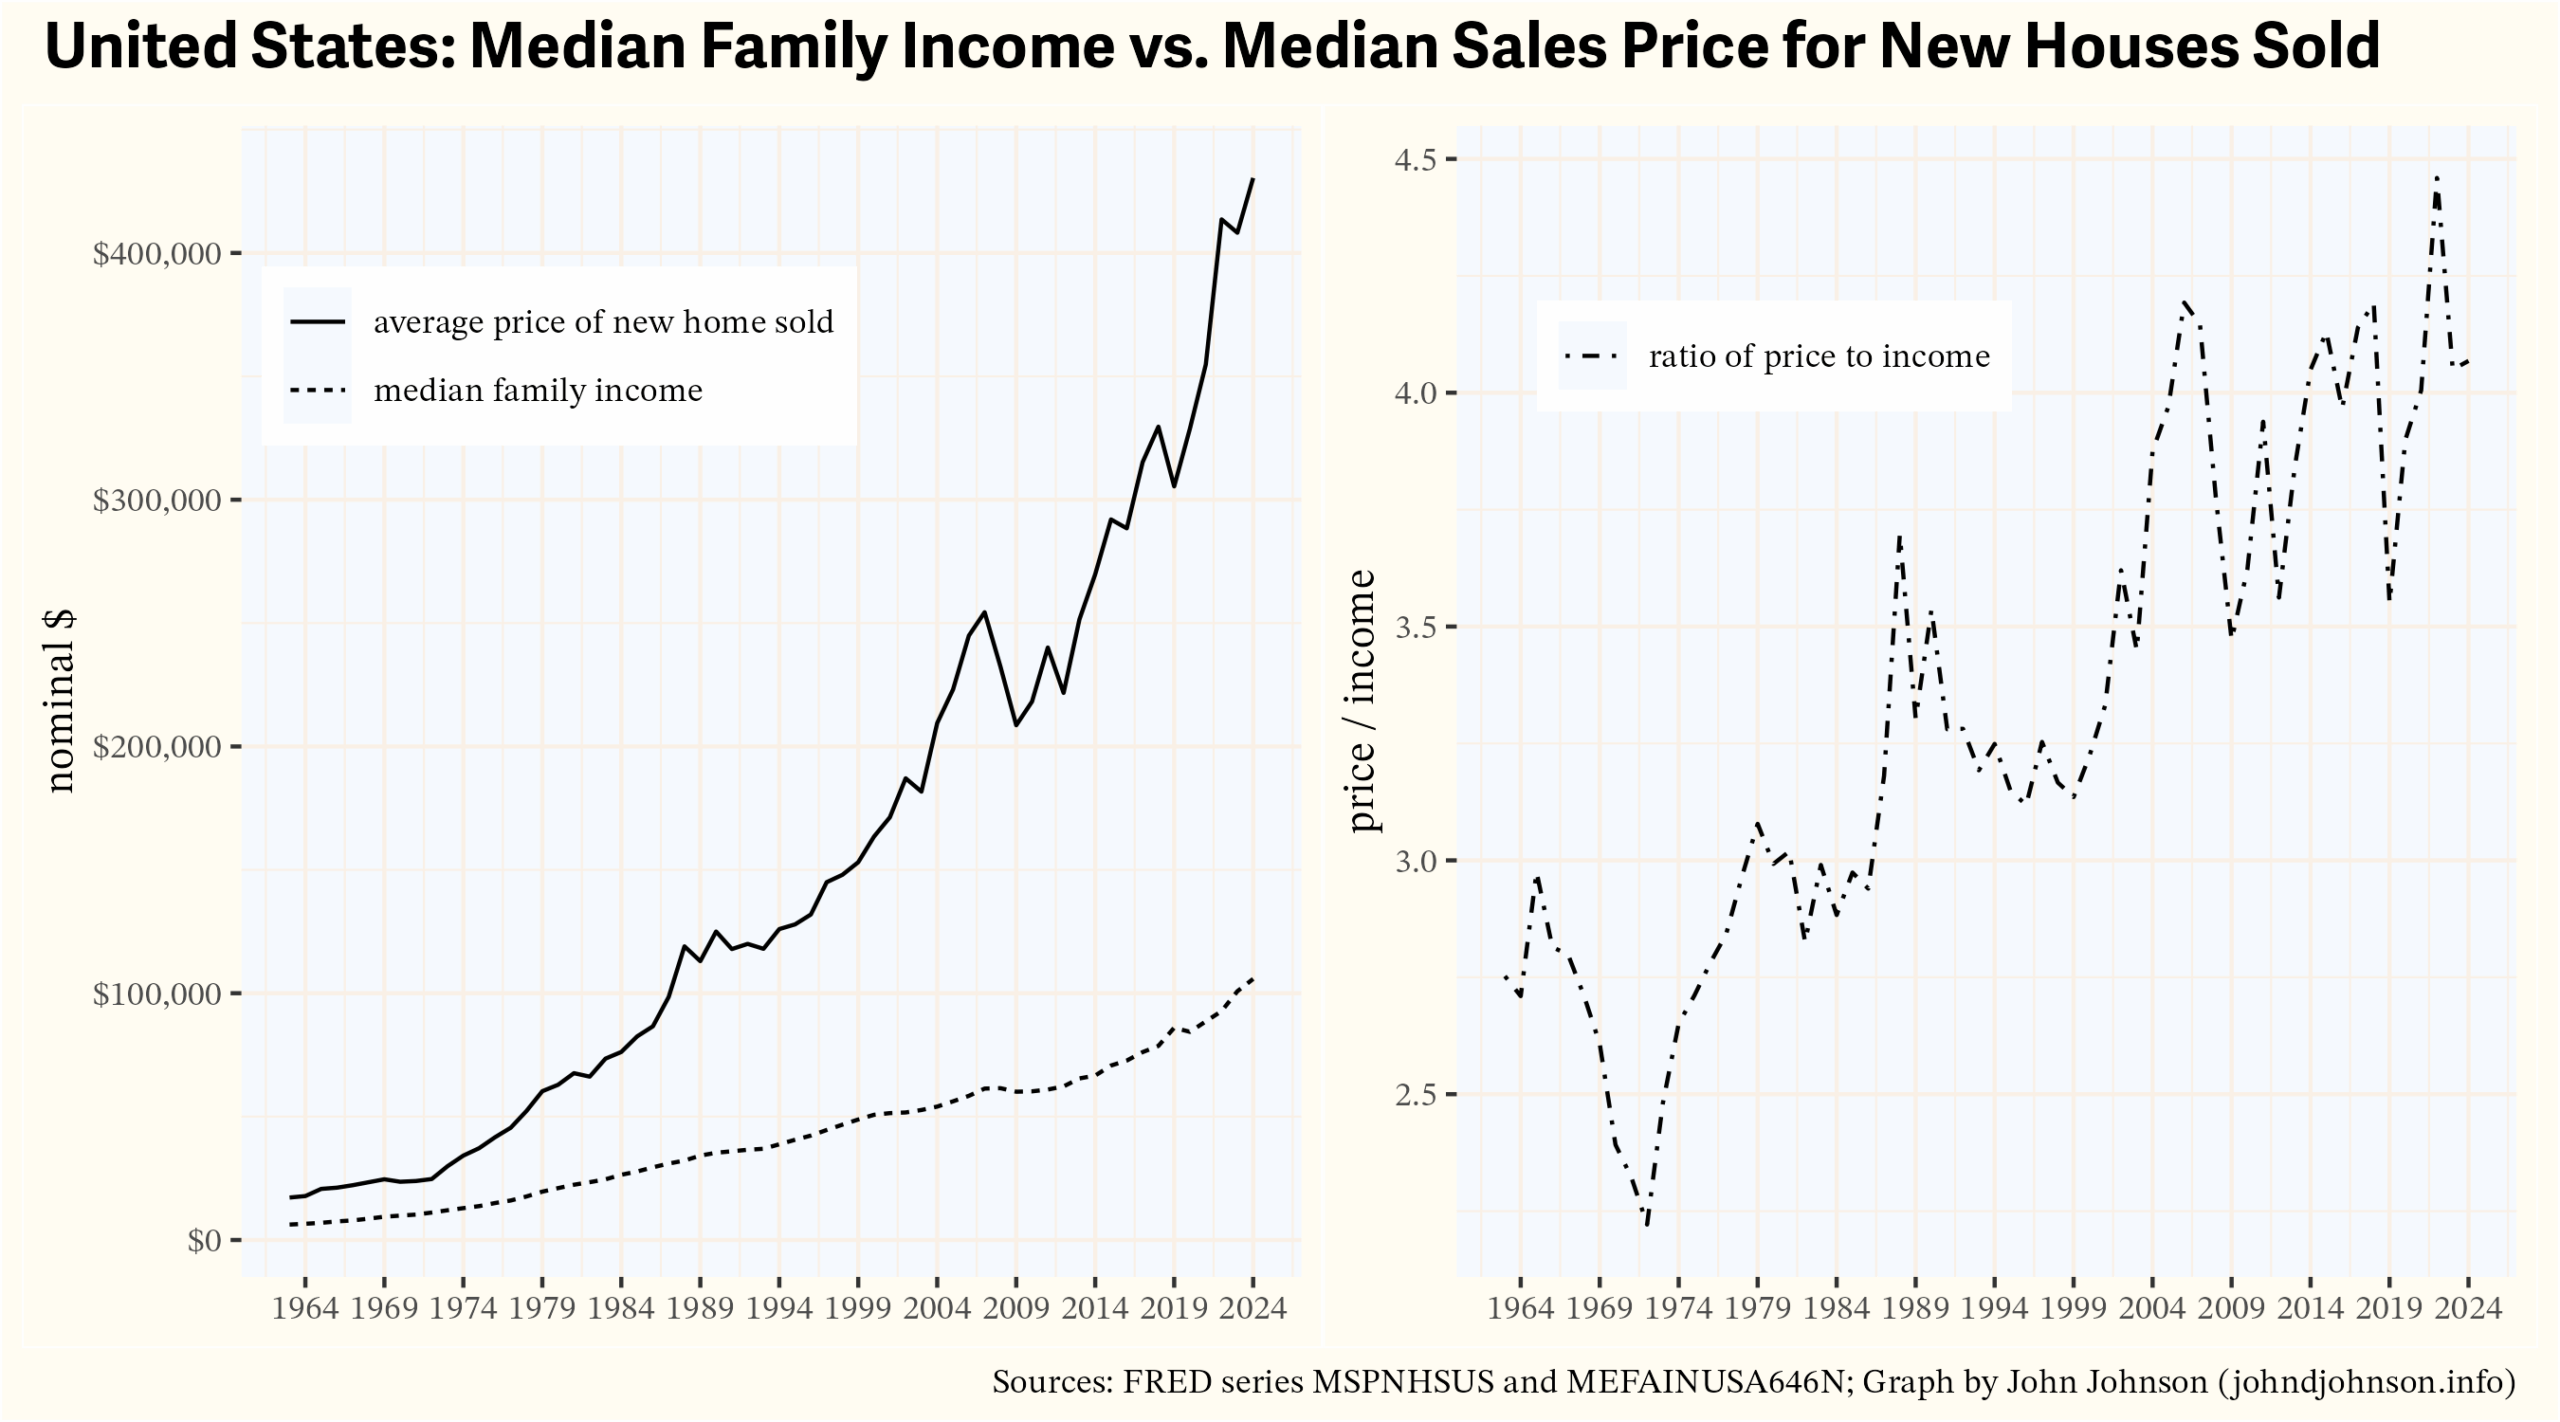
A traditional rule of thumb for buying a house is “3x income.” If your household income is $100,000 (the thinking goes) you can afford a $300,000 house. The wisdom of the 3x rule is debatable, but it usefully illustrates the crux of America’s housing crisis. A dwindling share of the population can afford to finance the construction of a new house.
Consider: the 50th percentile household in the U.S. had an income of $83,730 in 2024—the highest income on record, even adjusted for inflation. By the 3x rule, that household could afford a $251,190 house. The average sale price of a new home in August 2024 was $405,800. Just 16% of new houses sold in 2024 were priced below $300,000. Data isn’t available to further breakdown those sub-$300,000 prices, but I’m confident scarcely any were sold for $250,000 or less. As I write this, Zillow shows just one developer in Wisconsin building detached single-family homes with a list price of $250,000.[i]
In other words, by the traditional “3x rule,” the average American household can afford to buy a newly-built detached, single-family home in exactly one subdivision in Wisconsin.
The census concept “households” includes people who live by themselves. New housing affordability looks a little less dire when we look at statistics for “families,” defined as at least two related people living together. Families increasingly consist of at least two wage earners, so the median family household income in 2024 was $105,800. Following the 3x rule, this family could afford a $317,400 house.
By this standard, at least some of new homes are affordable for the median family. In addition to the 16% of homes sold for less than $300k in 2024, another 29% were sold for $200-300k.
Still, the choices available to the median family have greatly diminished. Prior to 1980, the average family could afford the average house. The median new home price was consistently less than 3x the median family income. It surged past this line by the end of the 1980s, never to return. At the beginning of 2024, the 50th percentile new home price was 4.07x greater than the 50th percentile family income.
Official housing and income time series (like the ones graphed above) mostly begin in the 1960s or later. Most of Milwaukee’s existing housing stock—the turn of the century cottages, the 1920s bungalows, the post-war cape cods and ranches—were built well before then. I wanted to understand how much it cost to build those houses and who could afford to buy them.
I chose to focus on modest, working class housing from each Milwaukee era, rather than grander middle and upper class homes. Before World War II, a common practice was to buy an empty lot on the city’s periphery and pay for the construction of a new house. To estimate these costs, I collected newspaper advertisements for vacant lots and looked up construction costs recorded on original building permits. After World War II, it was far more common to buy already-built homes, often directly from the builder, so I obtained list prices for new homes from Milwaukee Journal advertisements.
The Late 19th Century
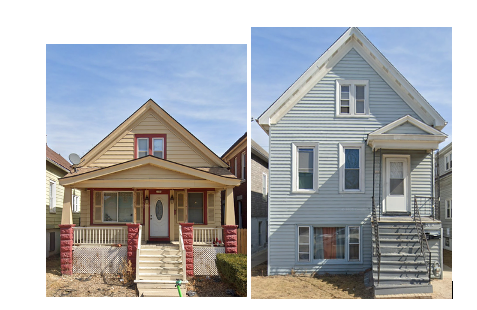
About 4% of the city’s existing houses are cottages, mostly built in the late 19th century. Some of them, like the cottage shown below on the right, were later converted into a duplex, by raising the first floor to accommodate a unit in the basement level. Cottages like these are found throughout neighborhoods near downtown, and they are especially common on the near south side.
Building permits show that the house on the left cost $600 to build in 1890. The house on the right cost $500 in 1889 (it was not yet a duplex).[ii] Empty lots typically ranged in cost from $250 to $400 in residential subdivisions.[iii]
To put that into context, here are the average wages for 15 common jobs in Milwaukee in 1890.
1890 Hours and Wages for Selected Occupations in Milwaukee, Wisc.
The best paid jobs on this list were plumbers ($1,001/yr) and compositors ($944), who laid out the type for newspapers. The worst paid were common laborers, who made $407 in the building trades and $424 in foundries and machine shops. Compare these wages to the cost of the cottages shown above. For plumbers, an average salary was basically equal to the cost of a modest cottage. For a laborer in the building trades, a modest cottage might range from 1.8x to 2.5x his salary.
Circa 1910
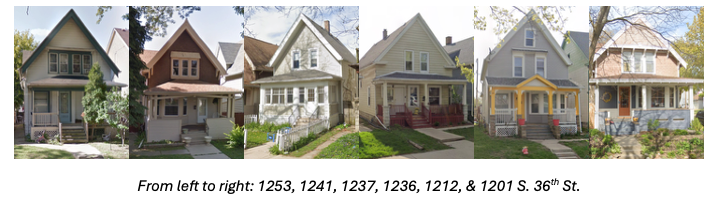
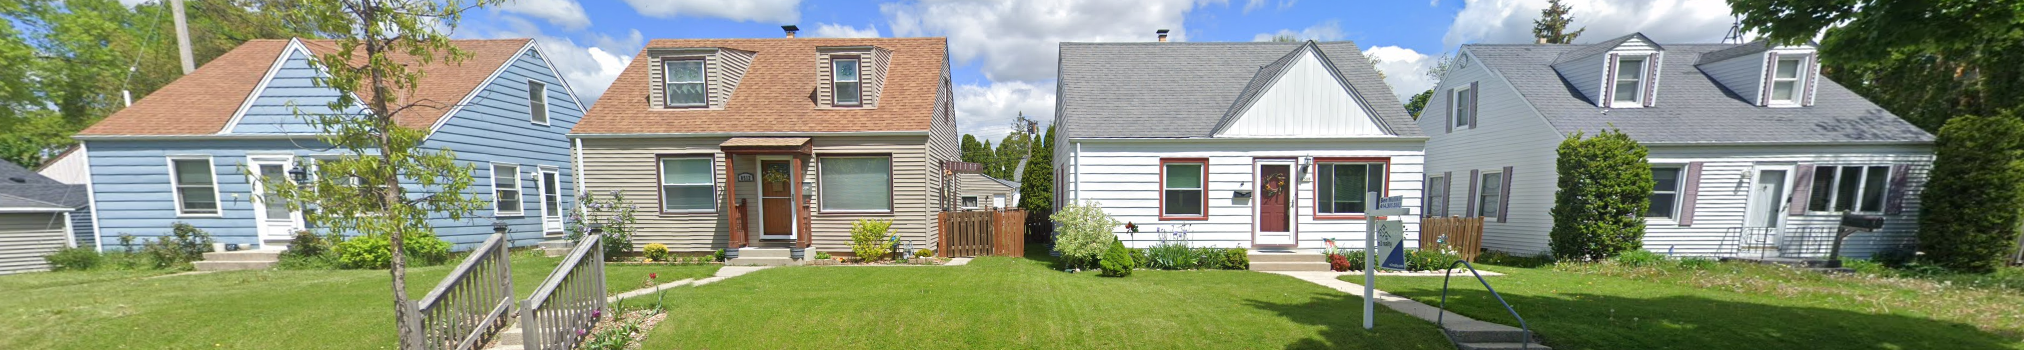
The quality and cost of housing increased in the early 20th century. These photos show six houses on the 1200 block of South 36th Street in Milwaukee’s Silver City neighborhood. They were all built in 1908 or 1909. Their building permits list construction costs of, from left to right: $2,600; $4,000; $2,100; $2,200; $2,100; and $3,000.
Newspaper ads from the time period show empty residential lots usually selling for $350 to $1,025. A common scenario might be building a $2,700 house on a $600 lot, for a total cost of $3,300.[iv] Here is how that cost compares with the wages paid to common Milwaukee professions in 1909. The wage numbers are from union wage scale data published by the Bureau of Labor Statistics.
1909 Hours and Wages for Selected Occupations in Milwaukee, Wisc.
Relative to 1890, this table shows diminished affordability—although, it’s important to note that the quality of the housing being purchased had increased as well. The most highly paid jobs in this list are bricklayers and stonemasons. For them, a $3,300 house would cost 2.2x their annual income. The lowest paid jobs are bakery second-hands and building trades laborers, for whom a $3,300 house would cost 4.9x and 4.8x annual salary, respectively.
The 1920s
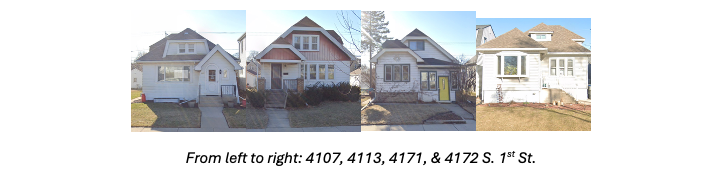
Most of the houses built in Milwaukee during the 1920s were bungalows (including both single family homes and duplex variants). Bungalows came in various shapes and sizes and could be built out of wood, stone, or brick. But the cheapest bungalows (often sold in kits) were quite affordable. The four bungalows pictured below are in the former Town of Lake, which was annexed by Milwaukee in 1954. They were built in 1929 and 1930 at a cost, according to their building permits, of $5,000 for the first three and $5,500 for the fourth.
Newspaper ads from the period list many empty lots at prices ranging from $750 to $1,600. Taking a lot price of $1,200 would put the total cost of a basic duplex at $6,200. Here is how that cost compares to the 1928 wages of some common Milwaukee jobs.
1928 Hours and Wages for Selected Occupations in Milwaukee, Wisc.
Wages grew faster than the cost of housing from 1909 to 1928. The best paid jobs in the table above were sign-painter, bricklayer, and stonemason. For these workers, our $3,300 bungalow would cost less than twice their annual income.
The worst paid workers on this list from 1928 were once again building trades laborers and second-hand bakers. For these workers, the cost of our new bungalow works out to 3.6x or 3.4x annual income.
The 1950s
Little new housing was built during the Great Depression or World War II. After the war, there was a voracious need for new housing across the country. Milwaukee met that demand mainly by building thousands of modest cape cod and ranch style single family homes on the northwest and southwest sides of the city.
The January 31, 1952 Milwaukee Journal includes many listings for new homes, with prices for simple 2 and 3-bedroom models ranging from $11,780 to $16,300.
8500-18 W. Townsend St. These homes were advertised with an asking price of $13,800 each in January 1952.
For $14,000, a buyer would be able to choose between a variety of houses across many neighborhoods. Here is how that cost compares to 1952 wages for common Milwaukee jobs.
1952 Hours and Wages for Selected Occupations in Milwaukee, Wisc.
Bricklayers were once again the best paid job in this data. For a bricklayer, a $14,000 house would cost 2.3x salary. The worst-paid jobs were bakery second hands and building trades laborers. A $14,000 house would cost 3.6x and 3.4x their annual salary, respectively.
The 2020s
Today, wage data is easy to come by. In 2024, the median full time salary for a Milwaukee plumber was $82,080. It was $80,320 for bricklayers; $76,820 for electricians; $62,260 for carpenters; $55,420 for construction laborers; $53,010 for machinists; and $50,610 for painters.
Housing costs are less clear, because very few new single family homes get built without government or philanthropic subsidies. In any given year, Habitat for Humanity is responsible for most of the detached, single-family homes built in the city.
As I write this, Zillow shows just 6 new, single-family homes for sale inside city limits.
Some of them reflect the costs of standard contemporary housing. One, a 2,044 sq. ft. house near St. Francis, is listed for $585,000. Two $1,600 sq. ft. houses on the border with Brown Deer are listed for a little over $400,000. Empty lots like these—where prevailing home prices can justify market rate construction—are rare.
The cheapest apparently unsubsidized house is a $349,000 1,700 sq. ft. project by Lange Urban Sustainable Homes, a local company with a patented modular plywood assembly process. By “unsubsidized” I mean that the company appears to be attempting to at least recoup their construction costs in the sale of the home. The land itself was sold by the City of Milwaukee to Lange for $1.
5766 N. 42nd St.
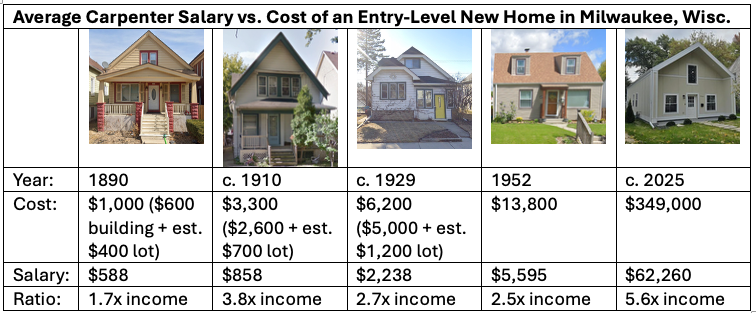
From everything I’ve seen, $350,000 seems like a reasonable (though possibly low) estimate of what it costs to build a modest single-family home today, excluding the cost of land, which is available practically for free in Milwaukee’s cheapest neighborhoods. This table shows a $350,000 housing cost as a ratio of median incomes for selected professions. It compares this 2024 ratio with ratios I’ve calculated for 1890, 1909, 1928, and 1952.
Ratio of Entry-Level New Single-Family Home Price to Average Annual Wages for Selected Professions in Milwaukee, Wisconsin
occupation
1890
1909
1928
1952
2024
Bricklayer/mason
1.1
2.2
1.9
2.3
4.4
Carpenter
1.7
3.8
2.7
2.5
5.6
Electrician (indoor wireman)
3.5
2.3
2.6
4.6
Construction laborer
2.5
4.8
3.6
3.4
6.3
Painter
1.6
2.4
3.1
6.9
Plumber
1
2.6
2.3
4.3
Machinist
1.5
2.6
6.6
Assumes house price of $1,000 in 1890; $3,300 in 1909; $6,200 in 1928; $14,000 in 1952; and $350,000 in 2024. 1890 wage data are from the 19th Annual Report of the Commissioner of Labor, 1909-1952 data are from BLS Union Wage Scales. 2024 data are from the BLS OEWS.
The cost of a modest new house was attainable on almost all of these salaries in the 1920s and 1950s. Today, none of them are, at least judging by the 3x rule. An average Milwaukee construction laborer’s wages rose by a factor of 136, from $407 in 1890 to $55,420. Meanwhile, the cost of a modest new house grew by a factor of 350.
One explanation for why housing costs have grown so much is Baumol’s cost disease. Over the last century, many parts of the economy have grown enormously in productivity. But housing hasn’t, at least not in relative terms. The labor required to build a house is still much the same as it was 100 years ago. The historical wage records I researched for this article inadvertently demonstrate this. Many of early 20th century job categories associated with manufacturing and printing literally no longer exist (e.g. “newspaper photo engraver”). But nearly all of the jobs from the building trades category remain consistently present. You still need a plumber, an electrician, carpenters, painters, and laborers to build a house.[v] This is why I’m skeptical of solutions to America’s housing affordability crisis that focus on zoning and land use regulations. Those are important. But even when land is free, the cost of construction is increasingly difficult to afford. When Milwaukee was built, a new house could be feasibly financed with the salaries of many workers. Now, sometimes two salaries isn’t enough.
[i] Zillow also shows four standalone new houses in Wisconsin listed for less than $250,000. They mostly resemble glorified garages.
[ii] Corroboration of these price points comes from an 1890 book published in Chicago, The Complete House Builder, which estimated that a cheap cottage on a posts could be built for $476. Plumbing would add an additional $175 and a foundation about the same.
[iii] Per my investigation of newspaper classifieds.
[iv] Upper/lower duplexes were also commonly built in the 1910s. I looked up the construction cost of 9 duplexes built between 1907 and 1910 on the 2800 block of North Murray Avenue. They ranged in cost from $4,500 to $6,000 with an average of $5,356. Presumably, most families who built one of these houses also collected rent from the other unit.
[v] Sometimes the names change, e.g. “inside wiremen” became “electrician.”