Elections for the Wisconsin Assembly haven’t seen much drama for a decade. The decline in ticket splitting among voters across the state, combined with the rock-solid gerrymander drawn in 2011, meant that scarcely any seats changed hands between parties. The “least-change” map adopted in 2022 tipped a few more seats toward the GOP but mainly reaffirmed the electoral status quo.
The new state legislative maps drawn by Governor Evers and passed in early 2024 bear little resemblance to those used previously. Most Wisconsinites live in a new district. WPR reports that “at least 44 state representatives and senators will run in new districts.”
With so much up in the air, I wanted to calculate election statistics from some of Wisconsin’s previous, relatively un-gerrymandered maps. How many seats usually changed hands between the parties? How often did incumbents lose? How common were open seats?
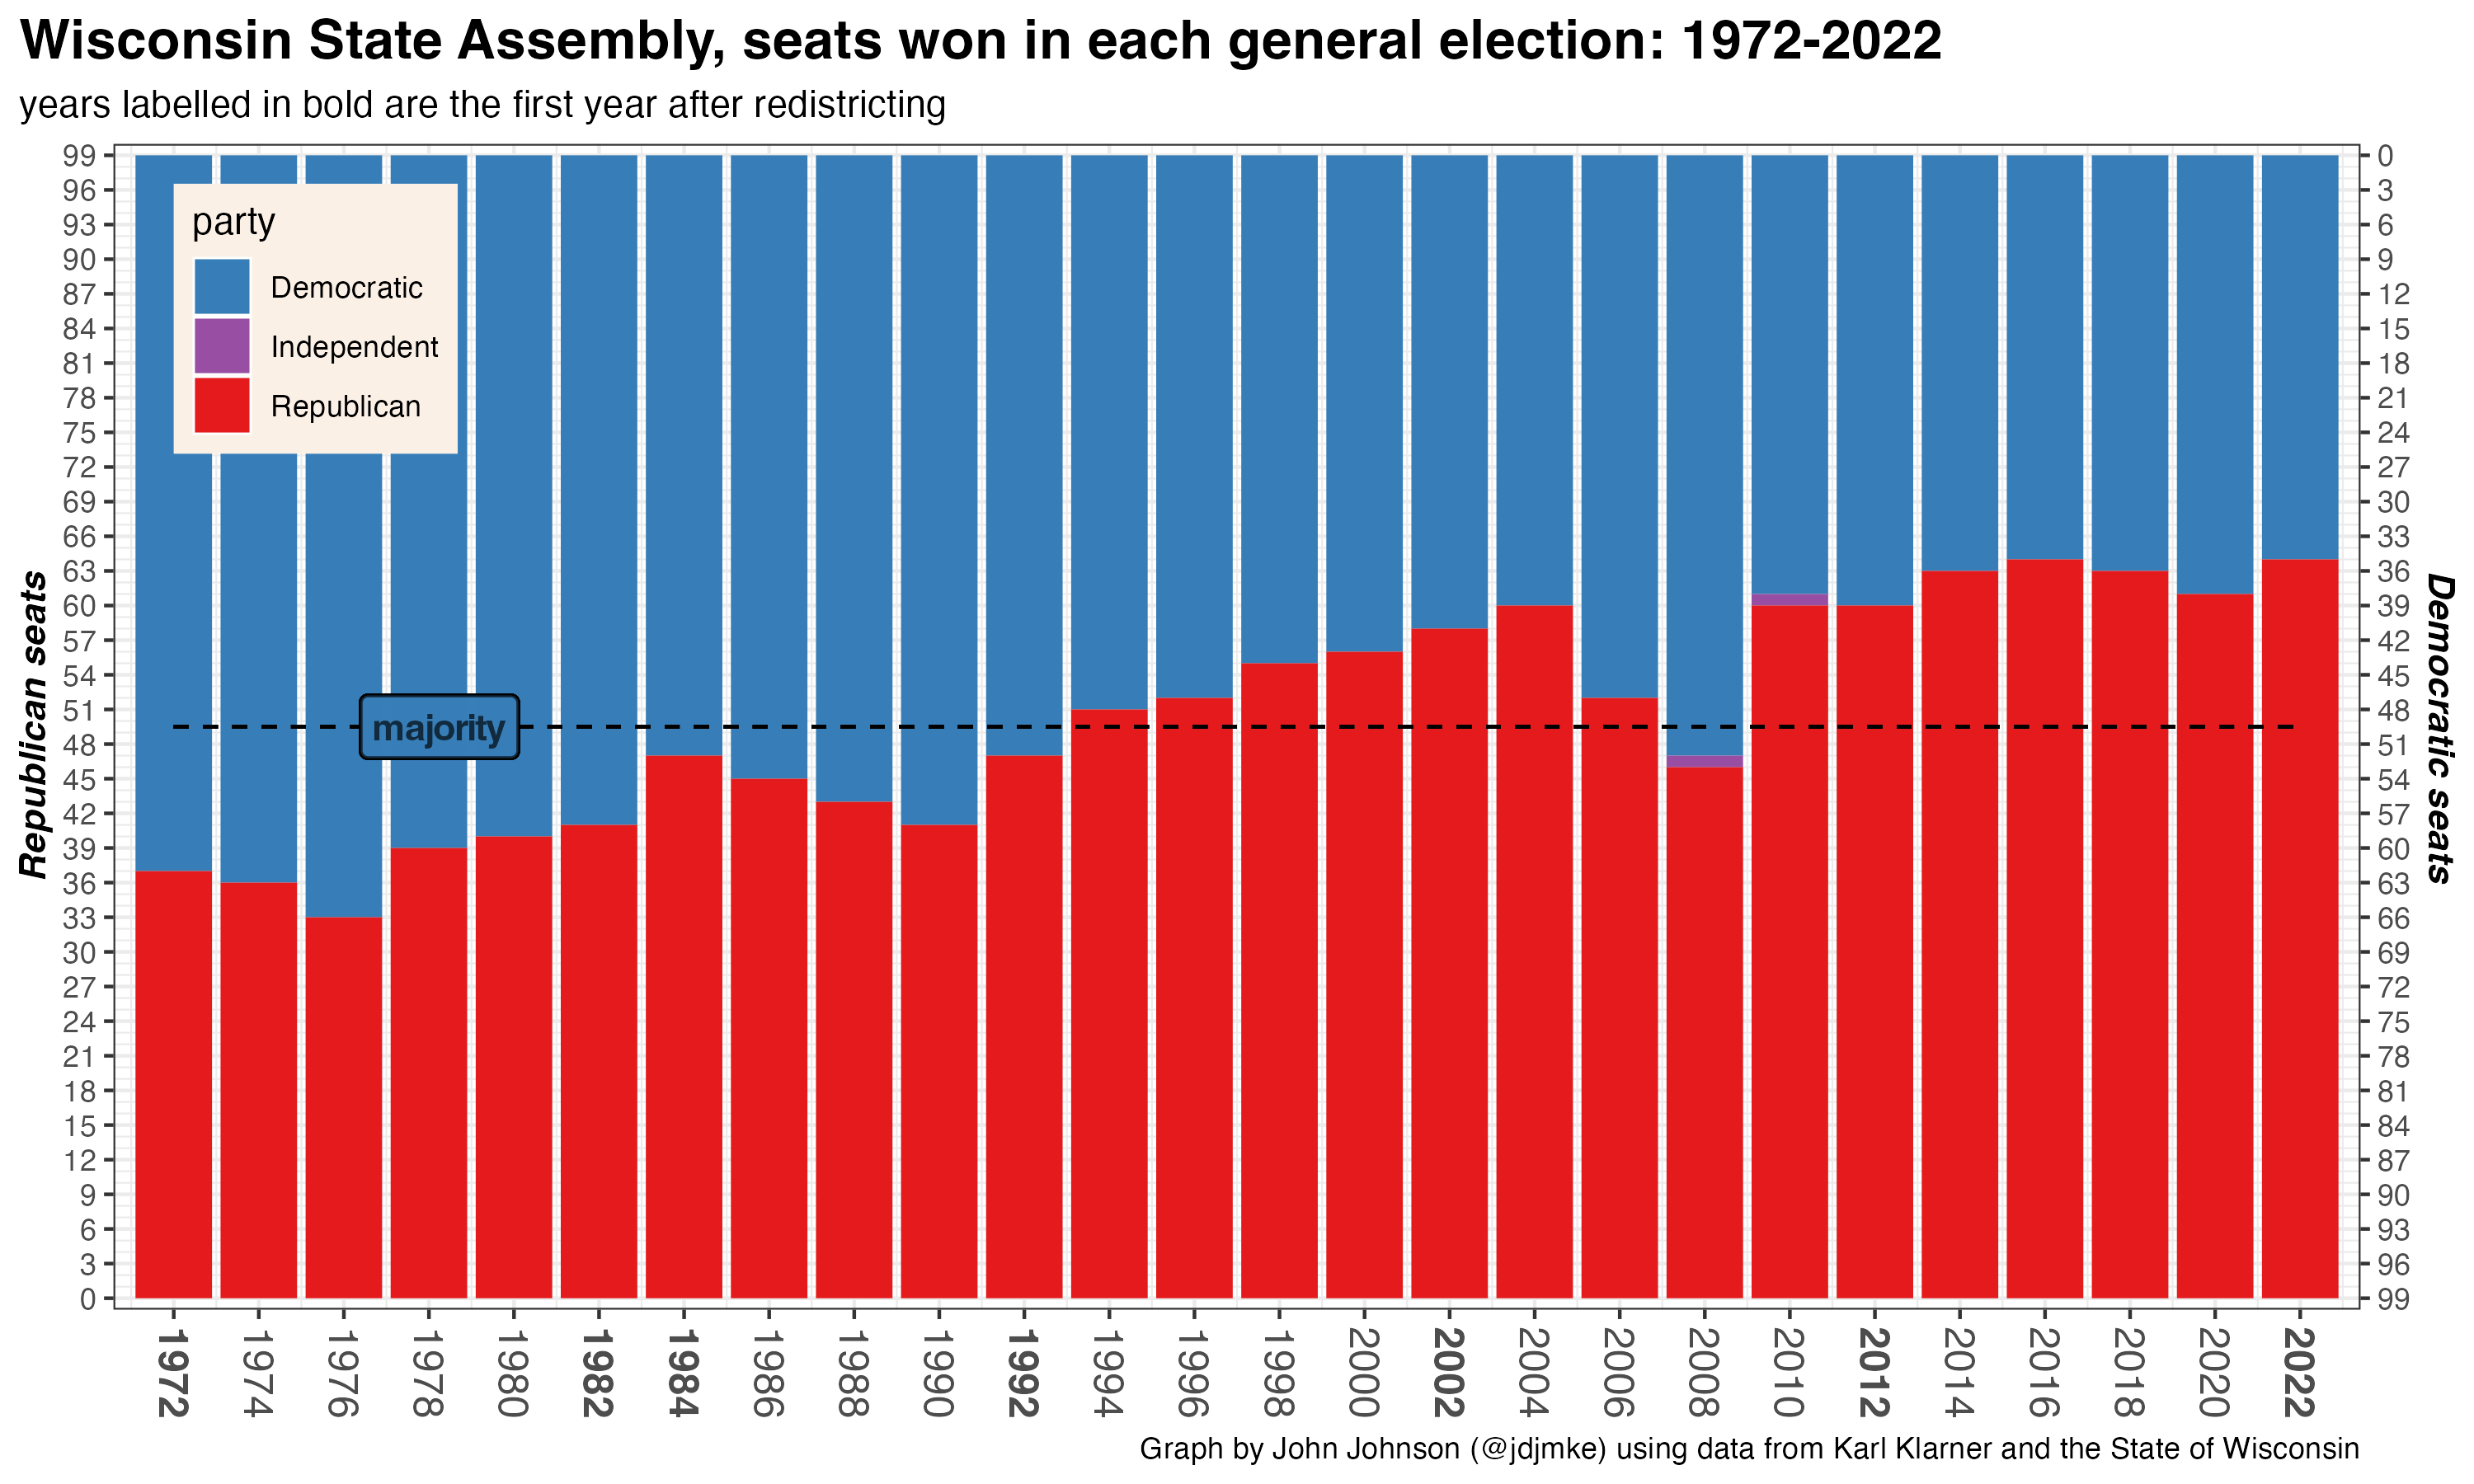
First, here is a graph showing the seats won by each party in each November general election. I begin in 1972, because that was the first year when the Assembly had 99 members (before that, it had 100).
Democrats held a majority of the Assembly from the 1970 election until 1994. Then, Republicans controlled it until 2008. After the 2008 election, Democrats briefly controlled both chambers of the state legislature and the governor’s mansion. The Tea Party wave in 2010 flipped all chambers to Republican control. The balance of power in the Assembly has changed little since then.
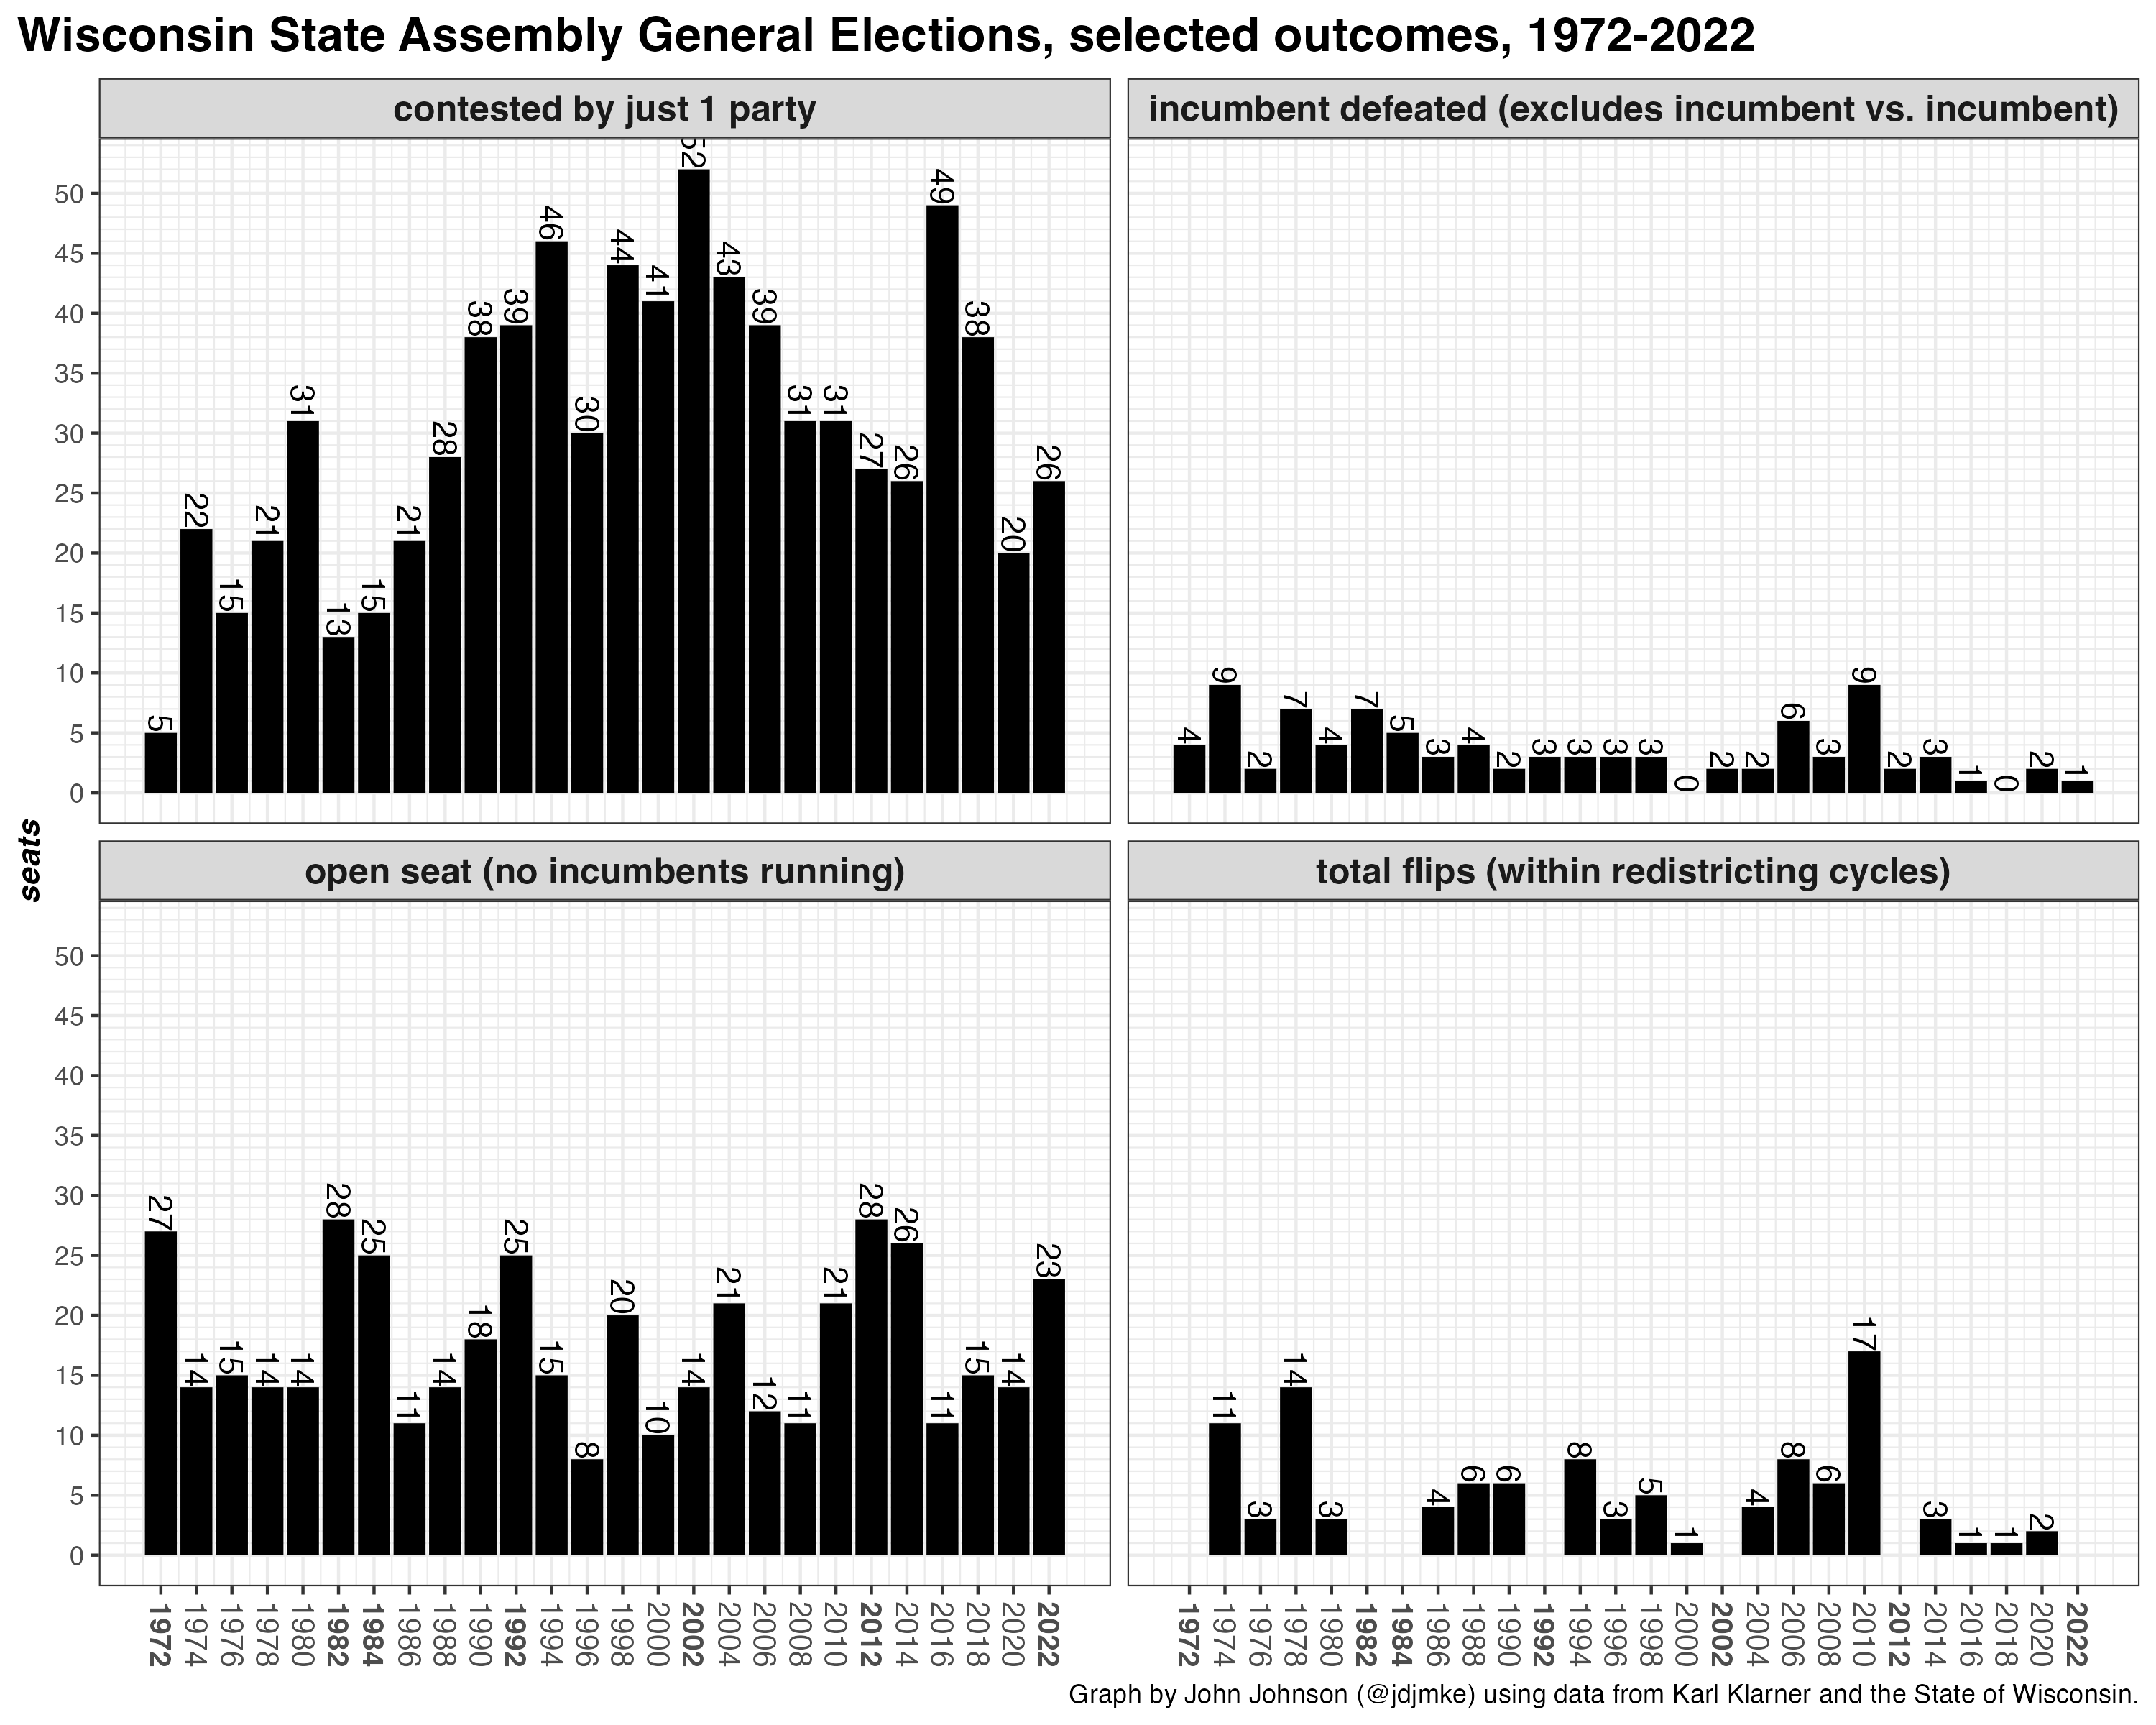
The next series of graphs show selected election statistics for each general election to the Assembly.
- The number of uncontested seats—where just 1 party fields a candidate—has bounced around. But it has generally been lower in the 2010s than the 1990s and 2000s.
- Incumbents are rarely defeated. Under the maps in use from 2012-2020, a total of 8 incumbents lost to a non-incumbent challenger.
- The number of open seats (with no incumbent running) has followed a natural rhythm. In most years, around 15 races feature no incumbent, but every decade or so the number of open seats jumps to around a quarter of the chamber.
- The number of seats flipping between the parties has rarely been high, but it was especially low during the 2010s. This statistic can only be calculated when the district boundaries are used in sequential elections.
- There were 396 general elections for an assembly seat from 2014 to 2020. Only 7 resulted in a flip. That’s a flip rate of 1.8%.
- From 2004-2010, 35 seats flipped, a rate of 8.8%.
- From 1994-2000, 17 seats flipped, a rate of 4.3%.
- From 1986-1990, 16 seats flipped, a rate of 5.4%. (Both the 1982 and 1984 elections featured new districts).
- From 1974-1980, 31 seats flipped, a rate of 7.8%.
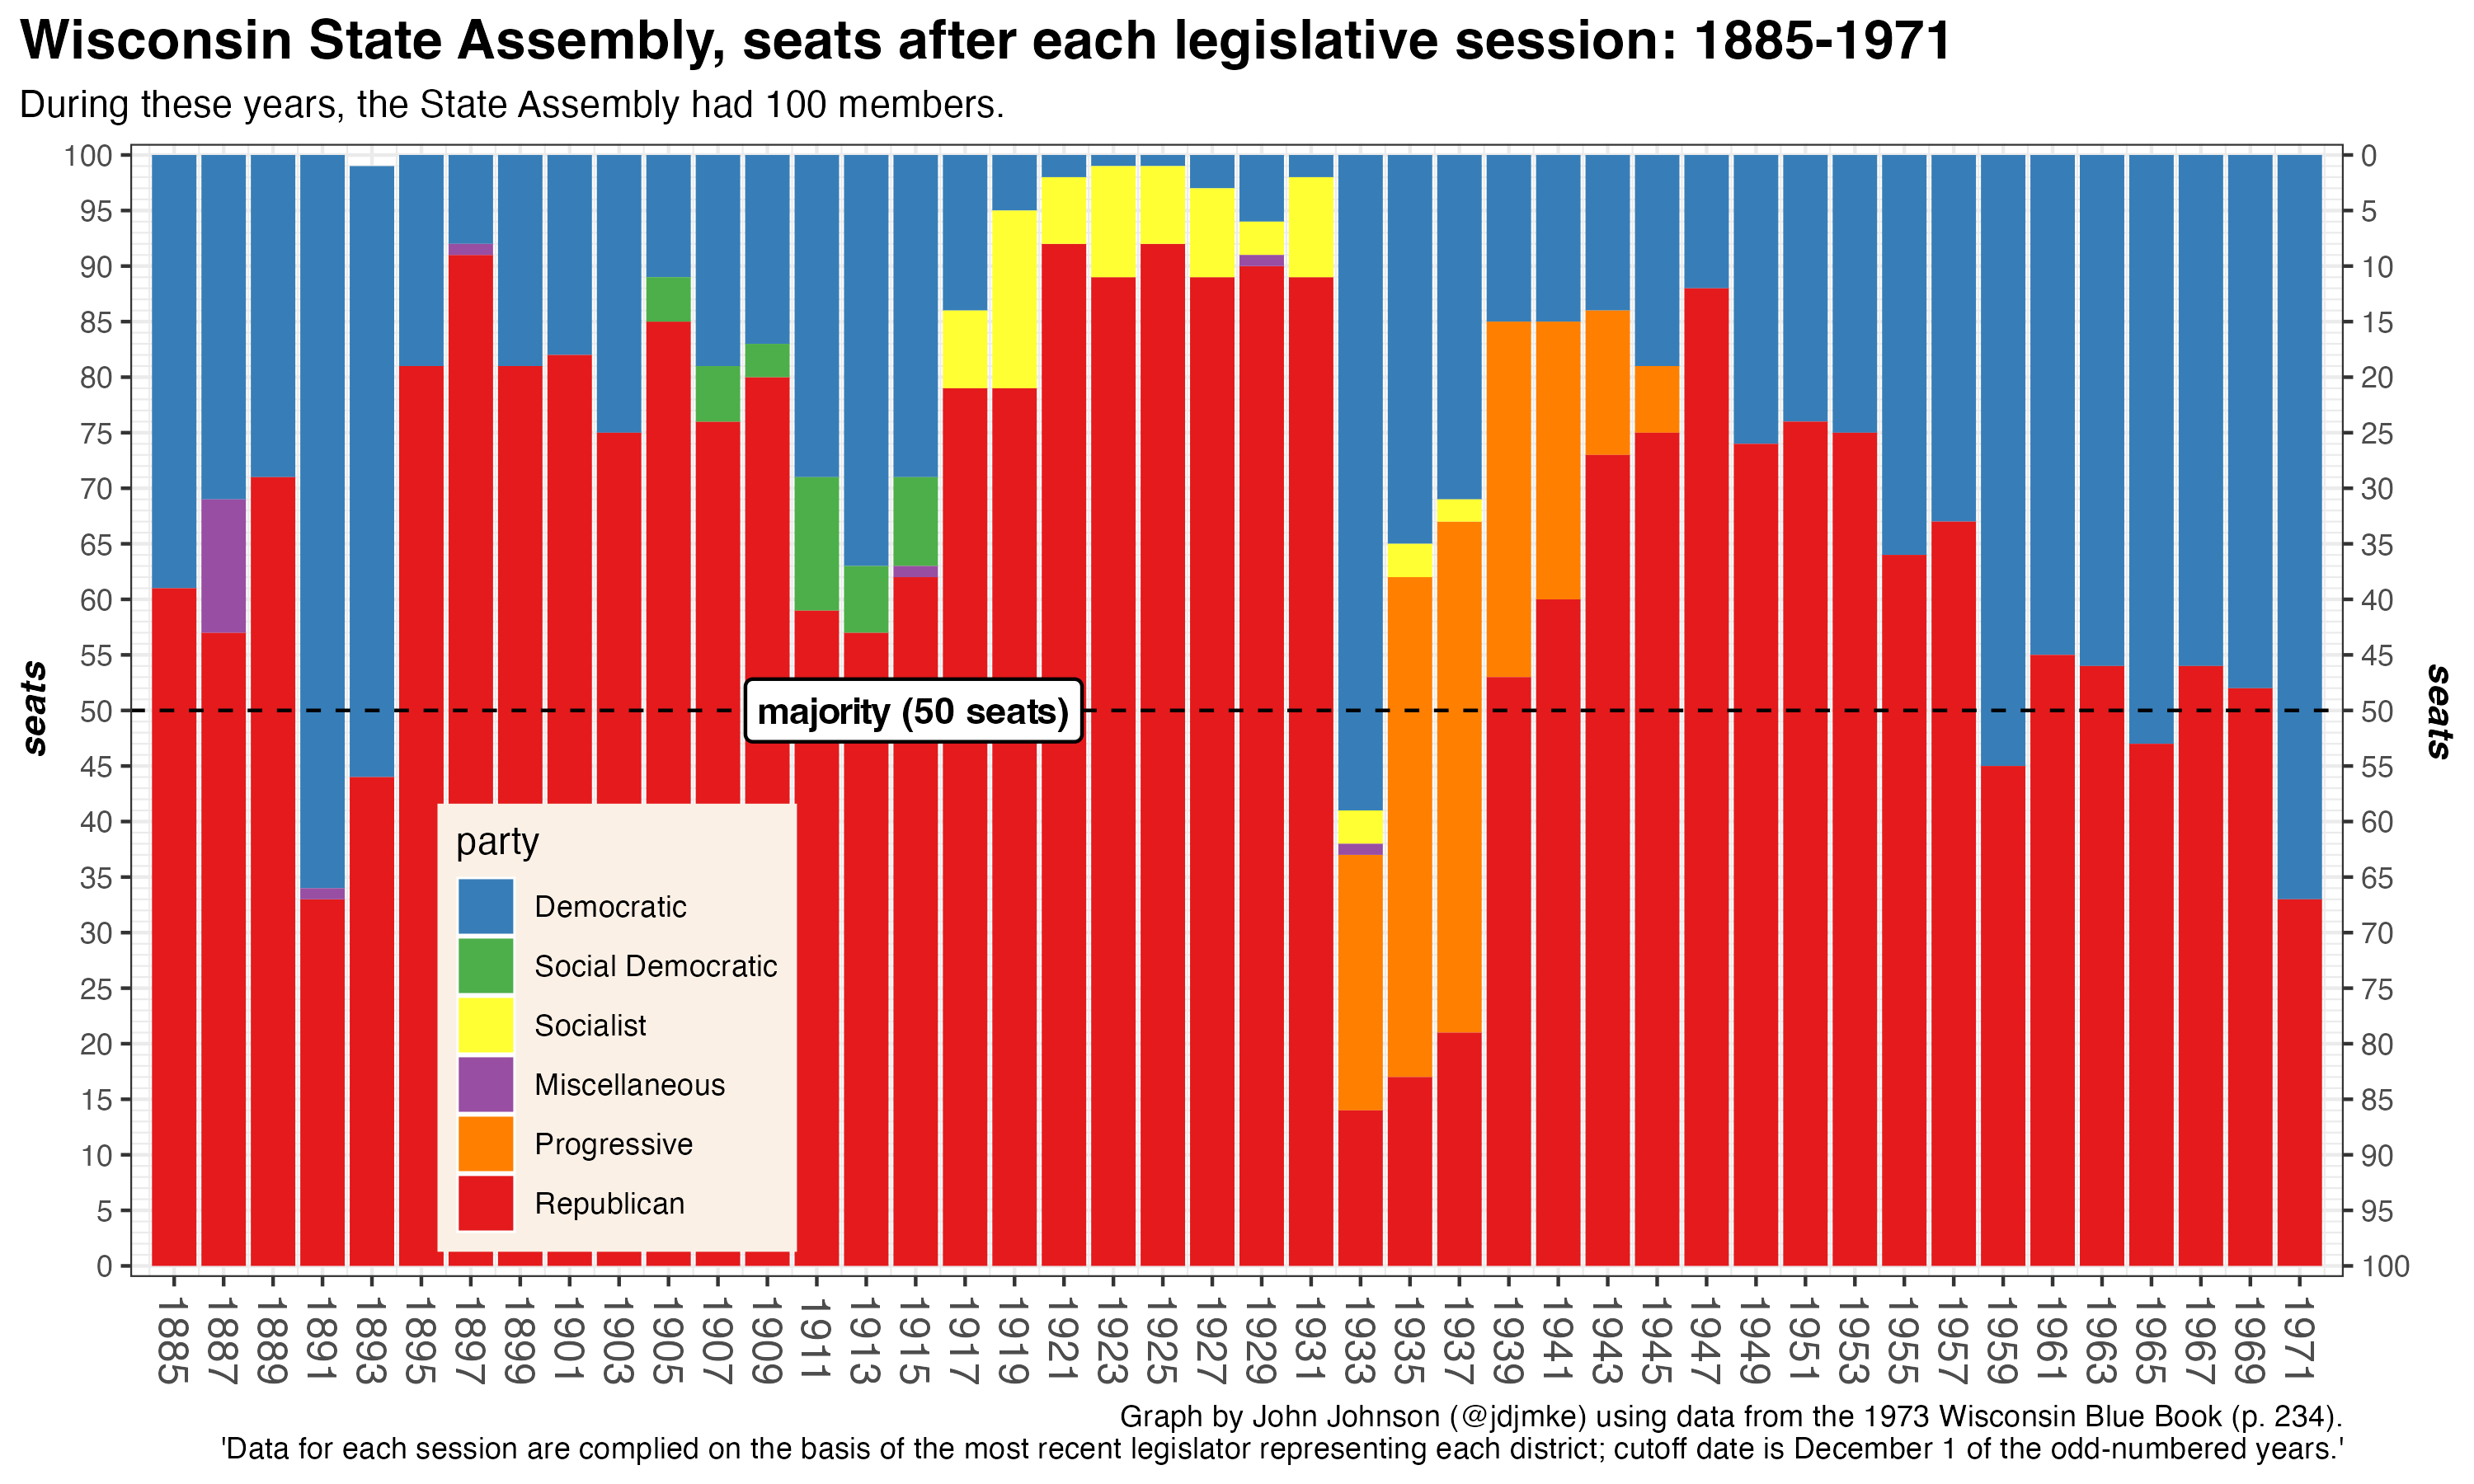
Prior to 1972, the Wisconsin Assembly contained 100 seats. This graph shows the partisan composition of each legislature from 1885 through 1971. This data is slightly different than the figures shown above, because it shows party membership of legislators in December of each odd-numbered year. The data I discuss above shows the party composition of the winners in each even-numbered general election.
The Republican Party overwhelmingly dominated the late 19th and early 20th centuries in Wisconsin. Democrats held a majority after only 5 elections during the entire period from 1885 to 1971. During the 1920s, Republicans held almost all the seats in the Assembly and the Socialist Party typically won more seats than the Democrats.
Note: The graph titled “Wisconsin State Assembly General Elections, Selected Outcomes, 1972-2022” has been corrected to show that 26, not 25, seats were contested by 1 party in 2022.