Wisconsin candidates are required to submit their next campaign finance reports by Wednesday, July 15th. These will record all their fundraising and spending through June 30th. The gubernatorial candidates fundraising hauls will draw the most attention, but I’m also looking forward to seeing the numbers for Wisconsin’s state legislative candidates.
In November, Wisconsin will elect all 99 state assembly and 17/33 state senate seats. The 2026 elections will be the best chance for Democrats to win legislative majorities since they lost them in 2010. Currently, Republicans hold a 3-seat majority in the upper chamber and a 9-seat majority in the lower.
The simplest path to a majority for Democrats is to hold the seats they’ve already got while winning the handful of Republican-held seats Kamala Harris won in 2024, despite narrowly losing statewide. This would be enough for a two-seat majority in the senate and a 1-seat majority in the assembly.
These are not the only possible battlegrounds. Democrats could cast a wider net and attempt to flip some seats in the assembly that Trump won only narrowly. Republicans could take a swing at the two Democratic-held seats which Trump actually carried in 2024. The July 15th fundraising figures will give us a sense of where the two parties’ strategic priorities lie.
This post lays out some background on how much these campaigns usually raise and spend, both cumulatively and through July 1st. I also calculate a simple measure of money’s influence in these races.
Campaign Spending
In assembly races, the median Democratic campaign spending fluctuates between about $20,000 and $45,000. Median Republican spending is a bit higher–hovering around $50,000 in recent cycles. These statistics are only for elections where both parties fielded a candidate.
State senate races are much more expensive. In 2010, the median Democratic campaign spent $83,000 and the median Republican spent $124,000. Those levels of spending stayed about the same in 2012 and 2014, but in 2016 campaign spending went through the roof. The median Republican campaign spent $334,000 to $433,000 for the median Democrat.
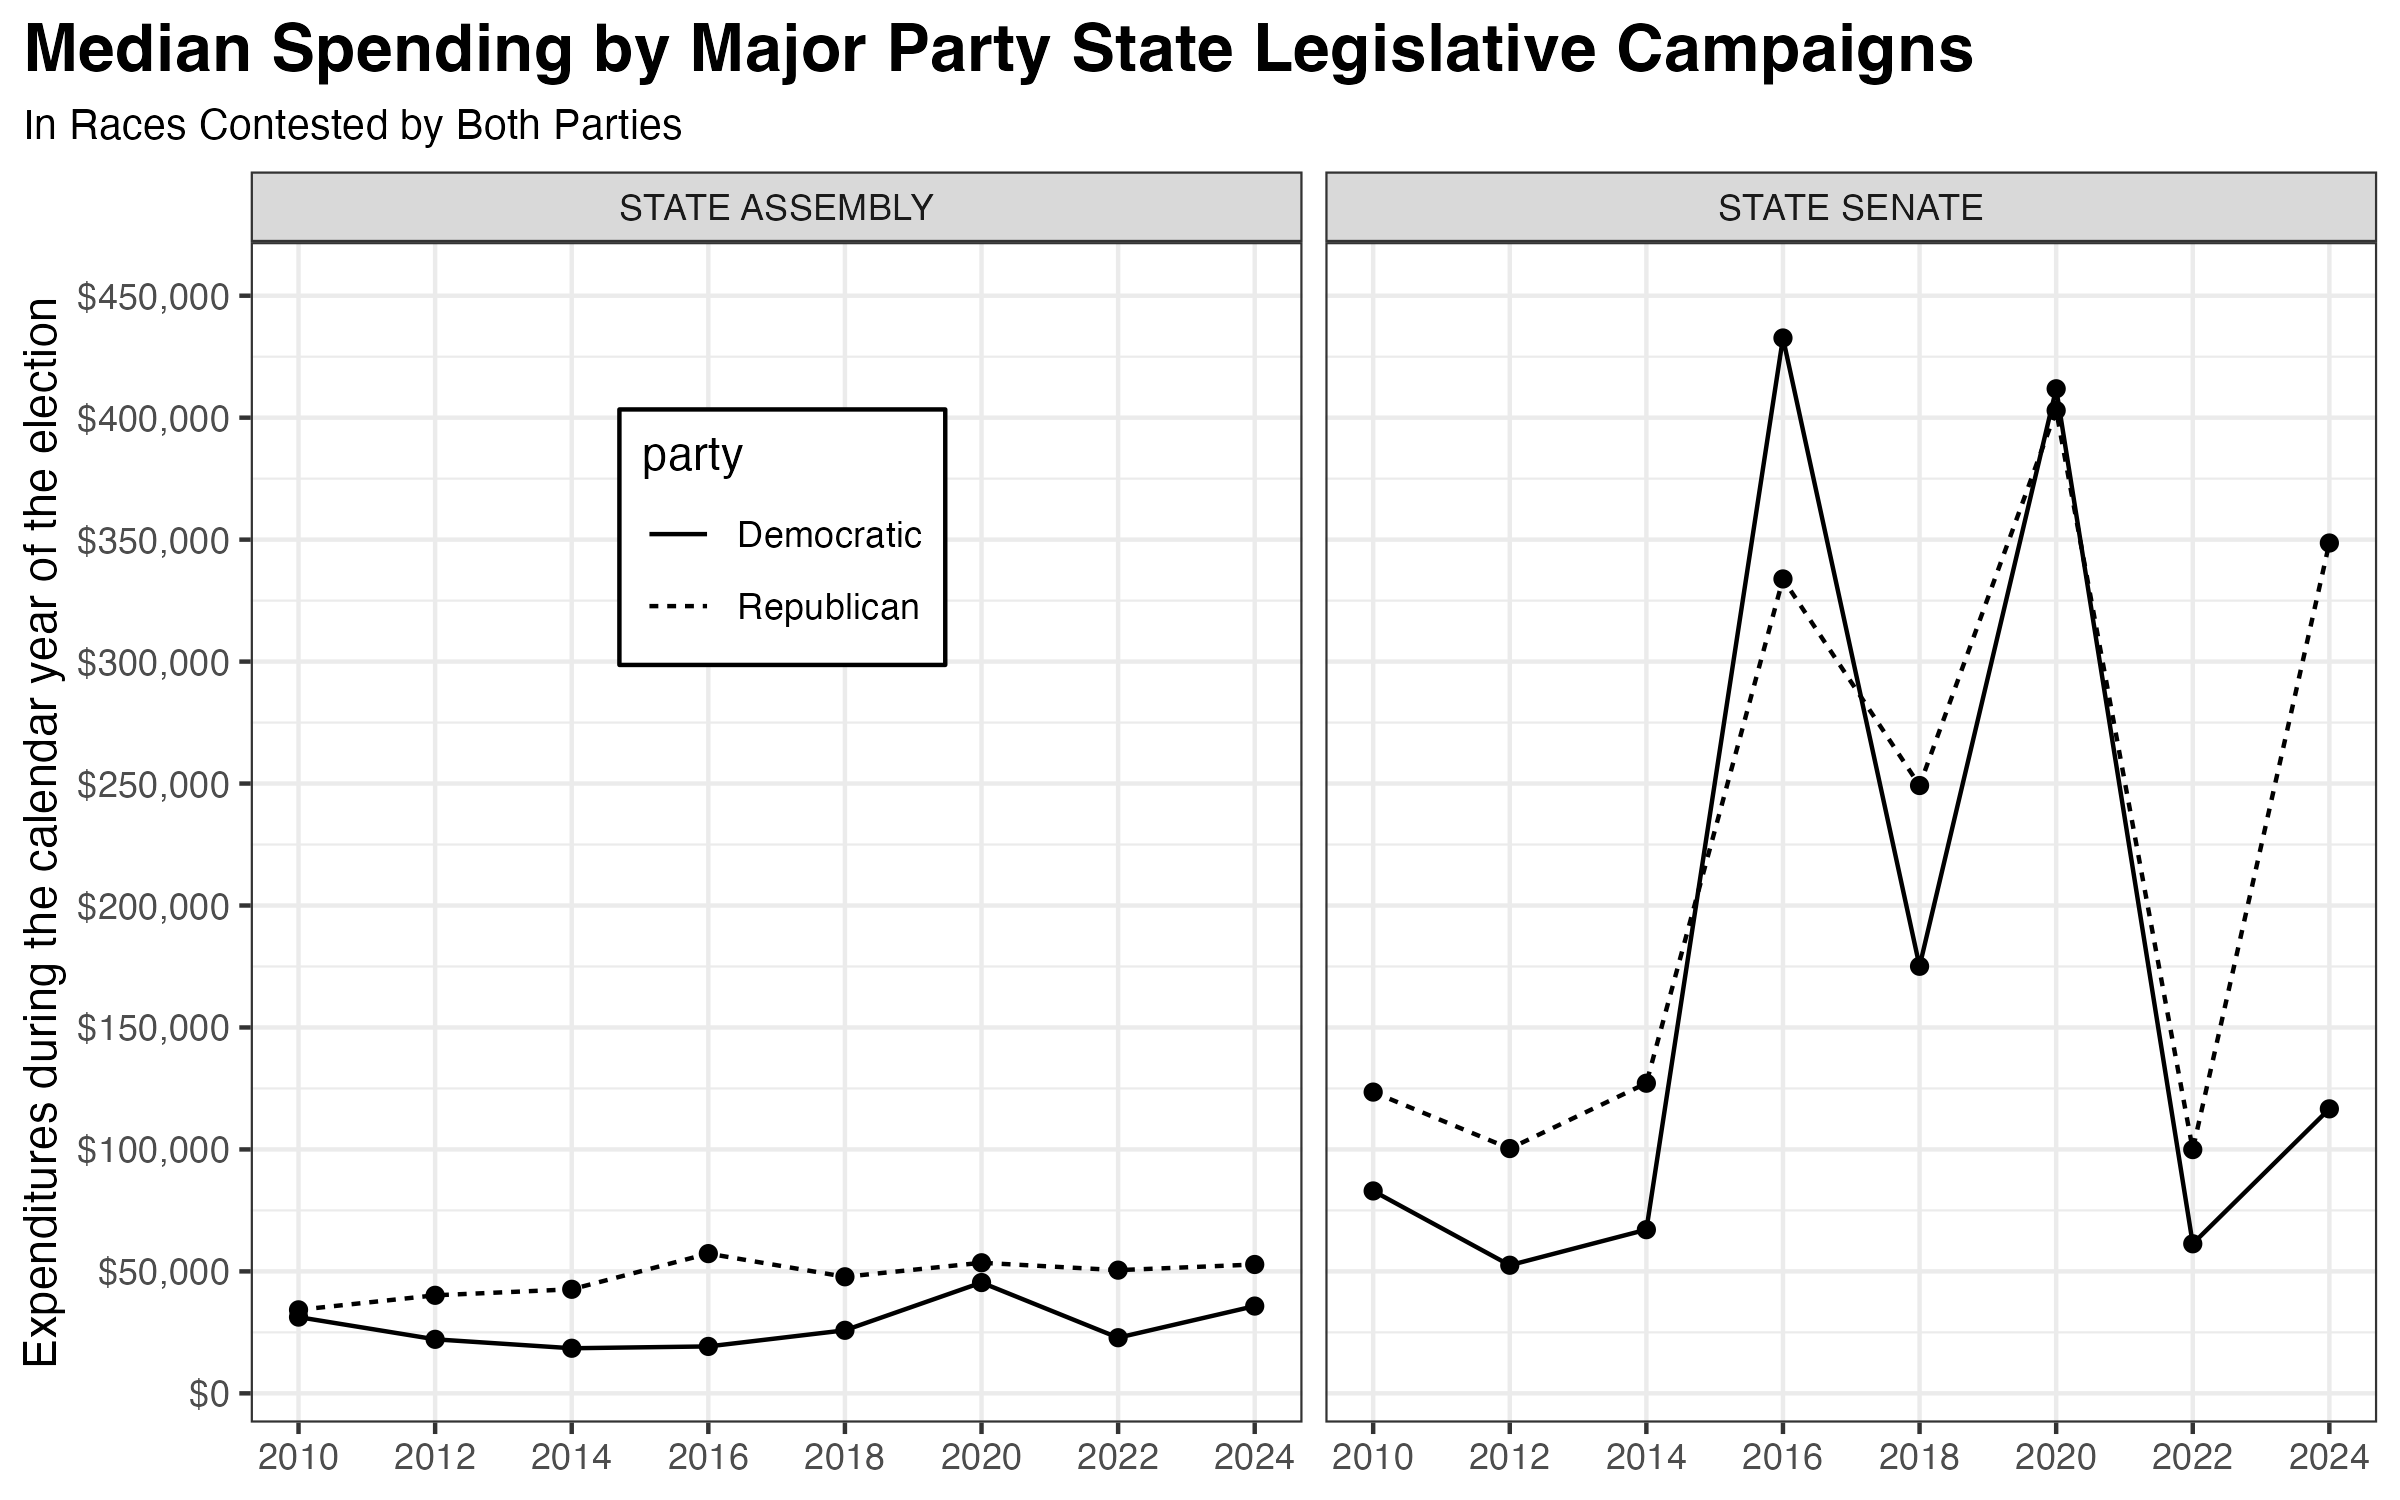
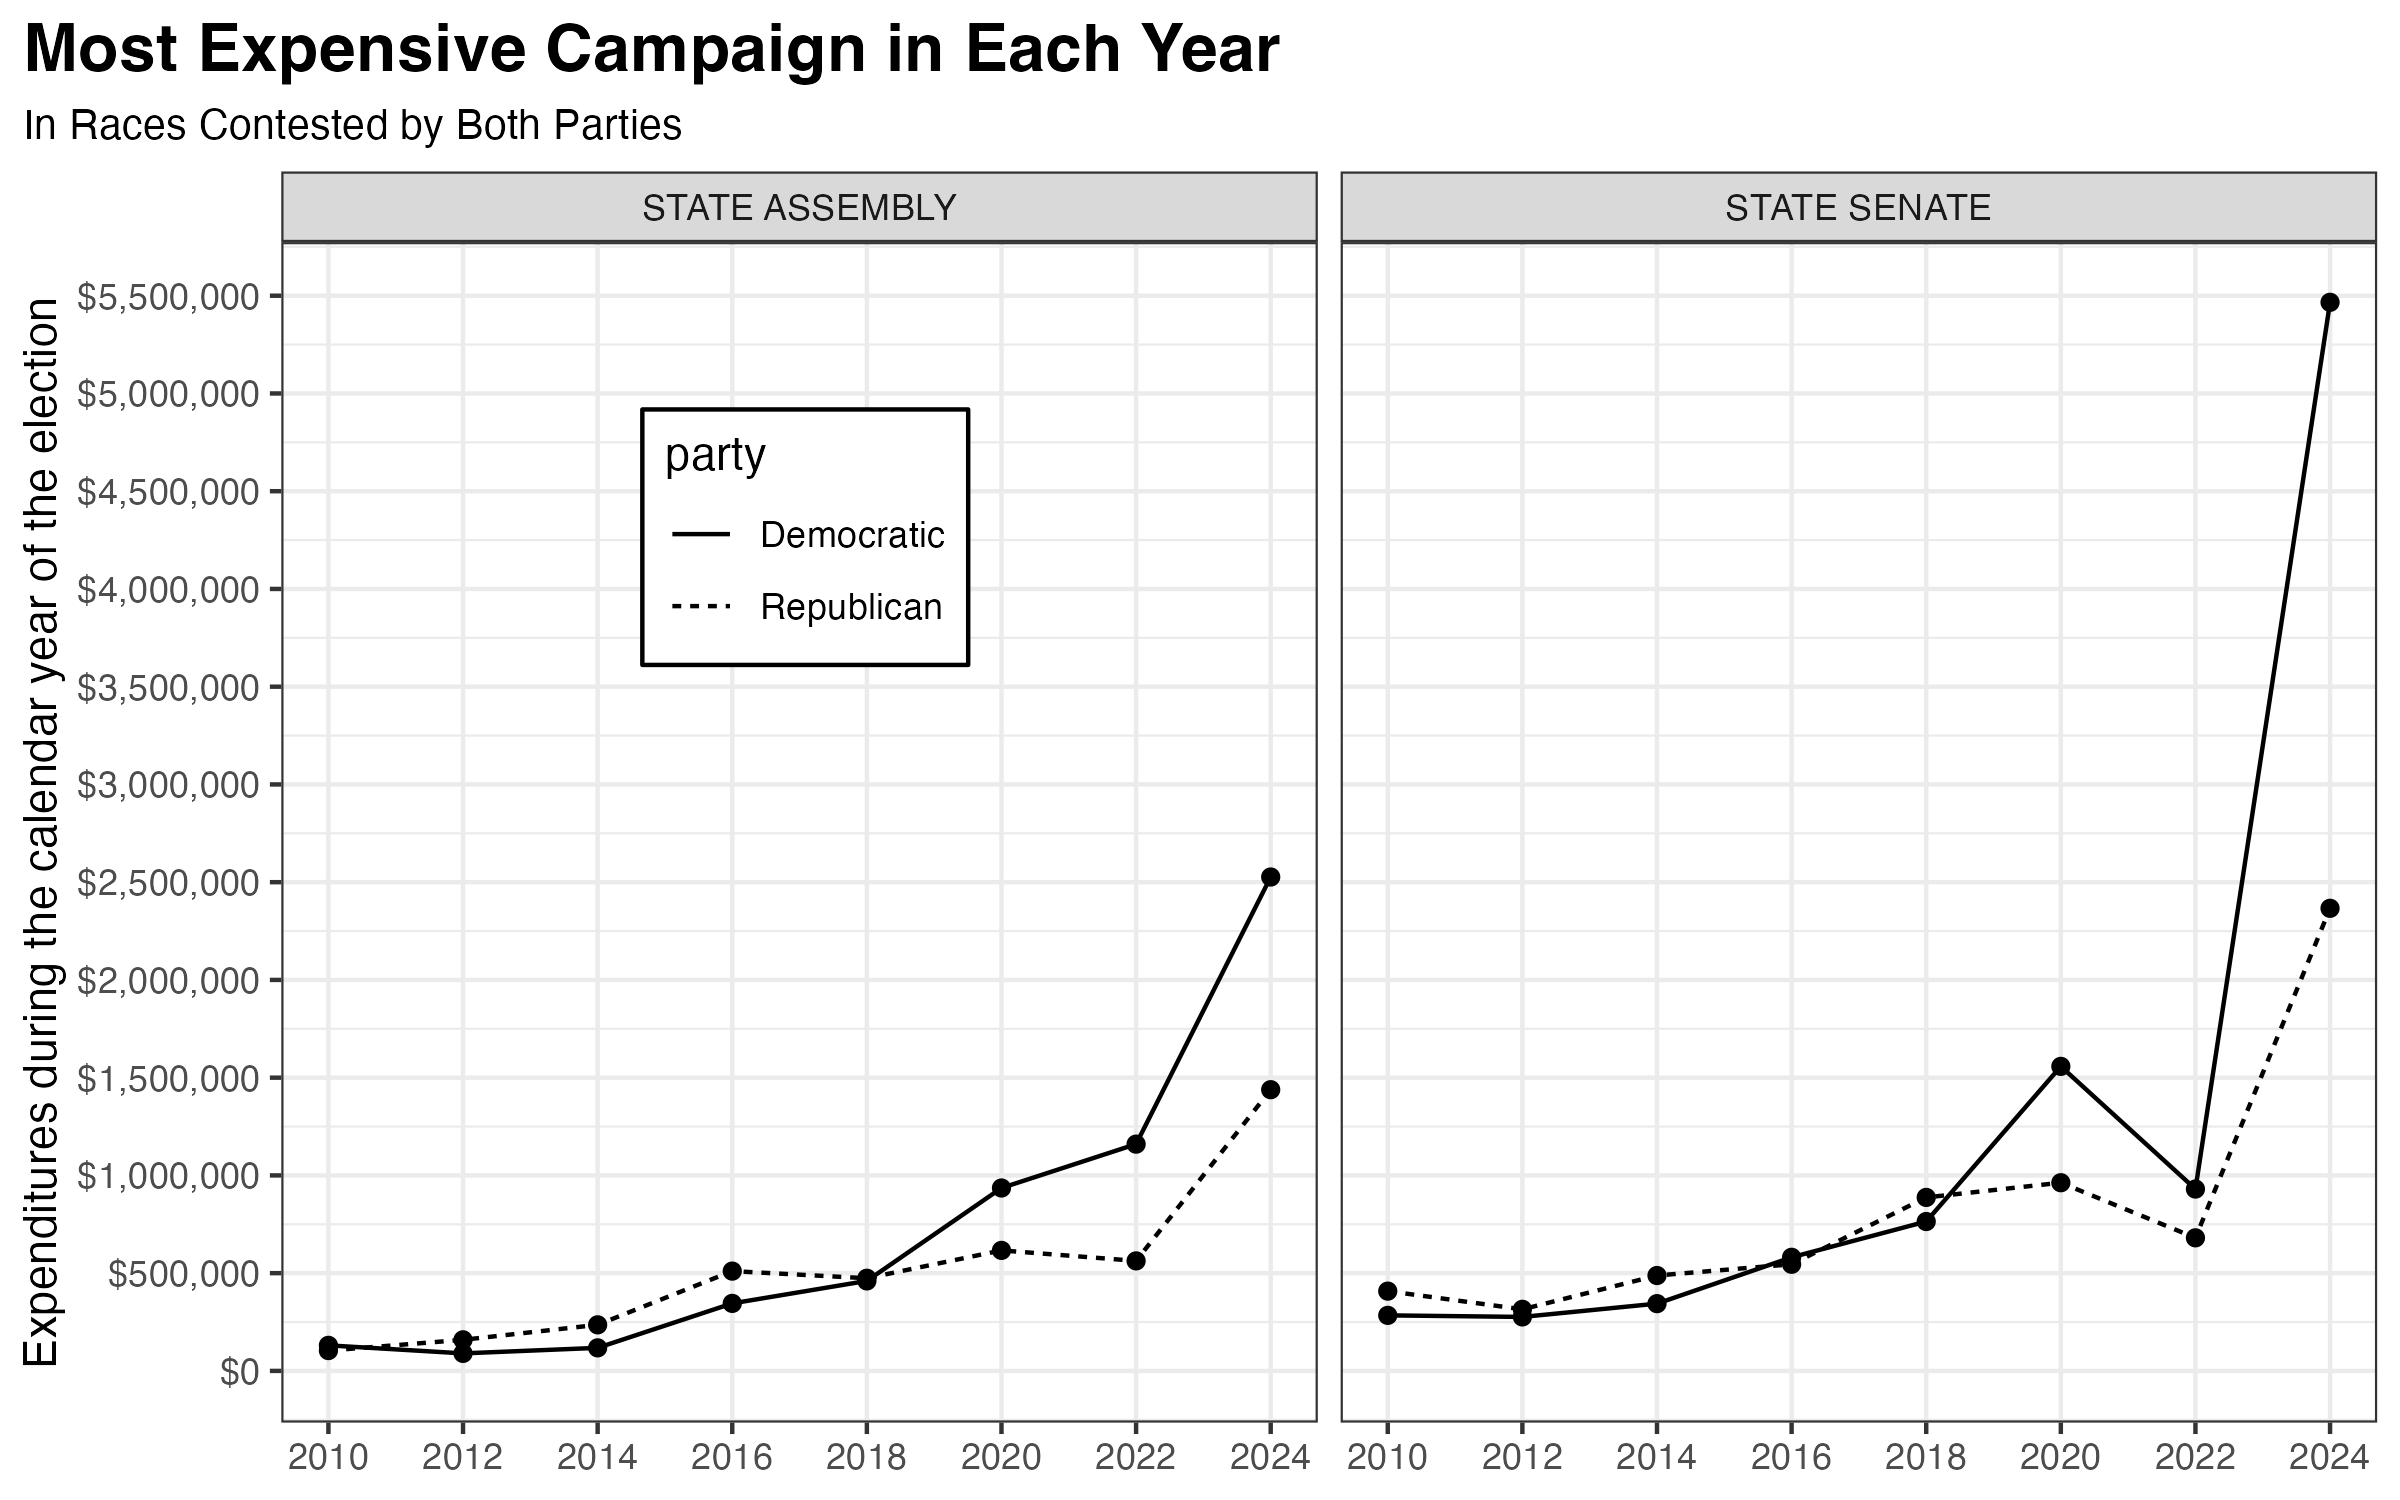
In most years, Republican spending has exceeded Democratic spending for the median candidate. But, since 2020, Democrats have consistently outspent Republicans in the biggest battleground races.
In 2024, the most expensive Assembly race for both parties was District 21, in the southern Milwaukee suburbs. Republican incumbent Jessie Rodriguez spent $1,439,000 en route to defeating the Democratic challenger David Marstellar whose campaign spent $2,526,000.
The Democratic advantage was even larger in the most expensive senate race that year. In the 8th district, Democratic winner Jodi Habush Sinykin outspent Republican Duey Strobel by more than $3 million.
Most campaign spending happens late in the campaign. In Wisconsin, after all, the partisan primary isn’t held until August; although, in many races the ultimate nominee is known long before then for each party.
Here are the historical July 1st fundraising statistics for those campaigns which ultimately did become their party’s nominee to the state legislature. In 2024, the median assembly campaign had still only raised about $10,000 dollars by July 1st and the median senate campaign about $60,000. These are the numbers against which to benchmark the fundraising data released tomorrow.
| Fundraising through July 1st by Major Party Nominees | ||||||||
| In Races Contested by a Candidate from Both Major Parties | ||||||||
| Assembly | Senate | |||||||
|---|---|---|---|---|---|---|---|---|
| campaigns1 | mean | median | max | campaigns | mean | median | max | |
| 2010 | 118 | $12,735 | $10,120 | $59,273 | 22 | $30,545 | $31,374 | $85,204 |
| 2012 | 136 | $11,605 | $9,926 | $62,114 | 20 | $21,567 | $11,632 | $79,135 |
| 2014 | 80 | $16,531 | $13,173 | $98,868 | 28 | $34,640 | $21,746 | $166,214 |
| 2016 | 86 | $16,107 | $10,873 | $70,175 | 14 | $55,624 | $53,220 | $105,909 |
| 2018 | 118 | $20,280 | $10,989 | $424,077 | 26 | $69,591 | $49,667 | $352,529 |
| 2020 | 152 | $15,604 | $9,932 | $132,183 | 20 | $53,263 | $44,487 | $187,413 |
| 2022 | 140 | $15,481 | $6,807 | $547,974 | 24 | $36,442 | $23,095 | $134,094 |
| 2024 | 154 | $25,345 | $9,902 | $638,893 | 22 | $89,199 | $59,980 | $270,159 |
| 1 Campaign finance records could not be located for a small number of campaigns, which are ommitted from this analysis | ||||||||
Most Expensive Races
The table below shows the 10 most expensive assembly races since 2010. The top 9 were in 2024 and the 10th was in 2022. Democrats outspent Republicans in each race, by amounts ranging from $138,000 to $2 million. Despite this spending, the Democratic candidate trailed the top-of-the-ticket (either Harris in 2024 or Evers in 2022) in all but 3 districts. Ultimately, Republicans won six of these races, despite being outspent by $9.5 million cumulatively.
| Top 10 Most Expensive Wisconsin State Assembly Races from 2010 – 2024 | ||||||||
| district | Election Results | Campaign Spending | ||||||
|---|---|---|---|---|---|---|---|---|
| Legis. Dem | Gov. or Pres Dem | Over/Under performance | total | Dem candidate | Rep candidate | Dem minus Rep | ||
| 2024 | 21 | 48.6% | 52.1% | −3.5 | $3.97M | $2.53M | $1.44M | +$1.09M |
| 2024 | 61 | 48.4% | 51.1% | −2.7 | $3.76M | $2.45M | $1.31M | +$1.14M |
| 2024 | 53 | 49.4% | 52.2% | −2.8 | $2.84M | $1.77M | $1.07M | +$693.82K |
| 2024 | 85 | 46.8% | 49.7% | −2.9 | $2.81M | $1.77M | $1.04M | +$723.94K |
| 2024 | 30 | 45.7% | 47.7% | −2.0 | $2.67M | $1.40M | $1.27M | +$137.94K |
| 2024 | 88 | 49.7% | 50.2% | −0.5 | $2.48M | $1.66M | $822.58K | +$833.93K |
| 2024 | 94 | 50.3% | 48.9% | +1.4 | $2.47M | $1.60M | $863.14K | +$739.80K |
| 2024 | 26 | 51.5% | 51.4% | +0.1 | $2.28M | $1.90M | $383.60K | +$1.51M |
| 2024 | 89 | 51.4% | 51.0% | +0.4 | $2.15M | $2.08M | $67.21K | +$2.01M |
| 2022 | 94 | 51.3% | 51.9% | −0.6 | $1.72M | $1.16M | $562.72K | +$597.30K |
Here are the 10 most expensive state senate races since 2010. Democrats had more success in these races than in the most expensive assembly costs, winning 6 of them.
| Top 10 Most Expensive Wisconsin State Senate Races from 2010 – 2024 | ||||||||
| district | Election Results | Campaign Spending | ||||||
|---|---|---|---|---|---|---|---|---|
| Legis. Dem | Gov. or Pres Dem | Over/Under performance | total | Dem candidate | Rep candidate | Dem minus Rep | ||
| 2024 | 8 | 50.7% | 51.2% | −0.5 | $7.83M | $5.47M | $2.37M | +$3.10M |
| 2024 | 14 | 51.1% | 50.8% | +0.3 | $4.62M | $3.00M | $1.63M | +$1.37M |
| 2024 | 30 | 52.5% | 51.8% | +0.7 | $4.18M | $3.21M | $971.77K | +$2.23M |
| 2020 | 30 | 45.3% | 45.9% | −0.6 | $2.24M | $1.45M | $791.34K | +$656.22K |
| 2020 | 8 | 45.7% | 49.9% | −4.2 | $2.24M | $1.27M | $962.65K | +$310.87K |
| 2020 | 32 | 50.3% | 53.1% | −2.8 | $2.16M | $1.56M | $601.70K | +$956.01K |
| 2020 | 24 | 43.5% | 43.8% | −0.2 | $1.87M | $1.15M | $723.62K | +$426.90K |
| 2024 | 18 | 53.3% | 54.4% | −1.1 | $1.72M | $1.00M | $716.25K | +$287.74K |
| 2018 | 17 | 45.9% | 50.6% | −4.7 | $1.46M | $573.79K | $887.45K | −$313.66K |
| 2022 | 31 | 50.5% | 50.9% | −0.4 | $1.40M | $930.33K | $470.54K | +$459.79K |
How Much Does Campaign Spending Help?
It’s clear that money doesn’t “buy elections” in any crude way. Candidates routinely win after being outspent by their opponent–a fact not limited to the Wisconsin legislature. Donald Trump, for instance, was outspent by $336 million in 2016 and $542 million in 2024, according to calculations by OpenSecrets.
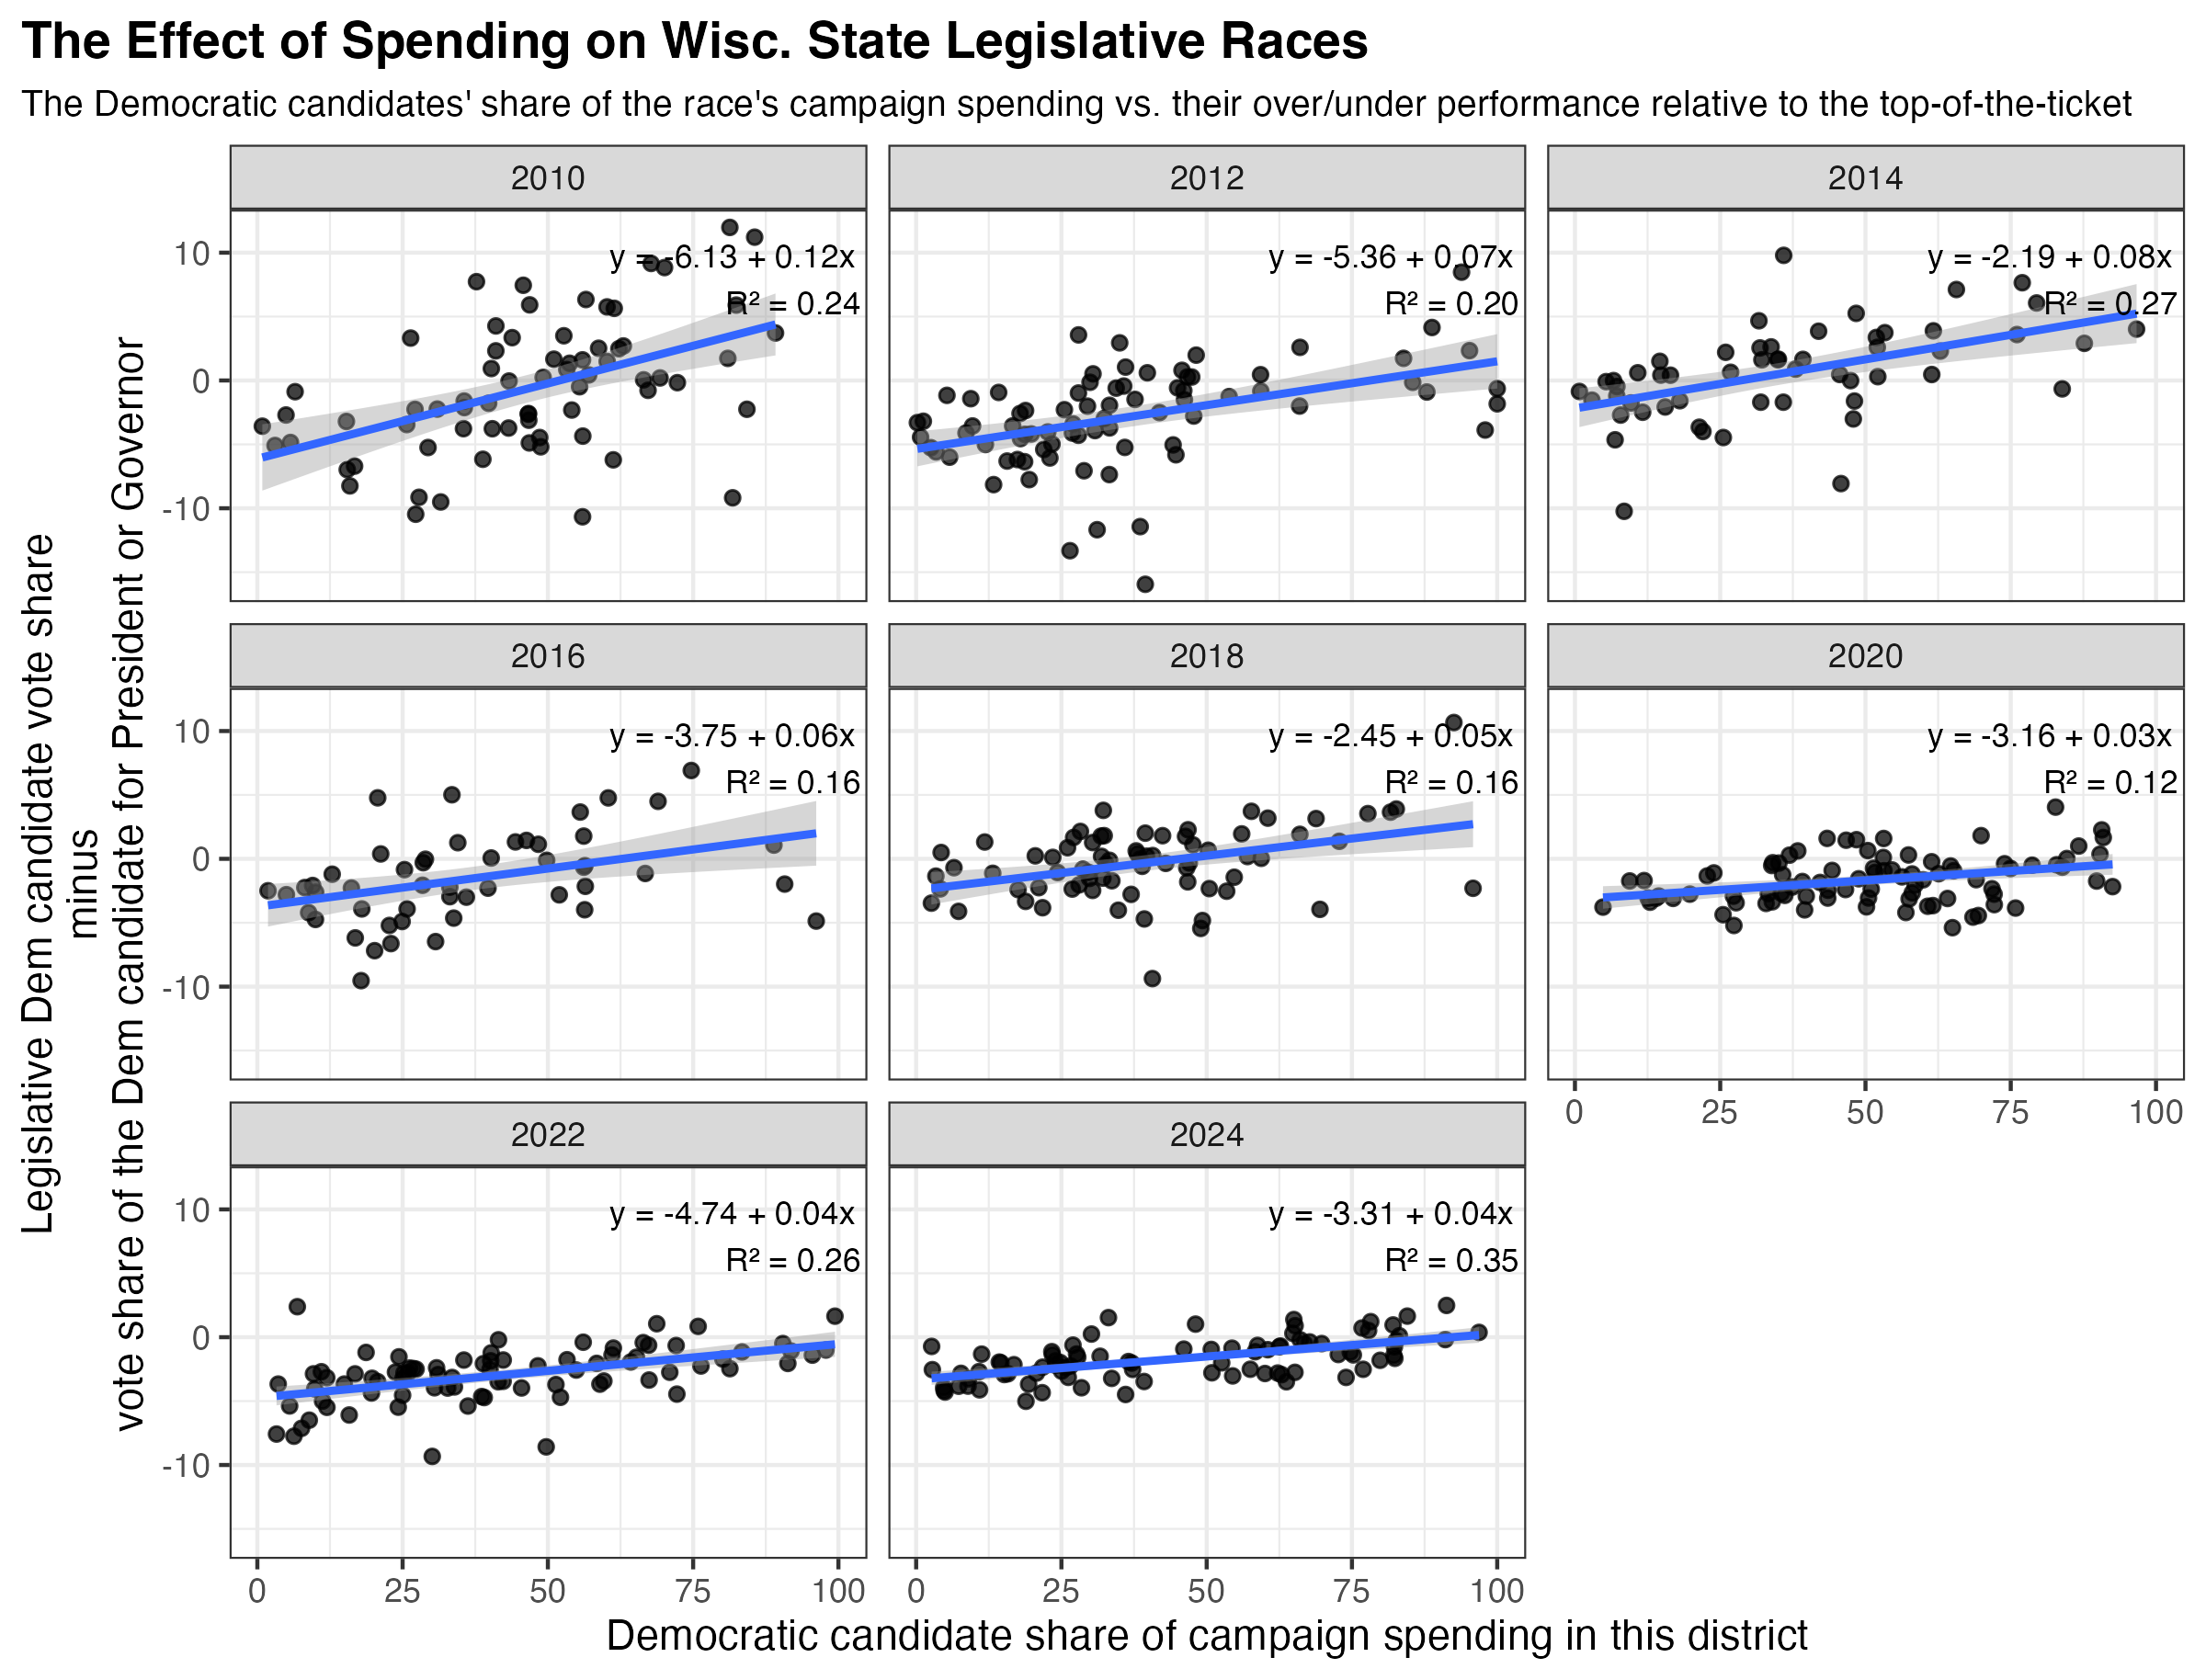
But, measured across hundreds of elections, the money does matter. In a simple measure of this, I regressed the share of total money spent by each campaign against the election’s difference from the top-of-the-ticket. The hypothesis is that in districts where the Democrat accounts for more of the spending, that Democrat will do better relative to the performance of the Democratic candidate for governor or president in that district.
This is, indeed, what we see, but the effect of money is small. In 2024, a 1% increase in the Democratic share of a campaign’s total spending was associated with a 0.04-point improvement in vote share, relative to Kamala Harris.
This small effect size has stayed about the same in recent elections, but it used to be higher. In 2010, a 1% increase in a party’s share of the spending was associated with a three-times larger increase in the vote. Money just doesn’t buy what it used to.