Tale of Three States: Minnesota’s Surprisingly Large Supervised Population
As noted here a few weeks ago, my forthcoming article comparing imprisonment trends in Indiana, Minnesota, and Wisconsin in now available on-line. Due to space constraints, I was unable to include in the article all of the interesting data I have collected on the three states. I’ll present some of that additional material in an occasional series of posts here.
Today, let’s take a look at the supervised populations of the three states. The supervised population is comprised of four subgroups: those in prisons, those in jails, those on probation, and those out on post-imprisonment supervised release (a status that goes by different names in different jurisdictions, but which I will call parole). As is well known, Minnesota has a remarkably low imprisonment rate (at least by U.S. standards), although all three states have experienced an imprisonment boom since the 1970s. Here are the imprisonment numbers, reflecting the number of prisoners per 100,000 state residents: ![]()
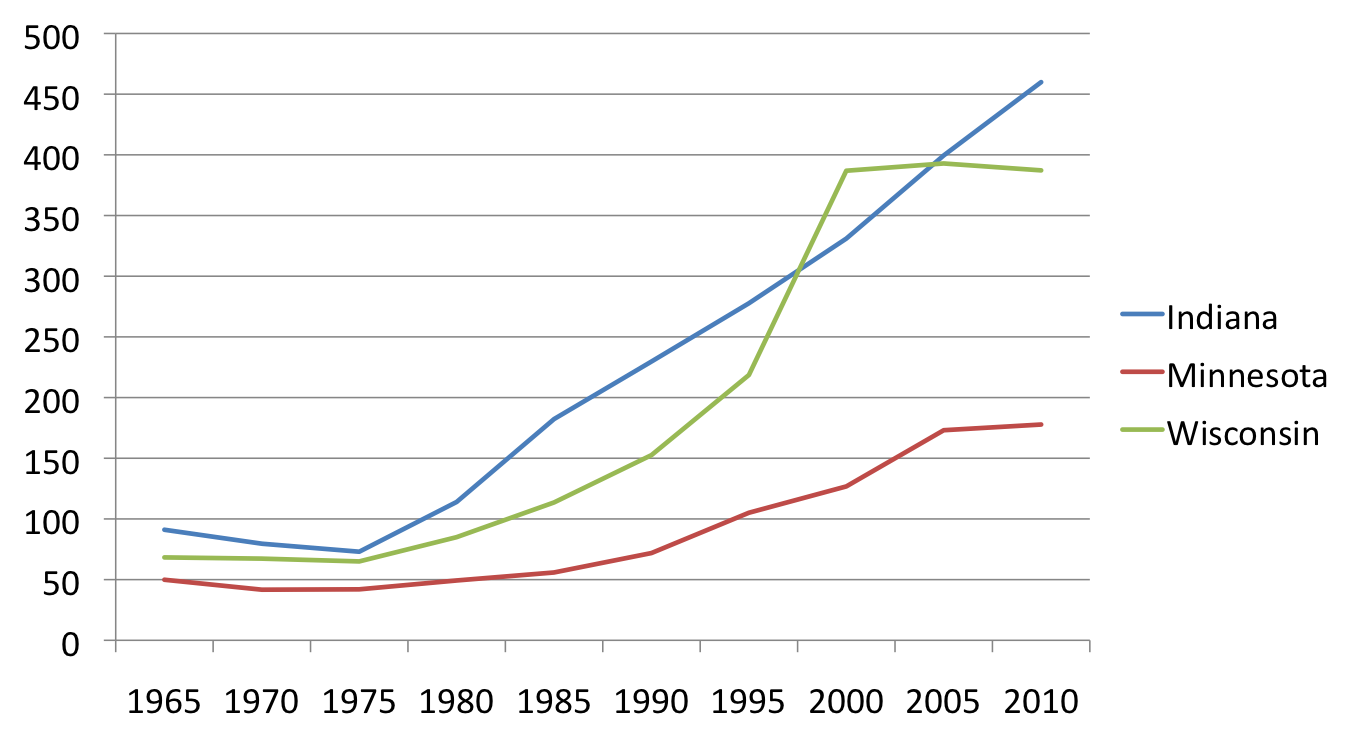
As the graph indicates, Minnesota has maintained a consistently lower imprisonment rate than the other two states since the mid-1960s. Indeed, the Minnesota advantage has tended to widen over time. By contrast, Indiana has generally had the highest imprisonment rate, although Wisconsin has been close at times, and even took the lead for a few years.
The story is quite different, however, if you consider the supervision numbers more broadly.