In Lubar Center Program, Chief Justice Karofsky Calls for Protecting Judges and the Justice System

Wisconsin Supreme Court Chief Justice Jill Karofsky had some friends in the audience when she took part in a “Get to Know” program in the Lubar Center of Marquette Law School on Wednesday, March 4, 2026. There was also someone else with her who sought no attention but was important: a security person. Indeed, to make a point, Karofsky noted the person’s presence.

The point concerned one of Karofsky’s main themes in her conversation with Derek Mosley, director of the Lubar Center for Public Policy Research and Civic Education: the need to increase protection of judges and court personnel at a time when polarization and extremely hateful views are making the possibility of violence more of a concern. In Wisconsin, a retired judge from Juneau County, John Roemer, was murdered in 2022 by a man whom Roemer had sentenced to six years in prison. Karofsky herself was the target of stalking that led to the conviction of a Racine man in January 2026. She said police officers have been stationed outside her house at times. And having security officers around Supreme Court justices has become routine.

“Political violence in the United States is going in the wrong direction,” Karofsky said. “It’s unacceptable.” She said she worries every day about the safety of judges, all other staff people who work in courts, and everyone who comes into contact with the justice system. Karofsky has been urging legislators to increase spending on security for courts. She said only four people are assigned now to work on safety for judges across Wisconsin. “We’re talking about hundreds and hundreds of judges,” she said.

She also said it was “completely unacceptable” for the president of the United States to attack justices and judges for doing their jobs. “That’s as un-American as you can get,” she said.

“There are judges and justices in this country who are accessing an incredible level of courage” to do their jobs, Karofsky said. “I think in many ways the judiciary is the bulwark for protecting our democracy.”

But when an audience member asked whether the personal risk meant attorneys shouldn’t aspire to be judges, Karofsky said the value and importance of the work can continue to make it worth being on the bench. More broadly, Karofsky said she encourages people to go to law school and become lawyers. “We need good lawyers in this country right now more than we ever have.”

Among her priorities, Karofsky is pushing to have a policy created for when judges and justices should recuse themselves from taking part in cases, including when one of the parties has been a donor to their campaigns. Karofsky said there is a rule petition in front of the Wisconsin Supreme Court currently. “We’re going to have a rule hearing . . . , and it is my hope and my desire and my plan to work together to craft a rule that is best for the people in this state” by the end of the current court term in June, she said.

Although the partisan split between conservatives and liberals on the Wisconsin high court has received great attention and shaped recent races for the court, Karofsky said the reality of the court’s work is generally much different. “We are far more likely” to have decisions that are 7 to 0 or 6 to 1 or 5 to 2 than 4 to 3, she said. She said the justices work together, socialize together, and take part in events and celebrations outside of work. The idea that the court is split 4 to 3 on everything, “that’s not the world I live in,” she said.

Although she said she does not like the high costs of recent Supreme Court races in Wisconsin, she said that the blame should be put on the U.S. Supreme Court’s 2010 decision known as Citizens United v. Federal Election Commission, which she characterized as opening the way for large donations by corporations and organizations. And she said she continues to support election of judges and justices, rather than appointment through a political process.

Asked by Mosley if she had a message for the law students in the audience, Karofsky said, “We are at a pivotal time in our democracy. And this is a time when the law can really be used as a vehicle to protect the rights of people in our communities, and it can be used as a vehicle to change things that aren’t working for people. I think you are learning how to be lawyers here, and graduating with your law degrees is going to give you incredible power and the incredible opportunity to make a difference in this world are time when we need it most.” Video of the one-hour conversation may be viewed by clicking here.

Video of the one-hour conversation may be viewed by clicking here.
Continue ReadingIn Lubar Center Program, Chief Justice Karofsky Calls for Protecting Judges and the Justice System

Wisconsin School Vaccination Rates: an interactive map

The Washington Post recently published an interactive article which shared kindergarten immunization data collected from public schools in 34 states. The data shows plunging vaccine rates across the country.

I was shocked by how low some of the numbers were, and I wanted to understand how they compared to school numbers as a whole. It’s possible than some kindergartners haven’t yet received all of the vaccination they will receive.

For example, Neeskara Elementary had an MMR vaccination rate of 12% and an overall compliance rate of 7%. Fortunately, the schoolwide numbers for Neeskara, according to WI DHS, are an MMR rate of 60% and an overall rate of 50%. Given that herd immunity against measles requires “about 95% of a population to be vaccinated,” Neeskara is still disturbingly low, but there is a world of difference between 7% and 60%. Most of the children attending Neeskara have received this vaccine–just not most kindergartners at the beginning of the year.

At MacDowell Montessori, kindergartners reported an MMR rate of 26% and an overall rate of 26%. The schoolwide numbers are 92% for MMR and 62% overall. Likewise, kindergartners at Hayes Bilingual School were at 33% for MMR and 27% overall. The schoolwide numbers are 76% MMR and 61% overall.

More details from WI DHS

Besides listing the MMR and overall vaccine compliance rates for each school, the WI DHS data also provides information about why students aren’t vaccine compliant. In most Milwaukee schools with low vaccination rates, the cause isn’t that parents have filled out vaccine waivers. According to the DHS statistics, it’s more common for students who are out-of-compliance to be classified as “in process,” “behind schedule,” or just “no record” rather than having explicitly opted-out of vaccinations by completing a waiver.

At Neeskara, for example, 20% are “behind schedule” and 28% have “no record.” Scarcely any students actually have a vaccine waiver on file. Similarly, Riverside High School has truly dismal 12% vaccine compliance rate. Eighty percent of its students are “behind schedule” and 7% are “no record.” Few, if any, have waived vaccine requirements.

Schools where many students have waived vaccines are uncommon, but they do exist. At Tamarack Waldorf, on Milwaukee’s East Side, 67% of students have met minimum vaccination requirements. Sixteen percent have “waived all vaccines” and 24% have completed a “personal conviction waiver.” The distinction between these classifications is unclear to me. So is the distinction between students who are listed as “in progress” vs. “behind schedule.”

In general, the quality of the school-level data provided by WI DHS raises as many questions as it answers. At North Division, for instance, 65% of students were classified as “met minimum requirements” in 2024, with just 5% having “no record.” The next year, in 2025, fewer than 5% “met minimum requirements” and 80% had “no record.” Absent some extraordinary turnover over students between those two years, I struggle to imagine how this could be possible. More likely: the data was reported incorrectly in one or both of the years.

Many schools also fail to submit their reports every year. In 2025, 377 schools statewide (13% of the total) failed to submit a report. But 197 of those schools had submitted a report the previous year, in 2024.

The current self-reported school vaccination data collected by WI DHS is incomplete and inconsistent where available. The failure to report this data accurately (or at all) poses real challenges to public health efforts. A health department might want to plan its vaccine outreach campaigns around those schools where children are unvaccinated, not because their parents have opted them out of immunizations, but simply because those children are apparently not receiving medical care. Better data would improve this kind of targeting.

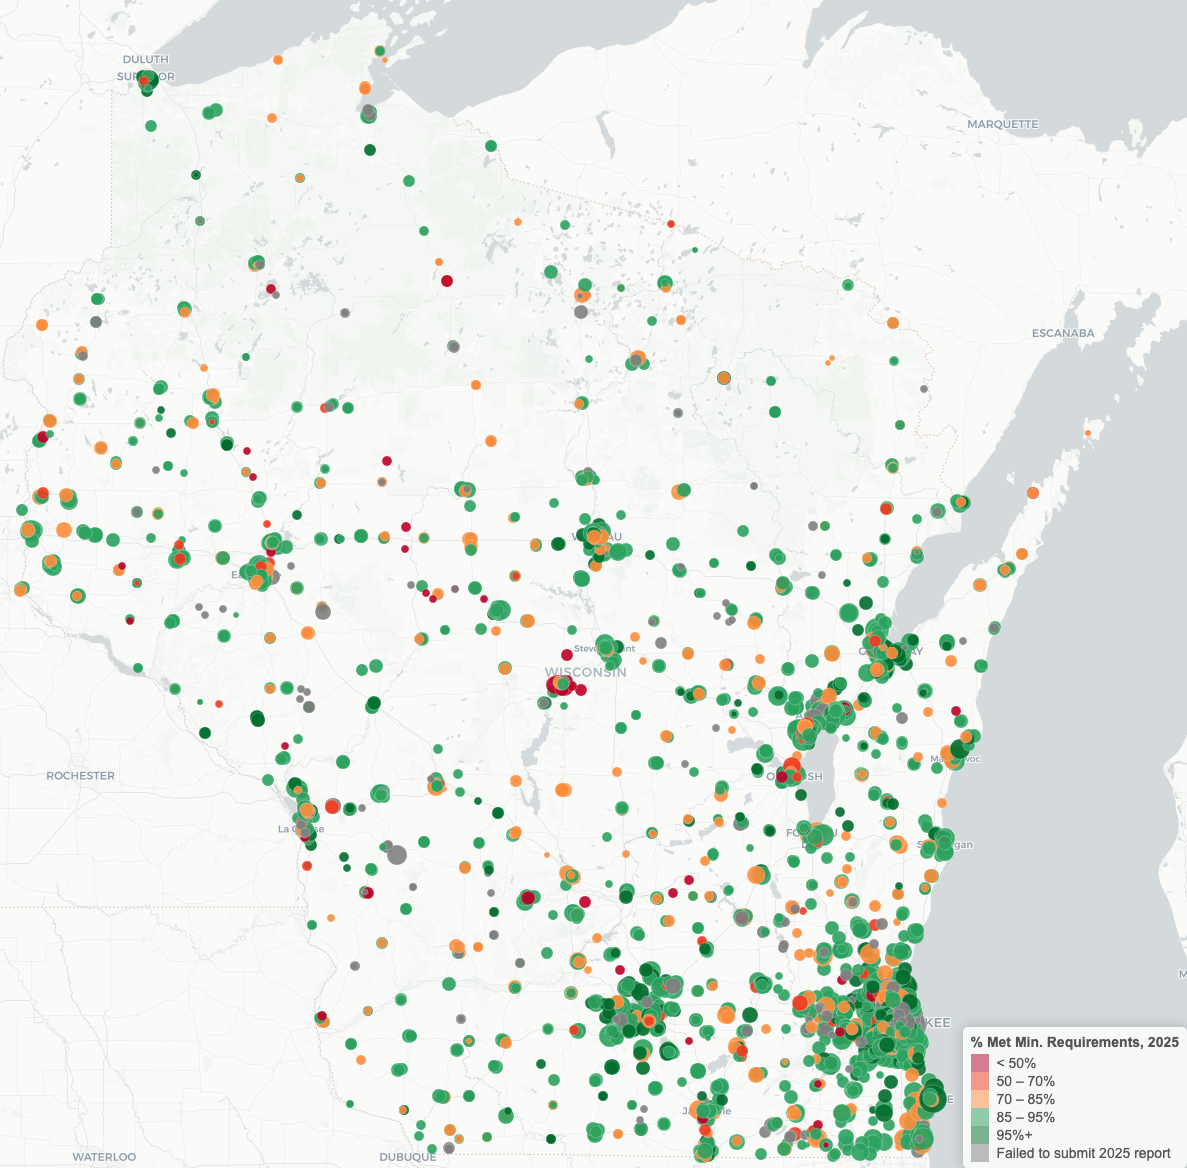
I’ve built an interactive map showing the available data for every school in the state. Click the image below to open it. Mousing over each school will reveal its name and 2025 overall vaccine compliance rate. Click the school to display a table showing more detailed vaccine statistics for each year from 2022 through 2025. If the school failed to submit a report in any of those years, all values for the year will be NA.

Updated 2/25 to correctly identify that the Washington Post story uses kindergarten vaccination rates, not schoolwide rates.

Continue ReadingWisconsin School Vaccination Rates: an interactive map

Where Americans Choose to Move and Where They Leave: Domestic Migration from 2020 to 2024

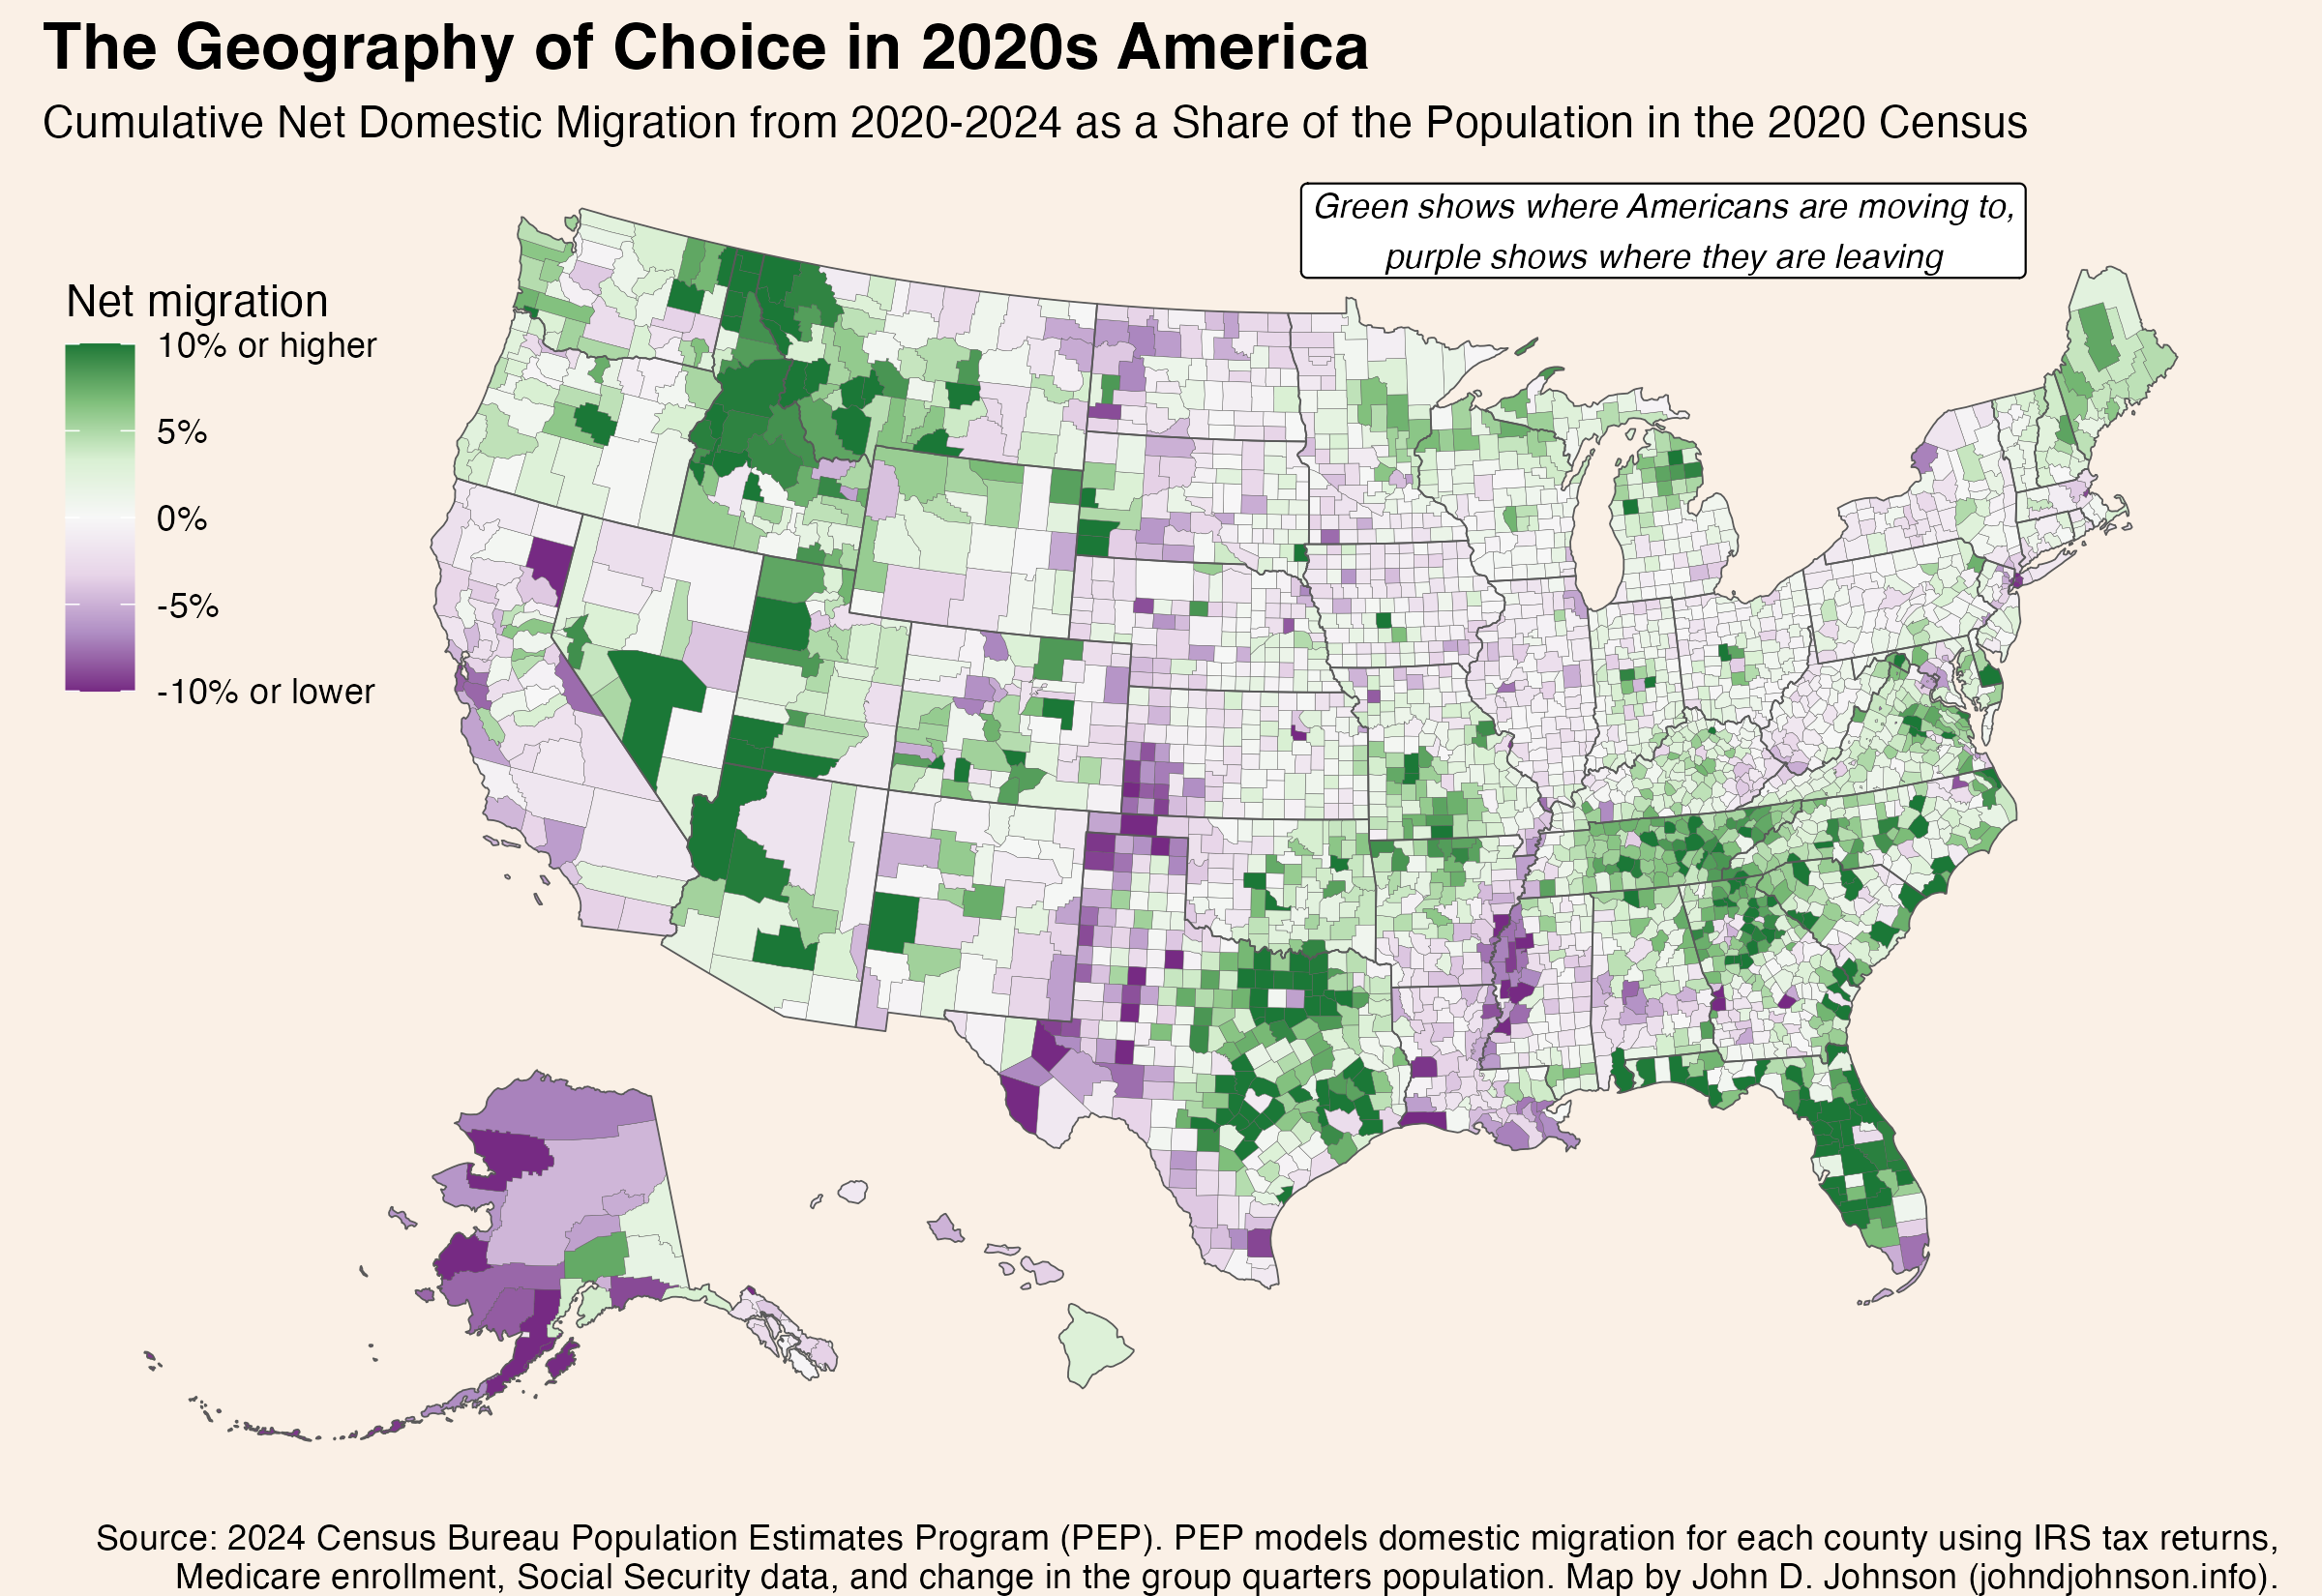
Patterns of domestic migration—where people who already live in America choose to move—reveals a lot about where people do or don’t want to live. Or, framed differently, where they can and can’t afford to. This map shows the cumulative domestic migration of each US county, from 2020 to 2024.

The darkest green color shows places where the (net) number of people who’ve moved in since 2020 is equal to 10% or more of the population in 2020. The darkest purple color shows the reverse. In those counties the net number of people who’ve moved out is equal to 10% of the 2020 population. This only includes people who moved from one place in the United States to another, not people who moved into or out of the country.

Because this map shows net migration, a place where a roughly equal number of people move in and out—like a college town—won’t feature prominently.

map showing US counties shaded corresponding to their net domestic migration from 2020 to 2024

There are six times as many dark green counties as dark purple ones. A few counties are experiencing intense in-migration, while a lot of counties are seeing a small out-migration.

Some of the patterns seem to follow state boundaries, but more commonly they reflect urban agglomerations or ecological regions.

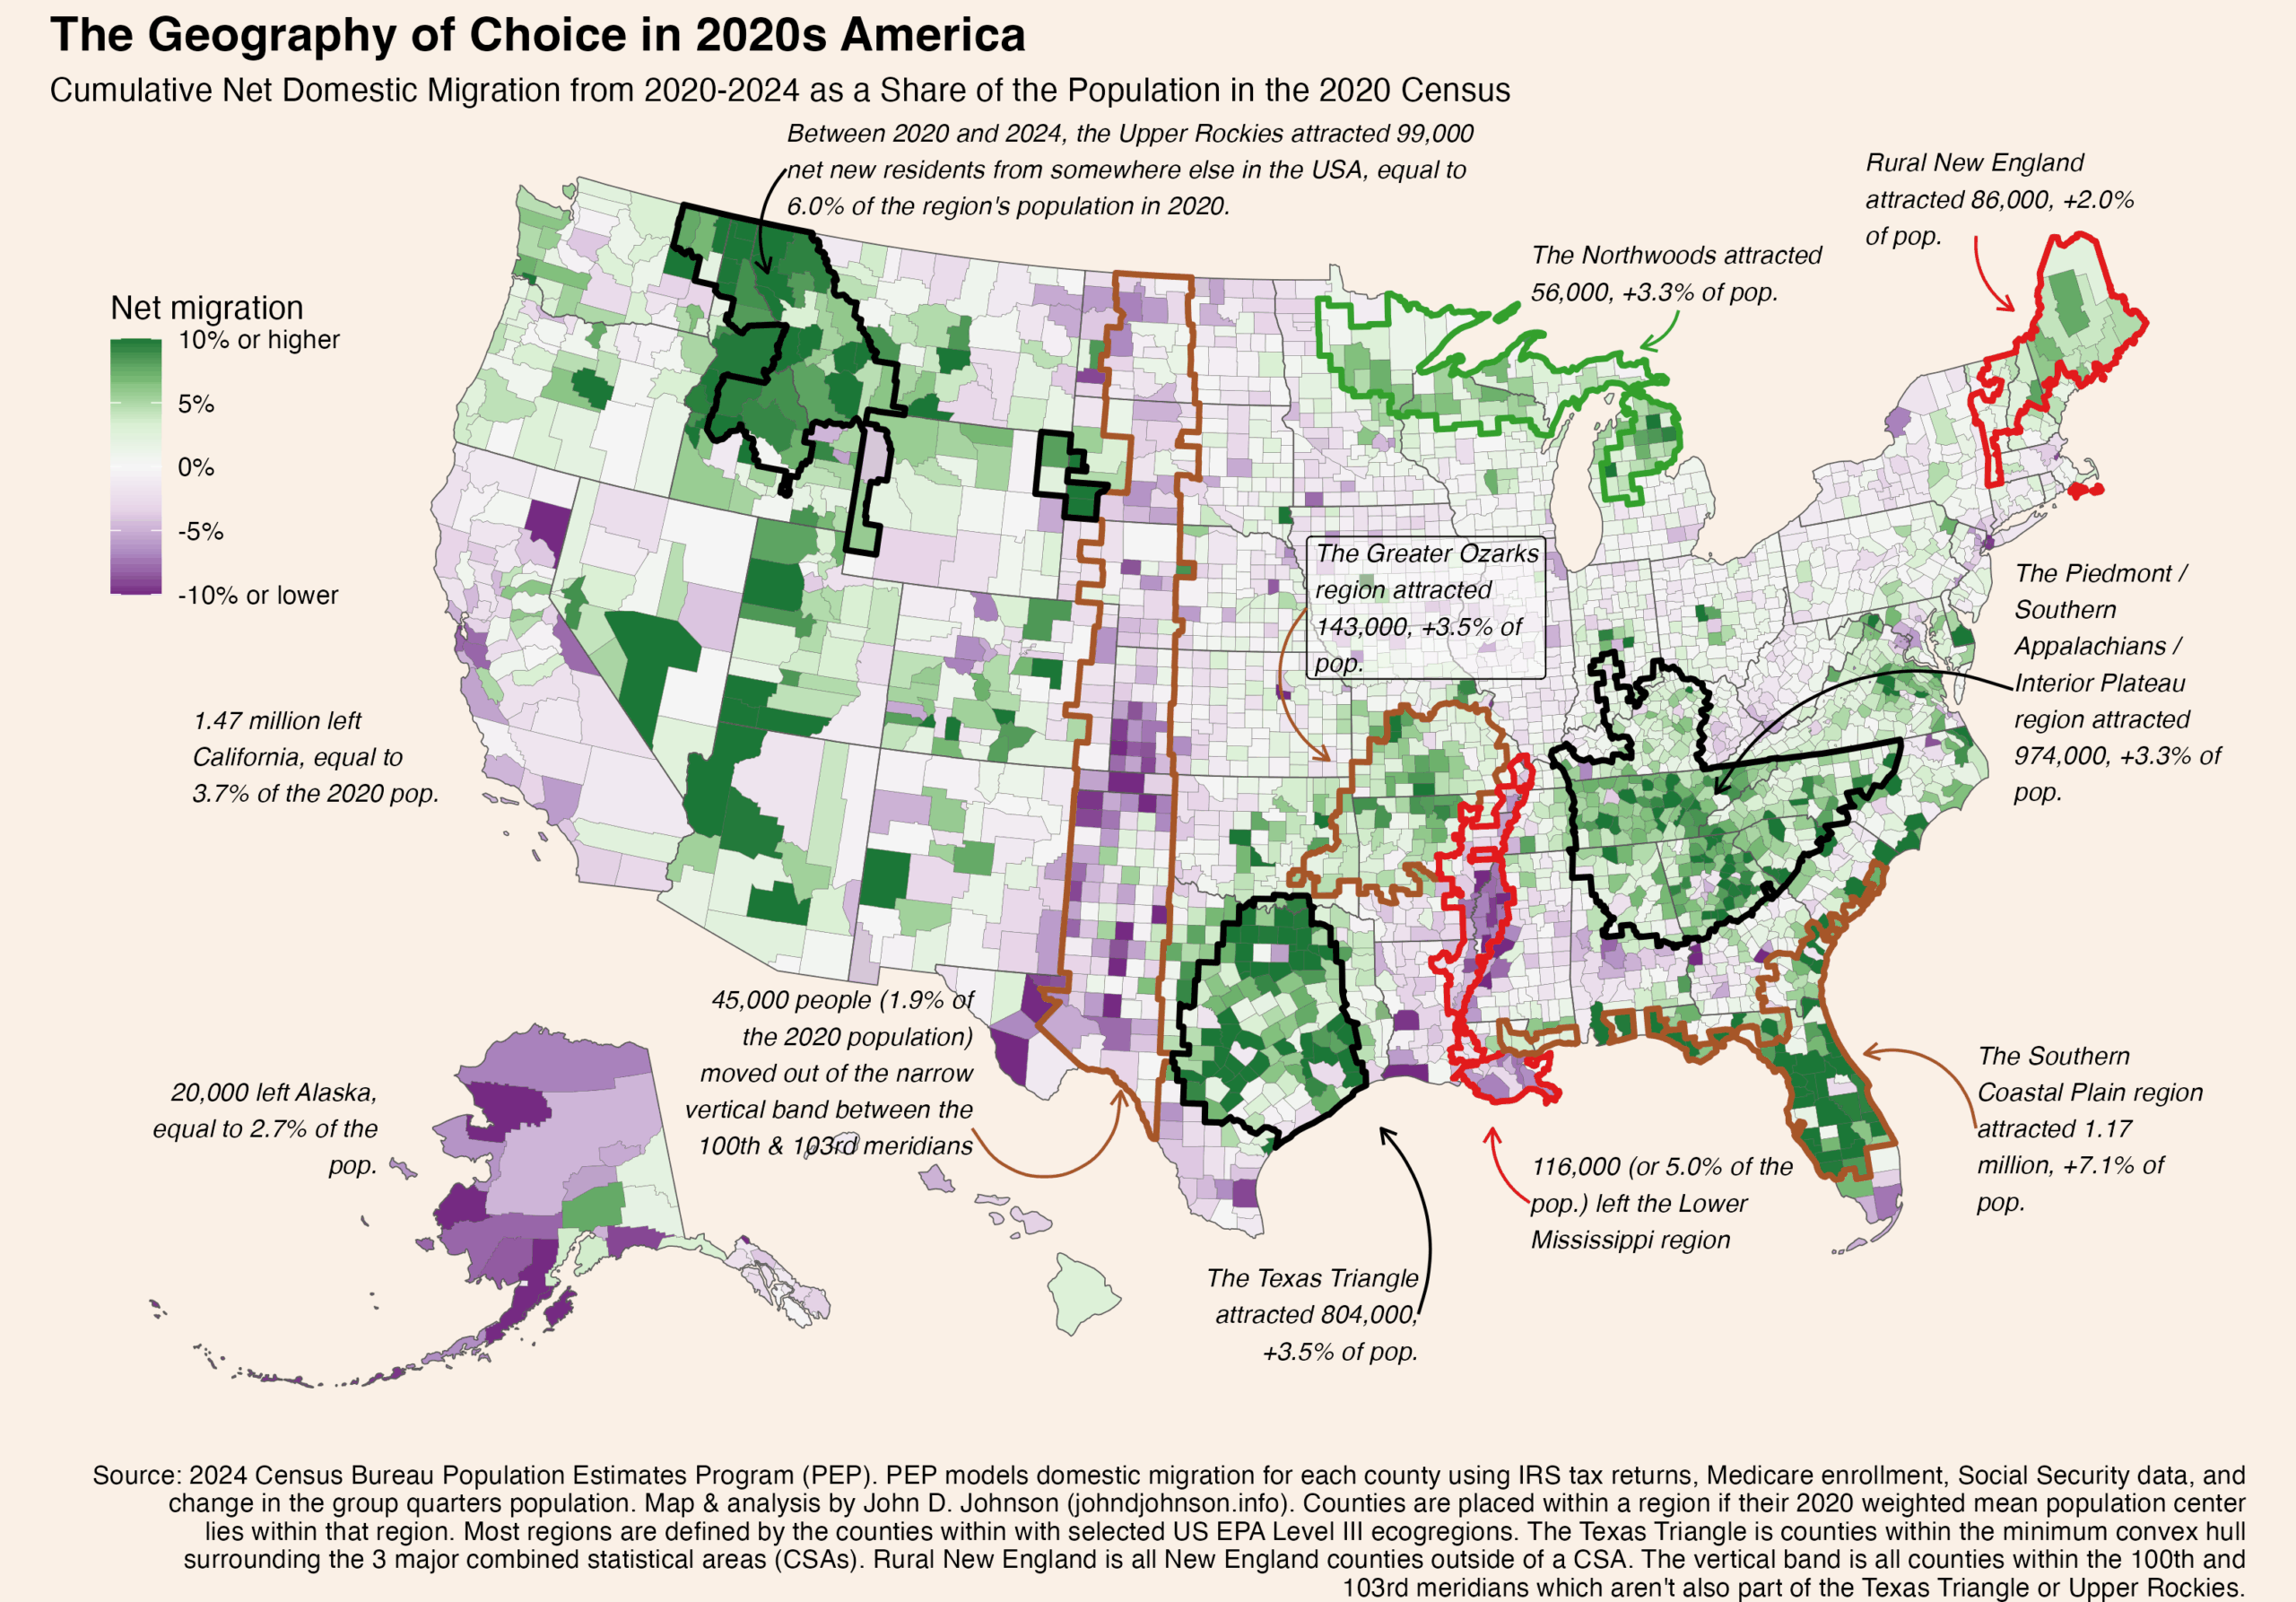
In fact, I was surprised by the extent to which certain ecological regions correspond to the patterns on this map. The next version of the map shows a few of the patterns that most stood out to me. I highlighted certain regions, like the Ozarks, by identifying the counties included in specific EPA Level III ecoregions. (Follow that link to see official maps of Level I, II, III, and IV ecoregions. They are fascinating).

I placed a county into one of these regions if its mean population weighted center in the 2020 census fell inside the region.

map, with regions outlined and annotated, showing US counties shaded corresponding to their net domestic migration from 2020 to 2024

Rural Northern Tier Winners

Three pockets of growth dot the northern perimeter of the lower 48. Each is in a very different rural area.

The Upper Rockies

These are the 41 counties lying mostly inside of the following ecoregions: Northern Rockies, Canadian Rockies, Middle Rockies, and Idaho Batholith. Mostly, these are in Idaho and western Montana, but some stretch into northeastern Washington and a few disconnected pockets stretch all the way to extreme western South Dakota. Since 2020, these counties have gained about 99,000 net new residents who previously lived elsewhere in the country. That’s equal to 6.0% of the region’s total population in 2020.

The Northwoods

The “Laurentian Mixed Forest Province” (as it is also known) is a single ecoregion stretching from Minnesota’s iron range, through northern Wisconsin, across the entire Upper Peninsula, and into the northern half of Michigan’s lower peninsula. This whole area is scarcely populated: Duluth is the largest city. But since 2020, 56,000 more people have moved in than out of these 65 counties, equal to 3.3% of the population in the last census. This sets the Northwoods apart from pretty much everywhere else in the rural Midwest.

Rural New England

I’m using “rural” in an expansive sense. These are the 46 counties in New England’s six counties which lie outside of a combined statistical area. Since 2020, they’ve added 86,000 residents thanks to domestic migration, equal to 2.0% of their starting population. Notice that the New England counties located inside CSAs have fared less well. Nor have migrants flocked to nearby rural upstate New York.

Perhaps rural New England, the Northwoods of the Upper Midwest, and the northern Rockies are all benefiting from increased access to remote work in recent years. The absolute numbers of people moving to these regions are small, compared with some of the other regions we’ll discuss shortly. But because their populations were so low to begin with, the influx of new residents is enough to make a big different proportionally.

The Sunbelt is Still Hot

The biggest hotspots for domestic movers are in the American South. Many of these cross state lines in ways that follow ecoregions.

The Piedmont / Southern Appalachia

One such region covers portions of the Carolinas, Georgia, Alabama, Kentucky, and nearly all of Tennessee. The sprawling area (340 counties) basically corresponds to the ecoregion comprising Appalachia south of Virginia (the Blue Ridge Mountains, Southwestern Appalachians, Ridge and Valley) along with the plateaus to their east (the Piedmont) and west (the Interior Plateau). 974,000 more Americans moved into this region than out of it from 2020 to 2024, equal to 3.3% of the 2020 population.

Notice that I do make an artificial alteration to the ecoregion boundaries: cutting several off at the southern border of Virginia. Virginia displays its own pattern of migration growth, concentrated on the DC metro.

The Southern Coastal Plain

Florida’s appeal to domestic movers is legendary, and that’s most of what is happening in this region. But it turns out the counties attracting the most growth correspond even more closely to the boundaries of the Southern Coastal Plain ecoregion than they do to the state lines. Notice how the southern tip of Florida (a different ecoregion) had negative net migration, while Florida’s growth regions extend seamlessly along the Georgia and South Carolina coasts which are part of the same ecoregion. The 76 counties in the Southern Coastal Plain region added 1.17 million residents, equal to 7.1% of the 2020 population.

The Texas Triangle

The Texas Triangle isn’t any kind of official region, so you can define it different ways. I drew a concave hull around the combined statistical areas for Dallas, Houston, and San Antonio. Basically, it contains the biggest metros in Texas and everything in between them. All told, these 103 counties gained 804,000 net domestic movers, equal to 3.5% of the population.

The Greater Ozarks

This one surprised me the most. As a kid, I often visited my grandparents in Yellville, Arkansas, deep in the Ozark Mountains. The whole region seemed beautiful but sleepy. Evidently, that has changed. The Ozarks, and their surrounding ecoregions, grew considerably. This region of growth extends across several states. It includes the Ozark Highlands, Boston Mountains, Arkansas Valley, and Ouachita Mountains. From 2020 to 2024, these 92 counties gained 143,000 people from net domestic migration, worth 3.5% of the 2020 population.

Some Losers

Most of the places with more out-movers than in-movers only lost a very small fraction of their population. But a few regions stand out with more serious losses.

The Lower Mississippi

The Mississippi Alluvial Plain extends from the river’s confluence with the Ohio in southern Illinois all the way to its mouth in the Gulf of Mexico. Nearly all of these 58 counties lose more movers than they gain. In total, the region lost 116,000 people, or 5.0% of its population to net domestic migration from 2020 to 2024. Losses were even more severe (proportionally speaking) in the core of the region, the Mississippi Delta.

The 100th Meridian West

The 100th Meridian is notorious on the Great Plains as the location beyond which, it is often said, growing crops becomes impractical without irrigation. While making this map, I was struck by the vertical streak of population loss corresponding to the area immediately west of this line. The vertical region I’ve drawn is simply those counties lying mostly within the 100th and 103rd meridians (and outside of the Texas Triangle or Upper Rockies). This is basically the width of Oklahoma panhandle, extended north  to Canada and south to Mexico. Collectively, the region’s 166 scarcely populated counties have only lost 45,000 people to domestic migration (1.9% of the population), but it includes counties with losses of 10% or more.

California

Finally, any discussion of net migration has to mention the county’s most populous state: California. From 2020 to 2024, 1.47 million more people moved from California to elsewhere in the United States than from a different state into California. That outflow is equal to 3.7% of the state’s 2020 population.

Continue ReadingWhere Americans Choose to Move and Where They Leave: Domestic Migration from 2020 to 2024