- Marquette Law School Poll finds most Americans are somewhat skeptical of trusting government, while confidence in institutions more generally varies widely
Also:
- Partisans shift sharply in trust in government, depending on which party is in the White House
- Doctors, the military, the police, and local schools top the confidence charts
- Congress, AI companies, and Facebook get the lowest confidence ratings
- Those who distrust the federal government also lack confidence in many other American institutions
- Democrats lead generic congressional November ballot by 2 points with registered voters but by 8 points with likely voters
MILWAUKEE — As America reaches the 250th anniversary of the signing of the Declaration of Independence, polling shows that trust in the federal government to do what is right all or most of the time has declined over the long term. Furthermore, while overall levels of trust in the government have not changed much in recent years, partisanship has increasingly shaped levels of confidence. More generally, satisfaction with many institutions, both governmental and nongovernmental, varies widely.
A new Marquette Law School Poll national survey finds that 18% of American adults say they trust the federal government to do what is right all or most of the time, while 19% say they can never trust the government. The remainder, 63%, trust the government only some of the time.
The Marquette Law survey was conducted June 9-15, 2026, interviewing 1,514 adults nationwide, with a margin of error of +/-2.7 percentage points.
The percentage trusting the government all or most of the time has averaged 20.5% across 30 Marquette national polls beginning in 2021. The average saying that they never trust the government is 17.4%, and the average for only some of the time is 62%. The substantial skepticism shown in the results has been a common feature of public opinion since at least 2012, when the Marquette Law School Poll began.
In the late 1950s and early 1960s, trust in the federal government was much higher, and partisan differences in opinion were much smaller. In 1958, 73% said they trusted the federal government all or most of the time, according to polling by the American National Election Study. That percentage fell to 25% in 1980. Except for brief and limited increases in the mid-1980s and late 1990s/early 2000s, trust has remained much lower than it once was.
Unlike in the period before 2000, trust in the government has become substantially dependent on partisanship and which party controls the White House at the time. In Marquette polling during the Biden administration, beginning in 2021, 31% of Democrats trusted the government all or most of the time, compared to 12% of Republicans. Now, in the second Trump administration, beginning in 2025, 31% of Republicans say they trust the government that much, compared to 11% of Democrats.
These partisan discrepancies in trust were much smaller in the past. For example, in 1968, under Democratic President Lyndon Johnson, 65% of Democrats trusted the government, as did 59% of Republicans. And during Republican President Ronald Reagan’s second term in 1988, 48% of Republicans and 35% of Democrats mostly trusted the government. Partisan gaps grew in the 2000s.
The overall stability of trust in recent years masks the changes by partisanship since 2021. Figure 1 shows these trends visually for Republicans and Democrats. The parties moved in opposite directions and almost equal amounts following the change in presidential administration in January 2025.
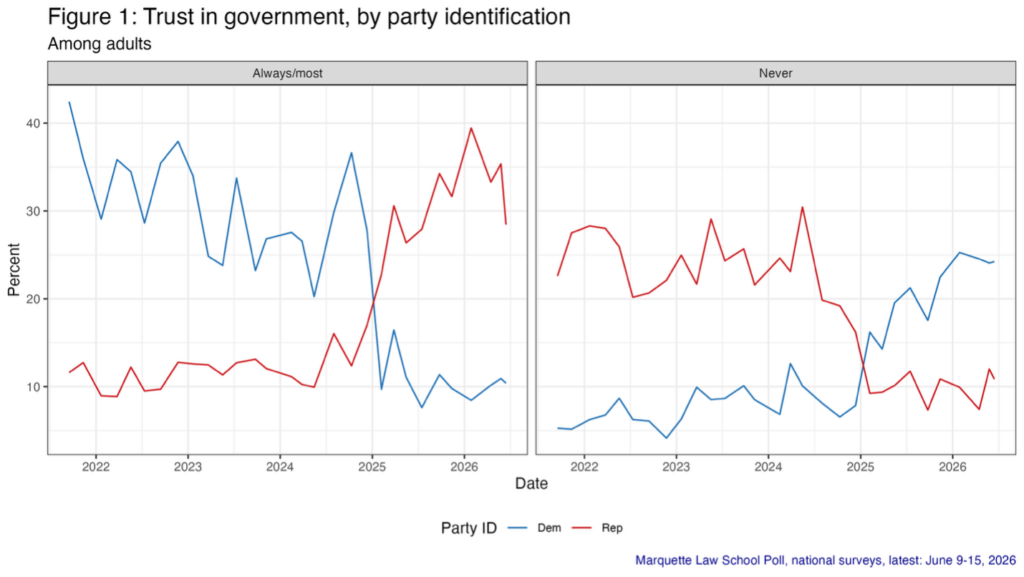
Table 1 provides the numerical values for trust overall and by party since 2021. (All results in the tables are stated as percentages.)
Table 1: Trust in government, by party identification
Among adults
Poll Dates Trust Government All: Always/most All: Only some All: Never Rep: Always/Most Dem: Always/Most Rep: Only some Dem: Only some Rep: Never Dem: Never 6/9-16/26 18 63 19 28 10 61 65 11 24 5/20-26/26 22 58 21 35 11 53 65 12 24 4/8-16/26 20 60 19 33 10 59 65 7 25 1/21-28/26 22 58 20 39 8 51 66 10 25 11/5-12/25 20 61 19 32 10 57 68 11 22 9/15-24/25 22 64 14 34 11 58 71 7 18 7/7-16/25 18 64 18 28 8 60 71 12 21 5/5-15/25 18 64 18 26 11 63 69 10 20 3/17-27/25 23 63 14 31 16 60 69 9 14 1/27-2/6/25 17 70 13 23 10 68 74 9 16 12/2-11/24 22 66 13 17 28 67 64 16 8 10/1-10/24 23 62 15 12 37 68 57 19 7 7/24-8/1/24 23 61 16 16 30 64 62 20 8 5/6-15/24 16 63 21 10 20 60 70 30 10 3/18-28/24 18 63 19 10 27 67 61 23 13 2/5-15/24 17 63 20 11 28 64 66 25 7 11/2-7/23 18 64 18 12 27 66 65 22 9 9/18-25/23 18 64 17 13 23 61 67 26 10 7/7-12/23 21 61 18 13 34 63 58 24 9 5/8-18/23 17 62 21 11 24 60 68 29 9 3/13-22/23 18 64 19 12 25 66 65 22 10 1/9-20/23 22 61 16 13 34 62 60 25 6 11/15-22/22 25 62 13 13 38 65 58 22 4 9/7-14/22 22 63 15 10 35 70 58 21 6 7/5-12/22 20 63 17 10 29 70 65 20 6 5/9-19/22 23 56 21 12 34 62 57 26 9 3/14-24/22 23 58 18 9 36 63 57 28 7 1/10-21/22 18 63 18 9 29 63 65 28 6 11/1-10/21 24 59 17 13 36 60 59 28 5 9/7-16/21 27 57 16 12 42 65 52 23 5 Marquette Law School Poll, national surveys, latest: June 9-15, 2026 Question: How much of the time do you think you can trust the government in Washington to do what is right? Confidence in institutions
As generalized trust in government has declined in recent decades, so has confidence in many institutions. Some institutions retain high public confidence, while confidence in others is quite low. To compare a variety of institutions, the Marquette Law School Poll asked about 18 institutions.
Doctors have the highest net confidence rating (percent with a great deal/quite a lot minus percent very little/none), followed by the U.S. military, the police, and local schools. Other positive net ratings go to colleges and universities and the people who administer state elections. The other 12 institutions have net negative confidence ratings. Only slightly negative are local news media, the U.S. Supreme Court, and the Food and Drug Administration, each less than 10 percentage points negative.
State legislatures are viewed negatively at -16 net, but far better than Congress at -43. Other federal institutions with net negative ratings are the U.S. Department of Justice (-21) and the executive branch (-30).
Business fares rather poorly: business leaders are at -24, companies developing artificial intelligence are at -47, and Facebook has the lowest rating of all at -66.
National news media gets a very negative -31 rating, much worse than local news media’s -2.
Confidence in voters is also quite low, with a -29 net confidence rating.
The full set of ratings is shown in Table 2.
Table 2: Confidence in institutions
Among adults, ordered by net confidence
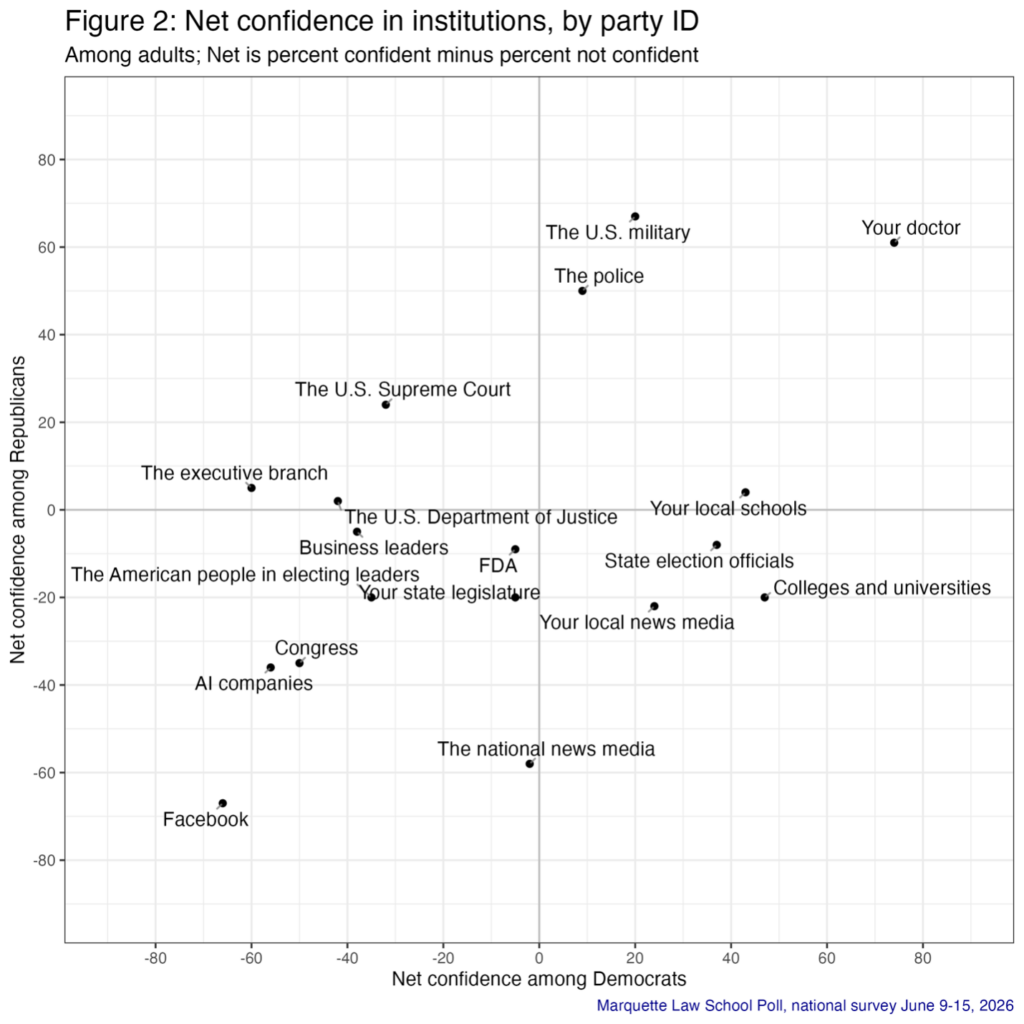
Institution Confidence Net confident minus not confident Great deal/quite a lot Some Very little/none Your doctor 64 70 24 6 The U.S. military 38 55 28 17 The police 24 45 33 21 Your local schools 21 40 41 19 Colleges and universities 12 37 38 25 The people who administer elections in your state 10 38 34 28 Your local news media -2 28 41 30 The U.S. Supreme Court -6 29 35 35 The Food and Drug Administration (FDA) -8 26 40 34 Your state legislature -16 20 44 36 The U.S. Department of Justice -21 20 39 41 Business leaders -24 15 47 39 The American people in electing leaders -29 13 45 42 The executive branch of the federal government -30 18 34 48 The national news media -31 16 36 47 Congress -43 10 37 53 Companies developing artificial intelligence (AI) -47 10 33 57 Facebook -66 5 24 71 Marquette Law School Poll, national survey June 9-15, 2026 Question: Here is a list of institutions in American society. How much confidence do you have in each one? Partisans see some of these institutions quite differently, though there are some common perceptions as well. There are some institutions viewed positively by both Republicans and Democrats, such as doctors, the military, and the police. Likewise, there is agreement in negative assessments of Congress, AI companies, and Facebook. Partisans disagree in views of the Supreme Court and the executive branch (seen positively by Republicans but negatively by Democrats) and on state election officials, colleges and universities, and local news media (seen positively by Democrats but negatively by Republicans). Of the 18 institutions, eight are seen negatively by both parties and four are viewed positively by both. Net confidence by party is shown in Figure 2.
The numerical values for net confidence by party are shown in Table 3.
Table 3: Net confidence in institutions, by party ID
Among adults
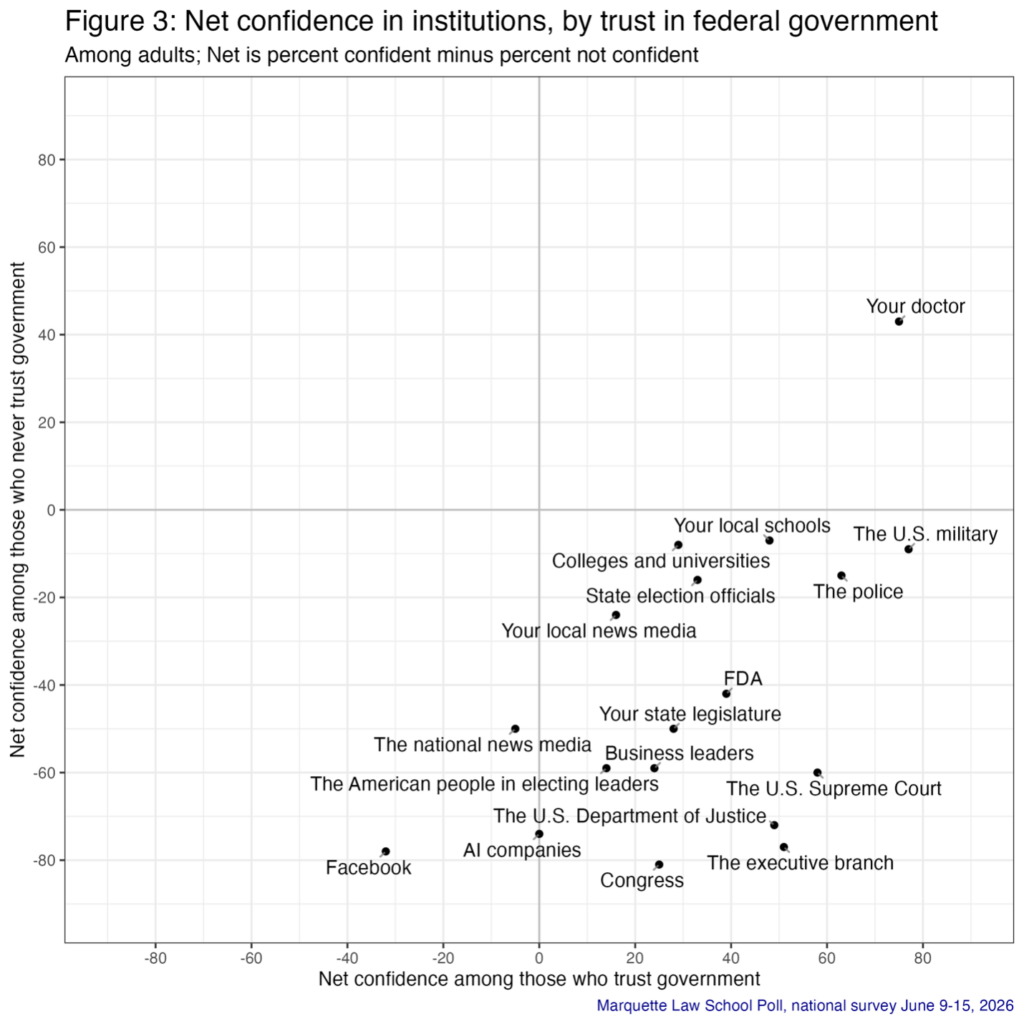
Institution Confidence All net confidence Republican Independent Democrat Your doctor 64 61 36 74 The U.S. military 38 67 8 20 The police 24 50 -9 9 Your local schools 21 4 3 43 Colleges and universities 12 -20 -5 47 The people who administer elections in your state 10 -8 -24 37 Your local news media -2 -22 -21 24 The U.S. Supreme Court -6 24 -20 -32 The Food and Drug Administration (FDA) -8 -9 -18 -5 Your state legislature -16 -20 -36 -5 The U.S. Department of Justice -21 2 -27 -42 Business leaders -24 -5 -41 -38 The American people in electing leaders -29 -20 -38 -35 The executive branch of the federal government -30 5 -40 -60 The national news media -31 -58 -35 -2 Congress -43 -35 -49 -50 Companies developing artificial intelligence (AI) -47 -36 -54 -56 Facebook -66 -67 -61 -66 Marquette Law School Poll, national survey June 9-15, 2026 Question: Here is a list of institutions in American society. How much confidence do you have in each one? People who say they don’t trust the federal government also have much less confidence in virtually all institutions, whether governmental or not. Only one institution gets a positive net rating from those distrustful of the government: doctors. All of the 17 other institutions have net negative ratings within this group. Those who do not trust the federal government generally are especially distrustful of particular federal institutions, including the executive branch, Congress, the Supreme Court, the Department of Justice, and the FDA. They are less negative as a group to local schools, the military, colleges and universities, the police, state election officials, and local news media. Business leaders, AI companies, and Facebook also receive very negative ratings from those who distrust government.
In contrast, those who generally trust the federal government tend to be quite positive about almost all the 18 institutions, whether governmental or not. They give net negative ratings only to the national news media and Facebook, with AI companies at a net zero.
Institutional net confidence by trust in the federal government is shown in Figure 3.
The numerical net confidence ratings by trust in government are shown in Table 4.
Table 4: Net confidence in institutions, by trust in federal government
Among adults
Institution Trust in federal government All net confidence Always/most of the time Only some of the time Never Your doctor 64 75 67 43 The U.S. military 38 77 42 -9 The police 24 63 24 -15 Your local schools 21 48 20 -7 Colleges and universities 12 29 12 -8 The people who administer elections in your state 10 33 10 -16 Your local news media -2 16 -1 -24 The U.S. Supreme Court -6 58 -9 -60 The Food and Drug Administration (FDA) -8 39 -12 -42 Your state legislature -16 28 -17 -50 The U.S. Department of Justice -21 49 -26 -72 Business leaders -24 24 -27 -59 The American people in electing leaders -29 14 -32 -59 The executive branch of the federal government -30 51 -39 -77 The national news media -31 -5 -33 -50 Congress -43 25 -52 -81 Companies developing artificial intelligence (AI) -47 0 -52 -74 Facebook -66 -32 -71 -78 Marquette Law School Poll, national survey June 9-15, 2026 Question: Here is a list of institutions in American society. How much confidence do you have in each one? Congressional generic ballot and turnout
Among registered voters, 47% say they will vote for the Democratic candidate in the November congressional elections, while 45% will vote for the Republican. An additional 6% say they will vote for neither, and 2% won’t vote.
Among likely voters, i.e., those who say they are absolutely certain they will vote, 53% support the Democrat and 45% favor the Republican, while 2% say they will vote for neither.
There have been shifting margins in the congressional ballot since November 2025, and the margin depends also on whether one is looking at registered voters or at likely voters. The vote margin has been tighter among registered voters, with a larger Democratic advantage among likely voters. These results are shown for registered voters and for likely voters in Table 5.
Table 5: Congressional ballot for registered voters and for likely voters
Among registered and likely voters
Sample population Congressional vote Dem minus Rep margin Democrat Republican Neither Would not vote Registered voters 6/9-15/26 2 47 45 6 2 5/20-26/26 1 46 45 7 1 4/8-16/26 4 48 44 6 1 1/21-28/26 4 48 44 7 1 11/5-12/25 5 49 44 6 1 Likely voters 6/9-15/26 8 53 45 2 0 5/20-26/26 1 49 48 4 0 4/8-16/26 10 53 43 4 0 1/21-28/26 7 52 45 3 0 11/5-12/25 9 53 44 3 0 Marquette Law School Poll, national survey June 9-15, 2026 Question: If the election for Congress were held today, would you vote for the (Democratic) candidate in your district or the (Republican) candidate in your district? Among registered voters. the margin in June is a two-point Democratic advantage. It was just a single-point advantage in May, down slightly from four points in January and April.
The results for likely voters have been 7 to 10 percentage points of Democrats over Republicans in each poll since last November, except May when there was a one-point Democratic edge.
While underlying partisan preferences may be changing, the greater advantage for Democrats among likely voters is driven by how certain respondents are that they will vote in November. This intention to vote is not a constant and can change, either up or down, from month to month. While the intention to vote is a reliable indicator of turnout, especially as an election gets closer, there is always room for mobilization or demobilization.
The trend in certainty of voting among registered voters by party identification is shown in Table 6.
Table 6: Likelihood of voting among registered voters, by party identification
Among registered voters
Poll dates Likelihood of voting Absolutely certain to vote Very likely to vote Chances are 50-50 Don’t think will vote Republican 6/9-15/26 68 16 12 4 5/20-26/26 70 18 10 1 4/8-16/26 65 20 11 4 1/21-28/26 70 18 11 1 11/5-12/25 68 19 9 4 Independent 6/9-15/26 38 25 21 14 5/20-26/26 38 28 26 8 4/8-16/26 33 25 32 9 1/21-28/26 41 26 26 7 11/5-12/25 37 27 22 14 Democrat 6/9-15/26 76 14 8 3 5/20-26/26 72 20 8 0 4/8-16/26 77 14 8 1 1/21-28/26 72 17 7 4 11/5-12/25 75 16 7 2 Marquette Law School Poll, national survey June 9-15, 2026 Question: What are the chances that you will vote in the November 2026 general election for congressional and state offices– are you absolutely certain to vote, very likely to vote, are the chances 50-50, or don’t you think you will vote? Democrats have been significantly more likely to say they are certain to vote in each poll since last November, except May when there was only a 2 point advantage. The shrinkage of the Democratic turnout advantage that month accounts for the much tighter congressional vote margin then. With the return of a Democratic turnout advantage in the June poll, the Democratic margin among likely voters returned to eight percentage points. Across these five polls, Republicans who are certain to vote have varied from 65% to 70%, while Democrats have varied from 72% to 77%. Neither has shown a consistent upward or downward trend over time.
Independents are consistently less likely to vote than either partisan camp. While independents are an important potential swing vote in November in competitive races, their lower turnout means independents punch below their weight in elections, exerting less influence than they might with turnout closer to either set of partisans.
Party loyalty in this survey remains strong within both parties, if slightly higher among Democrats than Republicans. Among registered voters, independents are almost evenly divided, though a majority of independents say they will vote for neither the Republican nor the Democrat, with another 10 percent saying they will not vote. Among likely voters, independents favor the Democrat by 14 points, though a third say they will vote for neither party. This uncertainty in turnout and choice among independents is one of the factors that can shift as the election approaches and potential voters are mobilized. Congressional vote in June, among registered and likely voters, is shown by party identification in Table 7.
Table 7: Congressional ballot for registered and for likely voters, by party identification
Among registered and likely voters
Party ID Congressional vote Dem minus Rep margin Democrat Republican Neither Would not vote Registered voters Republican -88 4 92 3 1 Independent 2 21 19 51 10 Democrat 95 96 1 2 1 Likely voters Republican -91 4 95 1 NA Independent 14 40 26 34 NA Democrat 99 99 0 1 NA Marquette Law School Poll, national survey June 9-15, 2026 Question: If the election for Congress were held today, would you vote for the (Democratic) candidate in your district or the (Republican) candidate in your district? At 45% in this poll, the Republican congressional vote continues to be higher than the job approval rating for President Donald Trump, which stands at 38%, with 62% disapproving.
To get some measure of how Trump approval affects congressional vote within party, the Marquette polls from November through June have been pooled below in order to boost the number of cases in the rare categories of independents and Democrats who approve of Trump.
Among the 18% of Republicans in the pooled sample of registered voters who disapprove of Trump, 70% say they will vote for the Republican congressional candidate, with 20% crossing over to the Democrat and 10% voting for neither or not voting. Among Republicans approving of Trump, 97% support the Republican for Congress.
Among independents in the pooled sample, 18% approve of Trump. Among these respondents, 39% support the Republican candidate and 22% favor the Democratic candidate for Congress. In contrast, among the 81% of independents who disapprove of Trump, 32% favor the Democrat and 11% the Republican. Many independents say they favor neither or won’t vote regardless of approval of Trump.
There are only 5% of Democrats in the pooled sample who approve of Trump, and 24% of them say they will vote Republican in November, while 72% remain loyal to the Democratic candidate. Of the 95% of Democrats who disapprove of Trump, 97% back the Democrat for Congress and just 1% choose the Republican.
In sum, approval or disapproval of Trump influences congressional vote, but the effect is limited by the extent of partisan loyalty. Further, the high disapproval rates among independents and Democrats limit the practical effect of this crossover vote.
The congressional vote by Trump approval and party identification is shown in Table 8.
Table 8: Congressional ballot for registered voters, by Trump approval and party identification
Among registered voters, pooling Nov.-June polls
Trump Approval Congressional vote Dem minus Rep margin Democrat Republican Neither Would not vote Republican Approve -96 1 97 2 1 Disapprove -50 20 70 9 1 Independent Approve -17 22 39 35 4 Disapprove 21 32 11 48 8 Democrat Approve 48 72 24 3 2 Disapprove 96 97 1 2 1 Marquette Law School Poll, national surveys, Nov. 2025-June 2026 Question: If the election for Congress were held today, would you vote for the (Democratic) candidate in your district or the (Republican) candidate in your district? About the Marquette Law School Poll
The survey was conducted June 9-15, 2026, interviewing 1,514 adults nationwide, with a margin of error of +/-2.7 percentage points. For registered voters, the sample size is 1,213, with a margin of error of +/-3.0 percentage points. For likely voters, the sample size is 827, with a margin of error of +/-3.6 percentage points.
Interviews were conducted using the SSRS Opinion Panel, a national probability sample with interviews conducted online. Certain other data from this survey are held for future release, or were previously released on June 24. The detailed methodology statement, survey instrument, topline results, and crosstabs for this release are available on the Marquette Law Poll website.
- Marquette Law School Poll national survey finds the 250th anniversary of the Declaration of Independence draws limited attention from Americans
Sharp partisan differences in interest in Semiquincentennial contrast with little partisan difference during the 1976 Bicentennial
Also:
- A quarter or less are paying a lot of attention to the landmark anniversary
- Two-thirds are proud of the country and more say the country has succeeded at least a fair amount in achieving the ideals of the founding; three-quarters say the U.S. is better than most countries
- Optimism for the future as a democracy is evenly divided
- Benjamin Franklin seen most favorably among the founders, followed by George Washington and Thomas Jefferson; Benedict Arnold remains in ill repute
- Trump’s job approval remains at 38%
- There has been a notable decline in approval of Trump’s job performance in rural areas of the country, as well as among other groups, across his second term
MILWAUKEE — A new Marquette Law School Poll national survey finds that only 26% of Americans have read or heard a lot about the 250th anniversary of the Declaration of Independence coming on July 4. Another 57% say they have heard some about the Semiquincentennial, while 17% have heard nothing at all about it.
This modest size of the group most engaged, accompanied by a larger share who are moderately engaged, is a theme running through the findings of this poll of how Americans feel about their country on this commemoration of the nation’s birth. Relatively small percentages are the most involved with, most proud of, and most optimistic about the country, while a considerably larger share are positive in their feelings but not strongly so.
A consistent minority express relatively negative views of the current state of the nation and its future prospects.
This pattern was also found 50 years ago on the 200th anniversary of the Declaration. In a Roper Organization poll conducted June 12-19, 1976, 28% said they were following news about the Bicentennial closely, with 50% following casually and 22% paying no attention. Raw data from the 1976 survey were provided by the Roper Center data archive at Cornell University, with analysis conducted by Marquette Law School Poll staff.
Interest in the 250th commemoration is also mixed, with just 17% who say they are very interested and another 39% who are fairly interested, while 31% are not too interested and 13% are not at all interested. Here, too, the similarity to 1976 is striking. In the Roper poll, 18% were very interested, 43% fairly interested, 26% not too interested, and 11% not at all interested.
The new Marquette Law survey was conducted June 9-15, 2026, interviewing 1,514 adults nationwide, with a margin of error of +/-2.7 percentage points.
One substantial difference from 50 years ago is found in the partisan patterns of interest and attention to the Declaration’s anniversary. President Donald Trump has emphasized the 250th anniversary and assumed control of some related celebrations, recently declaring it will be the “most spectacular TRUMP RALLY of them all” on his Truth Social account. This association of the July 4 events with the president is reflected in more substantial interest in the event among Republicans and Trump supporters and much less interest among Democrats and those who disapprove of the president.
Those who strongly approve of Trump are most likely to say they are very or fairly interested in the 250th celebrations, while interest declines as approval declines, as shown in Table 1. (All results in the tables are stated as percentages.)
Table 1: Interest in 250th anniversary, by Trump approval
Among adults
Trump approval Interest in 250th Very/fairly interested Not too/not at all interested Among all adults 57 43 Strongly approve 88 12 Somewhat approve 71 29 Somewhat disapprove 58 42 Strongly disapprove 39 61 Marquette Law School Poll, national survey June 9-15, 2026 Question: How interested are you personally in the 250th anniversary of the Declaration of Independence? This pattern is also clear by partisanship, with Republicans much more interested than independents or Democrats. In contrast, in 1976 there was very little difference across partisan categories, as shown in Table 2.
Table 2: Interest in Semiquincentennial and Bicentennial, by party identification
Among adults
Party ID Interest Very/fairly interested Not too/not at all interested Semiquincentennial Among all adults 57 43 Republican 76 24 Independent 50 49 Democrat 43 57 Bicentennial Among all adults 61 38 Republican 66 33 Independent 56 44 Democrat 63 35 Marquette Law School Poll, national survey June 9-15, 2026. Roper Organization national survey, June 12-19, 1976 Question: Marquette 2026: How interested are you personally in the 250th anniversary of the Declaration of Independence? Question: Roper 1976: How interested are you personally in the Bicentennial Celebration? Beyond general interest, 20% say they have recently watched a television show or a movie about the American Revolution, and 18% have recently read a book or an article about it. Unlike general interest in the anniversary, there is little partisan difference in viewing shows or reading about the revolution.
Views of the country
A majority of adults have positive views of the country, but more are moderately positive rather than strongly so.
A sizable 75% either strongly or somewhat agree that America is a better country than most other countries. This positive view is about evenly divided, with 35% who strongly agree and 40% who somewhat agree. Only 7% strongly disagree, with 19% who somewhat disagree.
A similar view holds of how well the country has succeeded in achieving the ideals of the founding, with 71% saying a great deal or a fair amount, but with more saying a fair amount, 53% rather than a great deal, 18%. Among those saying we have fallen short of the revolution’s ideals, 24% say we have “not very much” achieved the ideals, while 5% that those ideals have been not at all achieved.
Sixty-six percent are very or somewhat proud of who we are as a country, with 28% very proud and 38% somewhat proud. Almost a quarter, 24%, are not very proud and 10% are not at all proud.
Americans are evenly divided on the country’s future as a democracy, with 52% who are very or somewhat optimistic. Here, limited optimism is much greater, with 41% who are somewhat optimistic and only 11% very optimistic. A sizable 36% are not very optimistic, and 12% are not at all optimistic about the future.
There are significant differences across partisan and generational lines in these views, with more modest differences by race. Republicans and older adults are more positive than are Democrats and younger people, though majorities remain positive on these topics except pride in the country and optimism for the future, where some groups fall short of a positive majority.
Majorities of each partisan, age, and racial or ethnic group strongly or somewhat agree that America is better than most other countries. Racial and ethnic groups are generally similar in their positive views, while partisan gaps are large, as are differences by age. These comparisons are shown in Table 3.
Table 3: America is better than most countries, by party identification, age, and race/ethnicity
Among adults
America is better Strongly/somewhat agree Strongly/somewhat disagree Party ID Republican 93 7 Independent 59 41 Democrat 62 38 Age 18-29 58 42 30-44 70 30 45-59 79 21 60+ 85 15 Race/ethnicity White 77 23 Black 65 35 Hispanic 70 30 Other/Multiple 80 20 Marquette Law School Poll, national survey June 9-15, 2026 Question: How much do you agree or disagree with the following statement: Generally speaking, America is a better country than most other countries? Opinion of how well the country has achieved the ideals of the American Revolution show majorities saying we’ve achieved a great deal or a fair amount of those ideals, but with differences across groups in the size of that majority. Black adults and independents make up the smallest majorities saying these ideals have been achieved. These results are in Table 4.
Table 4: How much of the ideals of the revolution have been achieved, by party identification, age, and race/ethnicity
Among adults
Achieved how much of the ideals Great deal/fair amount Not very much/not at all Party ID Republican 83 17 Independent 56 44 Democrat 63 37 Age 18-29 61 39 30-44 66 34 45-59 74 26 60+ 78 22 Race/ethnicity White 74 26 Black 57 42 Hispanic 67 33 Other/Multiple 73 27 Marquette Law School Poll, national survey June 9-15, 2026 Question: Looking at America, how much do you think we have succeeded over these 250 years in achieving the ideals for which this country was founded, as you understand them? A related question was asked in the 1976 Roper survey. In 1976, 18% said the country still represented the ideals of the founding, while 46% said it had moved somewhat away from those ideals and 30% thought the country had moved far away from the founding ideals. With the difference in wording, these percentages are not directly comparable to the question of how much the country has achieved the ideals of the founding in the current survey. But this comparison over 50 years does show that, in 1976, the views about shifting ideals were barely related to partisanship, age, or race, whereas there are larger gaps across each of these three groups in 2026. The results for 1976 are shown in Table 5.
Table 5: Country still represents ideals of the founding, by party identification, age and race, 1976
Among adults
Represents ideals Still represents ideals Moved somewhat away Moved far away Party ID Republican 22 47 26 Independent 14 46 34 Democrat 17 45 31 Age 18-29 16 48 29 30-44 18 49 26 45-59 17 46 31 60+ 18 39 34 Race White 17 48 31 Black 24 35 26 Other race 30 30 22 Roper Organization, national survey, June 12-19, 1976 Question: Thinking of the principles and ideals on which our country was founded, do you think 200 years later that this country pretty much still represents those principles and ideals, or that we have moved somewhat away from them, or that we have moved far away from those principles and ideals? Pride in who we are as a country is somewhat more muted than positive opinion on the previous topics, as the numbers of Democrats, 18-29 year olds, and Black respondents slip just under 50% saying they are proud, while majorities of other groups are very or somewhat proud, as shown in Table 6.
Table 6: Pride in who we are as a country, by party identification, age, and race/ethnicity
Among adults
Proud of who we are Very/somewhat proud Not very/not at all proud Party ID Republican 88 12 Independent 56 44 Democrat 49 51 Age 18-29 48 52 30-44 62 38 45-59 73 27 60+ 76 24 Race/ethnicity White 70 30 Black 48 52 Hispanic 66 34 Other/Multiple 71 29 Marquette Law School Poll, national survey June 9-15, 2026 Question: How proud are you of who we are as a country? Optimism about the country’s future as a democracy is more divided, with majorities of several groups falling at or below 50% expressing optimism. Divisions by party and by age remain larger than divisions across racial and ethnic lines, as shown in Table 7.
Table 7: Optimism about future as a democracy, by party identification, age, and race/ethnicity
Among adults
Future as a democracy Very/somewhat optimistic Not very/not at all optimistic Party ID Republican 66 34 Independent 43 57 Democrat 41 59 Age 18-29 44 56 30-44 46 54 45-59 55 45 60+ 60 40 Race/ethnicity White 54 46 Black 42 58 Hispanic 50 50 Other/Multiple 54 46 Marquette Law School Poll, national survey June 9-15, 2026 Question: How optimistic are you about our country’s future as a democracy? Opinions of the founders
Taking a modern tool of public opinion back to the 18th century, respondents were asked how favorable or unfavorable their opinions were on eight prominent figures from the founding era. Six founders are all rated quite positively, though with variation in how many people are unfamiliar with them and modest variation in unfavorable opinion. Two other figures from the era are viewed negatively, but are also less well known.
Benjamin Franklin has the highest net favorability rating and is almost as well known as George Washington, who has the second-highest net favorability. Thomas Jefferson, principal author of the Declaration of Independence, has the third-highest rating and is also well known. These three stand together, although there is a 15-point gap in net favorability between Franklin and Jefferson, much more than the 2-point gap in their name recognition.
A second group of founders includes John Adams, Alexander Hamilton, and James Madison, each with net favorability close to 50 points, but with 21% to 28% saying they don’t know enough to have an opinion. Despite the popularity of the musical Hamilton, the author of much of the Federalist Papers falls below the top three figures in visibility. Each of these three, as with Washington and Jefferson, receives unfavorable ratings in the mid-teens.
One less-popular figure is Aaron Burr, eventual vice president and winner of a duel with Hamilton. Burr was also featured prominently in the Hamilton musical. He has a net -7 point favorability. Almost half of respondents say they haven’t heard enough about Burr to rate him.
Benedict Arnold, who fought with distinction for the Continental Army early in the revolution before defecting to the British in 1780 and leading British forces against the Americans, retains a strongly negative favorability rating after some 250 years. A third of respondents say they are unfamiliar with him.
The ratings of all these figures are shown in Table 8.
Table 8: Favorability to figures from the founding era
Among adults, ordered by net favorable
Who Favorability Net favorable minus unfavorable Favorable Unfavorable Haven’t heard enough Benjamin Franklin 75 84 9 7 George Washington 68 81 13 6 Thomas Jefferson 60 76 16 9 John Adams 53 66 13 21 Alexander Hamilton 50 64 14 22 James Madison 46 59 13 28 Aaron Burr -7 22 29 49 Benedict Arnold -38 15 53 32 Marquette Law School Poll, national survey June 9-15, 2026 Question: Do you have a favorable or an unfavorable opinion of the following people or haven’t you heard enough yet to have an opinion? Modern political ideology has some influence on how we view the revolutionary-era figures. The ordering by net favorability is very similar regardless of ideology, but conservatives are more favorable to each of the six founders, as identified above (Franklin, Washington, Jefferson, Adams, Hamilton, and Madison), and liberals least favorable, with moderates falling in between. Unfavorable views of Washington and Jefferson, in particular, reach 19% and 27% respectively among liberals, while less than 10% among conservatives hold unfavorable opinions of them. The differences in net favorability between conservatives and liberals are rather large for Washington, Jefferson, Adams, and Madison, while somewhat smaller for Hamilton and Franklin. Moderates are also somewhat more likely to lack an opinion than are either conservatives or liberals. The full set of comparisons are shown in Table 9.
Table 9: Favorability to figures from the founding era, by ideology
Among adults
Who Favorability Net favorable minus unfavorable Favorable Unfavorable Haven’t heard enough Benjamin Franklin Conservative 83 89 6 5 Moderate 73 82 9 8 Liberal 70 81 11 8 George Washington Conservative 80 88 8 4 Moderate 62 77 15 8 Liberal 55 74 19 7 Thomas Jefferson Conservative 77 85 8 7 Moderate 57 73 16 11 Liberal 38 65 27 8 John Adams Conservative 70 77 7 16 Moderate 46 59 13 27 Liberal 40 60 20 20 Alexander Hamilton Conservative 56 68 12 19 Moderate 47 59 12 29 Liberal 47 65 18 18 James Madison Conservative 60 69 9 21 Moderate 39 51 12 37 Liberal 37 55 18 26 Aaron Burr Conservative -2 25 27 47 Moderate 0 21 21 58 Liberal -24 18 42 40 Benedict Arnold Conservative -38 18 56 26 Moderate -28 17 45 38 Liberal -50 10 60 30 Marquette Law School Poll, national survey June 9-15, 2026 Question: Do you have a favorable or an unfavorable opinion of the following people or haven’t you heard enough yet to have an opinion? Presidential approval
Returning to the present, President Trump’s job approval rating is unchanged from May, with 38% approving and 62% disapproving. Approval has declined from poll to poll by small amounts, or remained steady, throughout Trump’s second term. In early February 2025, 48% approved and 52% disapproved. The trend of regular decline is shown for all Marquette Law School Poll national surveys is shown in Table 10.
Table 10: Trump job approval in second term
Among adults
Poll dates Net approve minus disapprove Approve Disapprove 6/9-15/26 -24 38 62 5/20-26/26 -24 38 62 4/8-16/26 -21 39 60 1/21-28/26 -16 42 58 11/5-12/25 -14 43 57 9/15-24/25 -14 43 57 7/7-16/25 -10 45 55 5/5-15/25 -8 46 54 3/17-27/25 -8 46 54 1/27-2/6/25 -4 48 52 Marquette Law School Poll, national surveys, latest: June 9-15, 2026 Question: Overall, how much do you approve or disapprove of the way Donald Trump is handling his job as president? Over the second term, the intensity of support has declined notably and strong opposition has increased, with strong approval falling from 29% in February 2025 to 16% in this poll and strong disapproval rising from 40% to 47% over that time. This is shown in Table 11.
Table 11: Strength of Trump job approval in second term
Among adults
Poll dates Strongly approve Somewhat approve Somewhat disapprove Strongly disapprove 6/9-15/26 16 22 15 47 5/20-26/26 16 22 17 45 4/8-16/26 17 22 12 48 1/21-28/26 19 23 14 44 11/5-12/25 21 22 13 44 9/15-24/25 23 20 16 40 7/7-16/25 23 22 11 44 5/5-15/25 24 22 13 41 3/17-27/25 26 20 13 41 1/27-2/6/25 29 19 12 40 Marquette Law School Poll, national surveys, latest: June 9-15, 2026 Question: Overall, how much do you approve or disapprove of the way Donald Trump is handling his job as president? Approval by party has declined across all partisan groups since February 2025, with smaller decreases among Republicans and larger decreases among independents. Republican approval has declined from 89% to 77%, while approval among independents has fallen from 37% to 20%, though that is up slightly from 16% among independents in May. Democratic approval has remained quite low throughout the second term, as shown in Table 12.
Table 12: Trump job approval in second term, by party identification
Among adults
Poll dates Republican Independent Democrat 6/9-15/26 77 20 6 5/20-26/26 77 16 7 4/8-16/26 78 20 6 1/21-28/26 83 24 6 11/5-12/25 85 25 5 9/15-24/25 81 27 8 7/7-16/25 86 38 7 5/5-15/25 87 31 8 3/17-27/25 87 32 10 1/27-2/6/25 89 37 9 Marquette Law School Poll, national surveys, latest: June 9-15, 2026 Question: Overall, how much do you approve or disapprove of the way Donald Trump is handling his job as president? As with Republicans, approval among 2024 Trump voters has declined, from 94% shortly after the inauguration to 80% now.
There have been declines in support for Trump among groups that were important supporters in 2024.
Approval of Trump has fallen substantially among residents of the nation’s rural areas, with moderate declines in metropolitan areas and suburbs. In February 2025, 63% of rural residents approved of Trump’s handling of his job, but that has fallen to 44% as of June. Republican strength in rural America has been a hallmark of elections in recent years, so this decline in support is notable. Declines in support in central cities and counties that contain central cities have been smaller, by 9 percentage points in each. Approval is lower in the central cities at 31% than the 39% approval in the surrounding counties. Suburbs have seen a small decline, from 51% approval to 46%. Table 13 shows these results.
Table 13: Trump job approval in second term, by urban-rural residence
Among adults
Poll dates Urbanicity: Center city Urbanicity: County of center city Urbanicity: Suburban Urbanicity: Rural 6/9-15/26 31 39 46 44 5/20-26/26 31 36 44 52 4/8-16/26 34 40 46 41 1/21-28/26 31 44 50 51 11/5-12/25 31 47 48 53 9/15-24/25 34 46 47 56 7/7-16/25 37 41 58 62 5/5-15/25 36 48 50 60 3/17-27/25 35 48 57 61 1/27-2/6/25 40 48 51 63 Marquette Law School Poll, national surveys, latest: June 9-15, 2026 Question: Overall, how much do you approve or disapprove of the way Donald Trump is handling his job as president? White adults without a college degree were quite positive about Trump at the start of the second term, there has been a decline in approval among white, non-college men, together with a larger decline among white, non-college women, who are now below 50% approval at 45%. Among white adults with a college degree, approval has also declined by 8 or 9 points for both women and men. Among non-white adults, approval has declined from 36% in early 2025 to 29% now. These results appear in Table 14.
Table 14: Trump job approval in second term, by race, education and gender
Among adults
Poll dates White, non-college,
menWhite, non-college, women White, college,
menWhite, college, women Non-white 6/9-15/26 60 45 33 32 29 5/20-26/26 55 48 41 37 25 4/8-16/26 60 52 45 35 24 1/21-28/26 63 49 47 34 29 11/5-12/25 63 57 46 36 28 9/15-24/25 60 60 45 46 26 7/7-16/25 70 58 41 38 30 5/5-15/25 60 60 39 39 36 3/17-27/25 68 59 43 37 34 1/27-2/6/25 66 62 42 40 36 Marquette Law School Poll, national surveys, latest: June 9-15, 2026 Question: Overall, how much do you approve or disapprove of the way Donald Trump is handling his job as president? In 2024, Trump made gains in votes from younger voters. During the second term, he has suffered larger declines in approval among those between the ages of 18-29 and 30-45, while facing smaller declines with those 45 and older. The youngest group provided a sizable 40% approval rating at the beginning of the second term, but that fell quickly in the early months and has held below 30% throughout 2026. Opinion among 30-44 year olds has declined more steadily, falling from 47% approval initially to 32% now. Older groups have declined by 7 points for both those 45-59 and those over 60. These results are shown in Table 15.
Table 15: Trump job approval in second term, by age
Among adults
Poll dates 18-29 30-44 45-59 60+ 6/9-15/26 28 32 45 44 5/20-26/26 22 35 41 47 4/8-16/26 19 39 42 48 1/21-28/26 28 40 42 51 11/5-12/25 30 38 45 52 9/15-24/25 26 41 44 54 7/7-16/25 34 41 53 50 5/5-15/25 35 43 51 50 3/17-27/25 30 43 57 50 1/27-2/6/25 40 47 52 51 Marquette Law School Poll, national surveys, latest: June 9-15, 2026 Question: Overall, how much do you approve or disapprove of the way Donald Trump is handling his job as president? News sources and Trump approval
There is variation in approval by news source. Because people select news sources they find agreeable, this does not mean the news content is solely responsible for these differences. However, it is noteworthy that, for example, 46% of Republicans say they watch Fox News, versus 11% of Democrats, or 31% of Democrats say they watch CNN, compared to 12% of Republicans.
The Fox News audience is far more positive to Trump than other audiences, though those who listen to podcasts for political news are also much more positive than are adults as a whole. All other audiences are more disapproving than approving. Listeners to local radio stations are less negative than the average American, and the audience for local TV news is identical in approval to the population as a whole. Those who get news from social media, a very diverse set of sources, are slightly more disapproving than the general population. People who rely on traditional news sources of local newspapers, the three historical broadcast networks, national newspapers, and CNN are increasingly negative to Trump’s handling of his job. These comparisons are presented in Table 16.
Table 16: Trump approval, by news source
Among adults
News source Approval Net approval minus disapproval Approve Disapprove Among all adults -24 38 62 Fox news 32 66 34 Podcasts 8 54 46 Local radio station -14 43 57 Local TV news -24 38 62 Social media -28 36 64 Local newspaper -34 33 67 CBS News -42 29 71 ABC News -46 27 73 NBC News -52 24 76 National newspapers -58 21 79 CNN -62 19 81 Marquette Law School Poll, national survey June 9-15, 2026 Question: Overall, how much do you approve or disapprove of the way Donald Trump is handling his job as president? Question: Which of the following, if any, have you read, watched, or listened to in the past month for information about political news and current affairs? About the Marquette Law School Poll
The survey was conducted June 9-15, 2026, interviewing 1,514 adults nationwide, with a margin of error of +/-2.7 percentage points. The poll conducted by the Roper Organization, cited above, was conducted June 12-19, 1976, and interviewed 2,004 adults nationally with a margin of error of +/-2.2 percentage points. The Roper Organization poll raw data were provided by the Roper Center data archive at Cornell University, with all analysis conducted by Marquette Law School Poll staff.
Interviews were conducted using the SSRS Opinion Panel, a national probability sample with interviews conducted online. Certain other data from this survey are held for future release. The detailed methodology statement, survey instrument, topline results, and crosstabs for this release are available on the Marquette Law Poll website.