
Also:
- 74% of Republicans, 35% of independents, and 22% of Democrats approve of the job the Court is doing
- A majority of Republicans think the Court rarely or never sides with Trump; three-quarters of Democrats say the Court often or fairly often sides with Trump
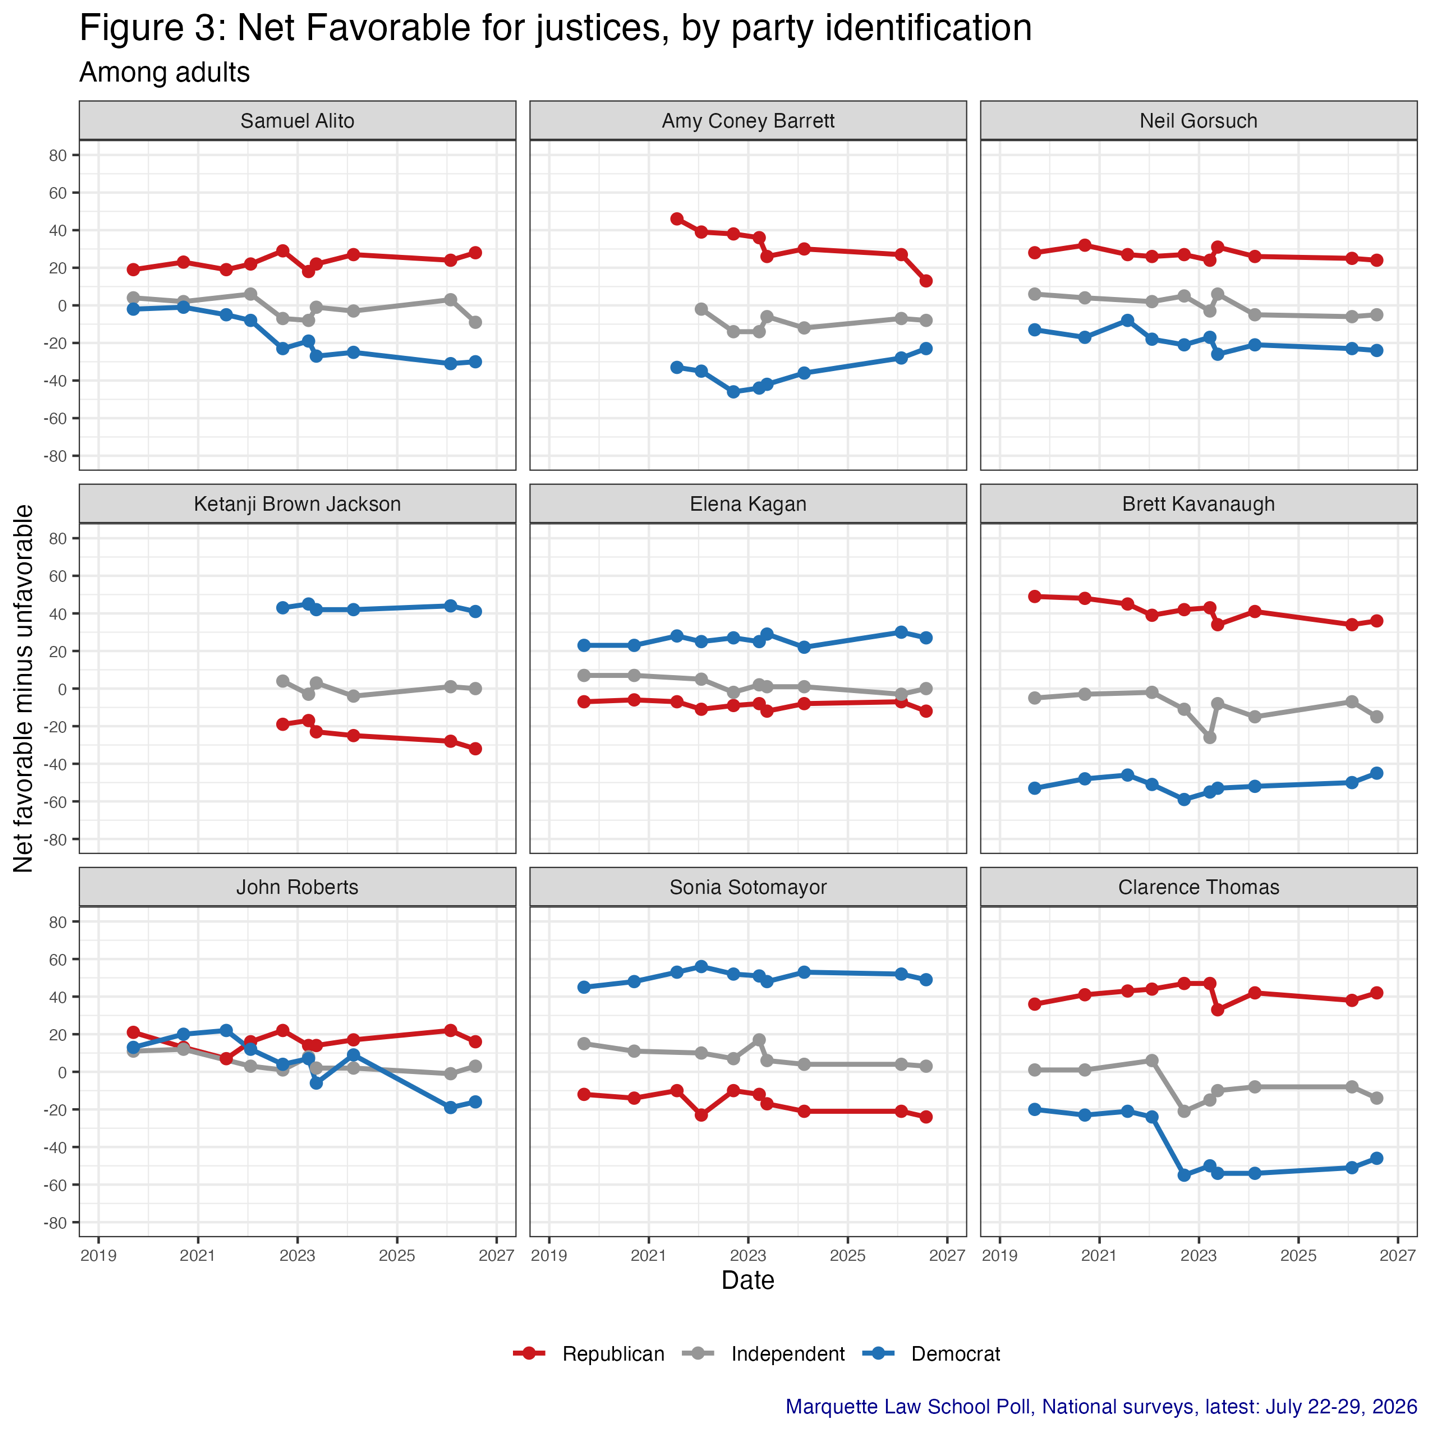
- The public sees the Court’s justices through partisan filters, though many are unfamiliar with the individual justices
- A majority of public favors the Court’s decision in 11 of 13 cases this past term
- More say the next president should have less control over departments and agencies than say he should have more control
- 69% say Congress has not done its job, giving too much power to the president
- 58% say it is possible for Congress to take back some of the power it has given up
MILWAUKEE — A new Marquette Law School Poll national survey finds 47% of adults approve of the way the United States Supreme Court is handling its job, while 53% disapprove. In May, 46% approved and 54% disapproved.
Approval has remained below 50% since November 2025, after an approval rating consistently above 50% for the first half of 2025, including a high of 54% in March 2025.
Approval of the Court varies substantially across party lines, with 74% of Republicans approving of the Court, while 35% of independents and 22% of Democrats approve. Among Republicans, there has been a gradual decline in approval of the Court from 84% in February 2025 to 74% now. Approval among independents has also declined from 46% in February 2025 to 35% now, though approval has recovered from a low of 26% in January 2026. Approval among Democrats was as high as 31% in March and May 2025 but has held in the high teens to low 20s since then, standing at 22% in this July survey. Approval by party in 2025 and 2026 is shown in Figure 1, and the percentage values are shown in Table 1. (All results in the tables are stated as percentages.)
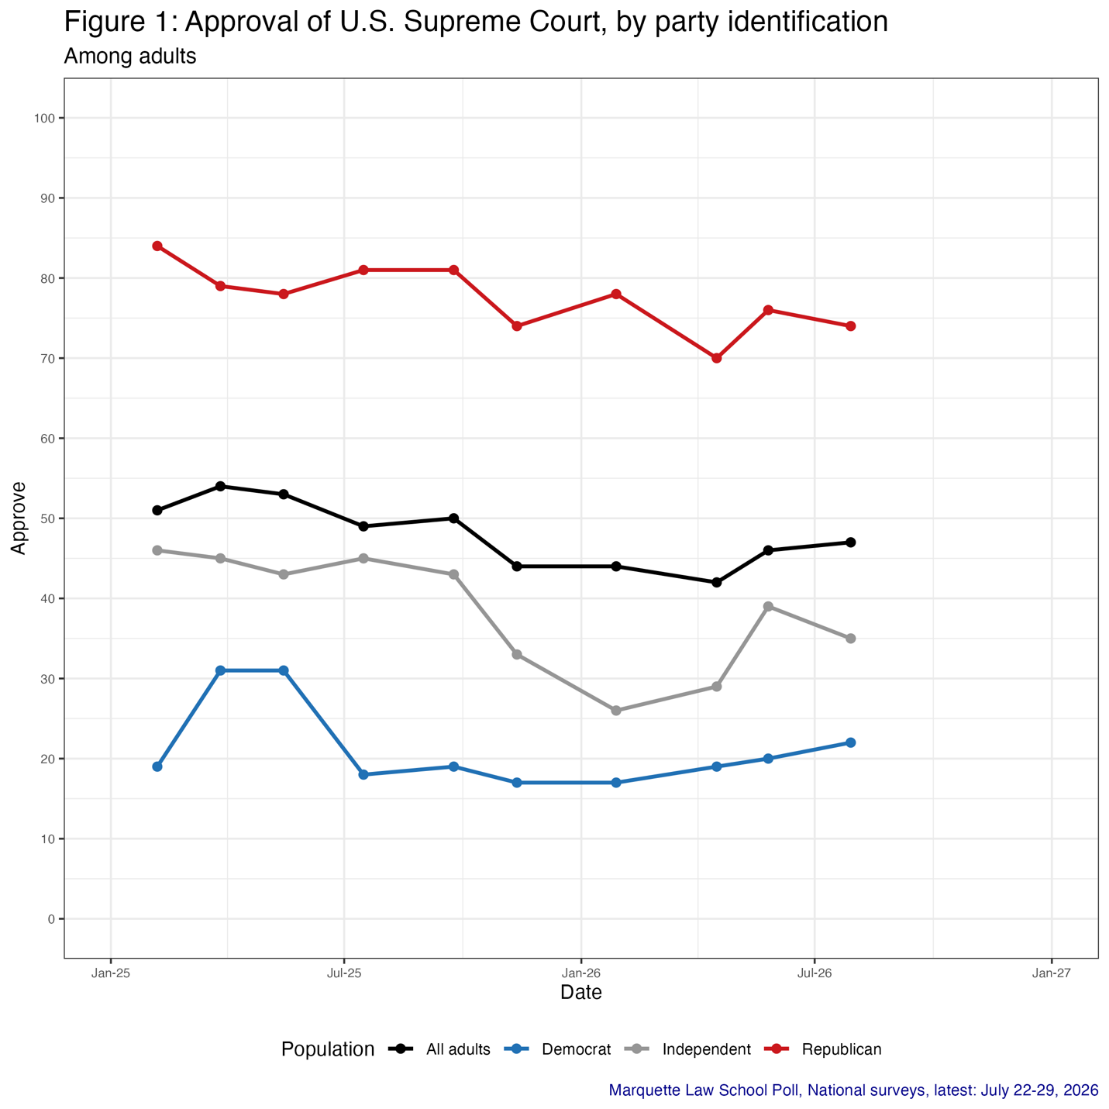
Table 1: Approval of U.S. Supreme Court, by party identification
Among adults
| Date | Approval | |||
| All adults | Republican | Independent | Democrat | |
| 7/22-29/26 | 47 | 74 | 35 | 22 |
| 5/20-26/26 | 46 | 76 | 39 | 20 |
| 4/8-16/26 | 42 | 70 | 29 | 19 |
| 1/21-28/26 | 44 | 78 | 26 | 17 |
| 11/5-12/25 | 44 | 74 | 33 | 17 |
| 9/15-24/25 | 50 | 81 | 43 | 19 |
| 7/7-16/25 | 49 | 81 | 45 | 18 |
| 5/5-15/25 | 53 | 78 | 43 | 31 |
| 3/17-27/25 | 54 | 79 | 45 | 31 |
| 1/27-2/6/25 | 51 | 84 | 46 | 19 |
| Marquette Law School Poll, National surveys, latest: July 22-29, 2026 | ||||
| Question: Overall, how much do you approve or disapprove of the way the U.S. Supreme Court is handling its job? | ||||
The survey was conducted July 22-29, 2026, interviewing 1,076 adults nationwide, with a margin of error of +/-3.2 percentage points.
Both party and political ideology are related to approval of the Supreme Court. Republicans who consider themselves very conservative are more approving than Republicans who are not very conservative, while Democrats who describe themselves as very liberal are more disapproving than those Democrats who do not see themselves as very liberal. Independents fall between the parties, as shown in Table 2.
Table 2: Supreme Court approval, by party identification and ideology
Among adults
| Party & ideology | Approval | |
| Approve | Disapprove | |
| All adults | 47 | 53 |
| Republican, very conservative | 84 | 16 |
| Republican, not very conservative | 70 | 30 |
| Independent | 35 | 65 |
| Democrat, not very liberal | 27 | 73 |
| Democrat, very liberal | 5 | 95 |
| Marquette Law School Poll, National survey, July 22-29, 2026 | ||
| Question: Overall, how much do you approve or disapprove of the way the U.S. Supreme Court is handling its job? | ||
The administration of President Donald Trump has been a frequent party to disputes before the Supreme Court during his second term, with the president also often commenting on the Court. Despite Trump’s criticisms of the Court and losses in some major decisions, approval of Trump is linked to approval of the Court.
Among Republicans who approve of how Trump is handling his job, 82% approve of the Supreme Court, while among Republicans who disapprove of Trump, 43% approve of the Court. There are too few independents and Democrats who approve of how Trump is handling his job to reliably estimate the analogous comparisons. Combining both independents and Democrats who approve of Trump, 75% approve of the Court, while among independents who disapprove of Trump 27% approve of the Court, and among Democrats who disapprove of Trump 17% approve of how the Court is handling its job.
Republicans are more likely to say the Court rules for Trump rarely or never than are independents. Among Democrats, more than 70% say the Court rules for Trump often or fairly often.
Among all adults, the percentage saying the Court rules for Trump often or fairly often declined from 61% in May to 55% in July, following the end of the Supreme Court term in which some prominent decisions rejected Trump administration arguments. Among Republicans, this fell from 45% to 37%, while independents rose slightly from 47% to 49% and Democrats declined slightly from 79% to 77%. These results are shown in Table 3.
Table 3: How often Court rules for Trump, by party identification
Among adults
| Poll dates | Court rules for Trump | |
| Often/Fairly often | Rarely/Never | |
| All adults | ||
| 7/22-29/26 | 55 | 45 |
| 5/20-26/26 | 61 | 39 |
| Republican | ||
| 7/22-29/26 | 37 | 63 |
| 5/20-26/26 | 45 | 55 |
| Independent | ||
| 7/22-29/26 | 49 | 51 |
| 5/20-26/26 | 47 | 53 |
| Democrat | ||
| 7/22-29/26 | 77 | 23 |
| 5/20-26/26 | 79 | 21 |
| Marquette Law School Poll, National surveys, latest: July 22-29, 2026 | ||
| Question: Since the beginning of his second term, how often do you think the Supreme Court has ruled in favor of the Trump administration in cases that have reached the Court? | ||
Among Republicans, perceptions of how often the Court rules for the Trump administration is not related to approval of the Court, while approval of the Court rises among independents and Democrats who think the Court rarely or never sides with the administration, as shown in Table 4.
Table 4: Approval of the Court, by how often it rules for Trump and by party
Among adults
| How often rules for Trump | Approval | |
| Approve | Disapprove | |
| Republican | ||
| Often/Fairly often | 74 | 26 |
| Rarely/Never | 74 | 26 |
| Independent | ||
| Often/Fairly often | 20 | 80 |
| Rarely/Never | 50 | 50 |
| Democrat | ||
| Often/Fairly often | 17 | 83 |
| Rarely/Never | 37 | 62 |
| Marquette Law School Poll, National survey, July 22-29, 2026 | ||
| Question: Overall, how much do you approve or disapprove of the way the U.S. Supreme Court is handling its job? | ||
| Question: Since the beginning of his second term, how often do you think the Supreme Court has ruled in favor of the Trump administration in cases that have reached the Court? | ||
Among all adults, 54% say the Court is going out of its way to avoid a ruling Trump might refuse to obey, while 46% say the Court is not avoiding such a decision. This perception has remained fairly stable through the second Trump term, though it declined 3 percentage points from May to July.
This perception of the Court varies substantially by party, with 32% of Republicans saying the Court is avoiding such a ruling, as do 55% of independents and 76% of Democrats. For independents and Democrats, this percentage declined 5 and 4 percentage points, respectively, from May to July. These results during the second Trump term are shown in Table 5.
Table 5: Is Court avoiding ruling against Trump, by party identification
Among adults
| Poll dates | Avoiding ruling | |||
| All adults | Republican | Independent | Democrat | |
| 7/22-29/26 | 54 | 32 | 55 | 76 |
| 5/20-26/26 | 57 | 33 | 60 | 80 |
| 4/8-16/26 | 57 | 33 | 66 | 79 |
| 1/21-28/26 | 57 | 34 | 59 | 78 |
| 11/5-12/25 | 56 | 37 | 58 | 74 |
| 9/15-24/25 | 55 | 31 | 58 | 81 |
| Marquette Law School Poll, National surveys, latest: July 22-29, 2026 | ||||
| Question: Do you think the U.S. Supreme Court is going out of its way to avoid making a ruling that President Donald Trump might refuse to obey? | ||||
The perception that the justices are motivated mainly by politics stands at 58% in July, with 42% saying the justices are mainly motivated by the law. The belief that politics is the main motivation rose by 6 percentage points from May to July. Partisanship plays a substantial role in this belief, with a majority of Republicans saying justices are motivated by the law, while majorities of independents and especially of Democrats say that politics is the main motivation. The perception that politics is the motive rose among all three partisan groups from May to July, as shown in Table 6.
Table 6: Motivation of justices’ decisions, by party identification
Among adults
| Poll dates | Motivation | |
| Mainly politics | Mainly the law | |
| All adults | ||
| 7/22-29/26 | 58 | 42 |
| 5/20-26/26 | 52 | 48 |
| Republican | ||
| 7/22-29/26 | 43 | 57 |
| 5/20-26/26 | 36 | 64 |
| Independent | ||
| 7/22-29/26 | 59 | 41 |
| 5/20-26/26 | 57 | 43 |
| Democrat | ||
| 7/22-29/26 | 74 | 26 |
| 5/20-26/26 | 67 | 33 |
| Marquette Law School Poll, National surveys, latest: July 22-29, 2026 | ||
| Question: In general, what most often motivates Supreme Court justices’ decisions? | ||
Executive and congressional power
A number of cases in the October 2025 Supreme Court term and in recent years concern the extent of executive power over departments and independent agencies, as well as the ability of Congress to delegate decisions to agencies. Justice Neil Gorsuch has written in recent opinions about how difficult it can be for Congress to reclaim authority once it has been delegated. The Court has ruled for extensive presidential authority over the executive branch and independent agencies in the term that just ended. The public has some ideas about these issues.
A plurality of adults, 45%, say the next president should have less control over departments and agencies than today, with 36% saying the president should have about as much control as today and 18% saying he should have more control over the executive branch.
Partisans differ in their views of executive powers. Most Republicans favor current powers, though 25% say presidents should have more control. A plurality of independents, 46%, favor less control, as do 72% of Democrats, while 21% of independents and just 9% of Democrats favor more powers. These results are shown in Table 7.
Table 7: Presidential control over agencies, by party identification
Among adults
| Population | Presidential control | ||
| More control over departments and agencies | Less control over departments and agencies | About as much control as today | |
| All adults | 18 | 45 | 36 |
| Republican | 25 | 20 | 55 |
| Independent | 21 | 46 | 33 |
| Democrat | 9 | 72 | 18 |
| Marquette Law School Poll, National survey, July 22-29, 2026 | |||
| Question: Would you like to see the next president have (more) control over federal departments and agencies, (less) control or about as much control as the president has today? | |||
A majority of adults, and majorities of each party, say that Congress has failed to do its job over the last 25 years, giving up too many powers to the president and avoiding making hard decisions. Among all adults, 31% say Congress has done its job, while 69% say it has given up too much power. A slight majority of Republicans, 52%, say Congress has given up too much power, while 77% of independents and 85% of Democrats say the same. These results are shown in Table 8.
Table 8: Has Congress done its job, by party identification
Among adults
| Population | Congress done its job | |
| Done its job | Given up powers to the president and executive branch | |
| All adults | 31 | 69 |
| Republican | 48 | 52 |
| Independent | 23 | 77 |
| Democrat | 15 | 85 |
| Marquette Law School Poll, National survey, July 22-29, 2026 | ||
| Question: Thinking about the last 25 years, do you think Congress has done its job by passing legislation, such as spending, taxing and setting policies, or has it given up too many of those powers to the president and the executive branch to avoid making hard decisions? | ||
While a majority think Congress has given up too much power, 58% think it can take back some of the powers it has delegated while 42% say it is practically impossible for Congress to take this authority back. Majorities of each partisan group think Congress can recover its powers. The range of opinion across parties is more modest here than in the perception that Congress has given up too much power in the previous table. Table 9 shows these results.
Table 9: Can Congress take back powers, by party identification
Among adults
| Population | Take back power | |
| Congress can take back powers it delegated | Practically impossible for Congress to take them back | |
| All adults | 58 | 42 |
| Republican | 55 | 45 |
| Independent | 54 | 46 |
| Democrat | 63 | 37 |
| Marquette Law School Poll, National survey, July 22-29, 2026 | ||
| Question: Do you think the Congress can take back some of the powers it delegated to regulatory agencies and the executive branch, or do you think once those powers are delegated, it is practically impossible for Congress to take them back? | ||
In this national survey, 73% think the next president should be less able to make policy without congressional authorization. This has majority support across parties, but with a wide variation. Among Republicans, 55% say the next president should be less able to act without Congress, while 78% of independents and 91% of Democrats agree, as shown in Table 10.
Table 10: Presidential policy making without Congress, by party identification
Among adults
| Population | Presidential policy making | |
| More able to make policy without Congress | Less able to act without Congress | |
| All adults | 27 | 73 |
| Republican | 45 | 55 |
| Independent | 21 | 78 |
| Democrat | 9 | 91 |
| Marquette Law School Poll, National survey, July 22-29, 2026 | ||
| Question: Compared to the last four presidents, do you think the next president should be more able to make policy without needing the consent of Congress, or should the next president be less able to act without congressional authorization? | ||
The public is divided on whether it is a bigger problem for Congress to fail to act on national issues or for presidents to act without congressional consent. Fifty-seven percent say Congress failing to act is the bigger problem, while 43% say presidential action without congressional agreement is more of a problem. Here the parties are divided, with 75% of Republicans saying Congress failing to act is the bigger problem, while 59% of Democrats say presidential action without Congress is the bigger problem. Independents are nearly evenly divided. These opinions are shown in Table 11.
Table 11: Congress fails to act or president who acts without Congress, by party identification
Among adults
| Population | Which is bigger problem | |
| A Congress that fails to act | A president who acts without the consent of Congress | |
| All adults | 57 | 43 |
| Republican | 75 | 25 |
| Independent | 52 | 48 |
| Democrat | 41 | 59 |
| Marquette Law School Poll, National survey, July 22-29, 2026 | ||
| Question: Which do you think is a bigger problem, (a Congress that fails to act to address national issues) or (a president who acts on national issues without the consent of Congress)? | ||
Public attention to the Court and its decisions
The public pays modest attention to the Supreme Court, in comparison to the president or Congress, though the amount of attention varies across decisions. Of four major rulings in June:
- Birthright citizenship was most visible to the public, with 40% saying they read or heard a lot about this decision. Just 15% say they had heard nothing about it.
- A decision that states can limit transgender athletes from playing on women’s and girls’ teams was almost as visible, with 37% hearing a lot and 15% nothing at all.
- Attention falls off for the decision that states can allow the counting of absentee ballots postmarked by election day but arriving after election day, a decision that 21% heard a lot about and 29% heard nothing at all.
- Similarly, 20% heard a lot about the decision that presidents can remove the heads of independent agencies and 37% heard nothing about this case.
For comparison, 28% say they heard a lot about the Supreme Court in the last month, and 15% say they heard nothing. This range of attention is shown in Table 12.
Table 12: Attention to Court topics in the news
Among adults
| Item | Heard or read | ||
| A lot | A little | Nothing at all | |
| Birthright citizenship decision | 40 | 45 | 15 |
| States can limit transgender athletes decision | 37 | 49 | 15 |
| Heard about Court in last month | 28 | 57 | 15 |
| Late arriving ballots decision | 21 | 50 | 29 |
| Removal of heads of independent agencies decision | 20 | 43 | 37 |
| Marquette Law School Poll, national survey: July 22-29, 2026 | |||
| Question: Thinking about the last month only, how much have you heard or read about the U.S. Supreme Court? | |||
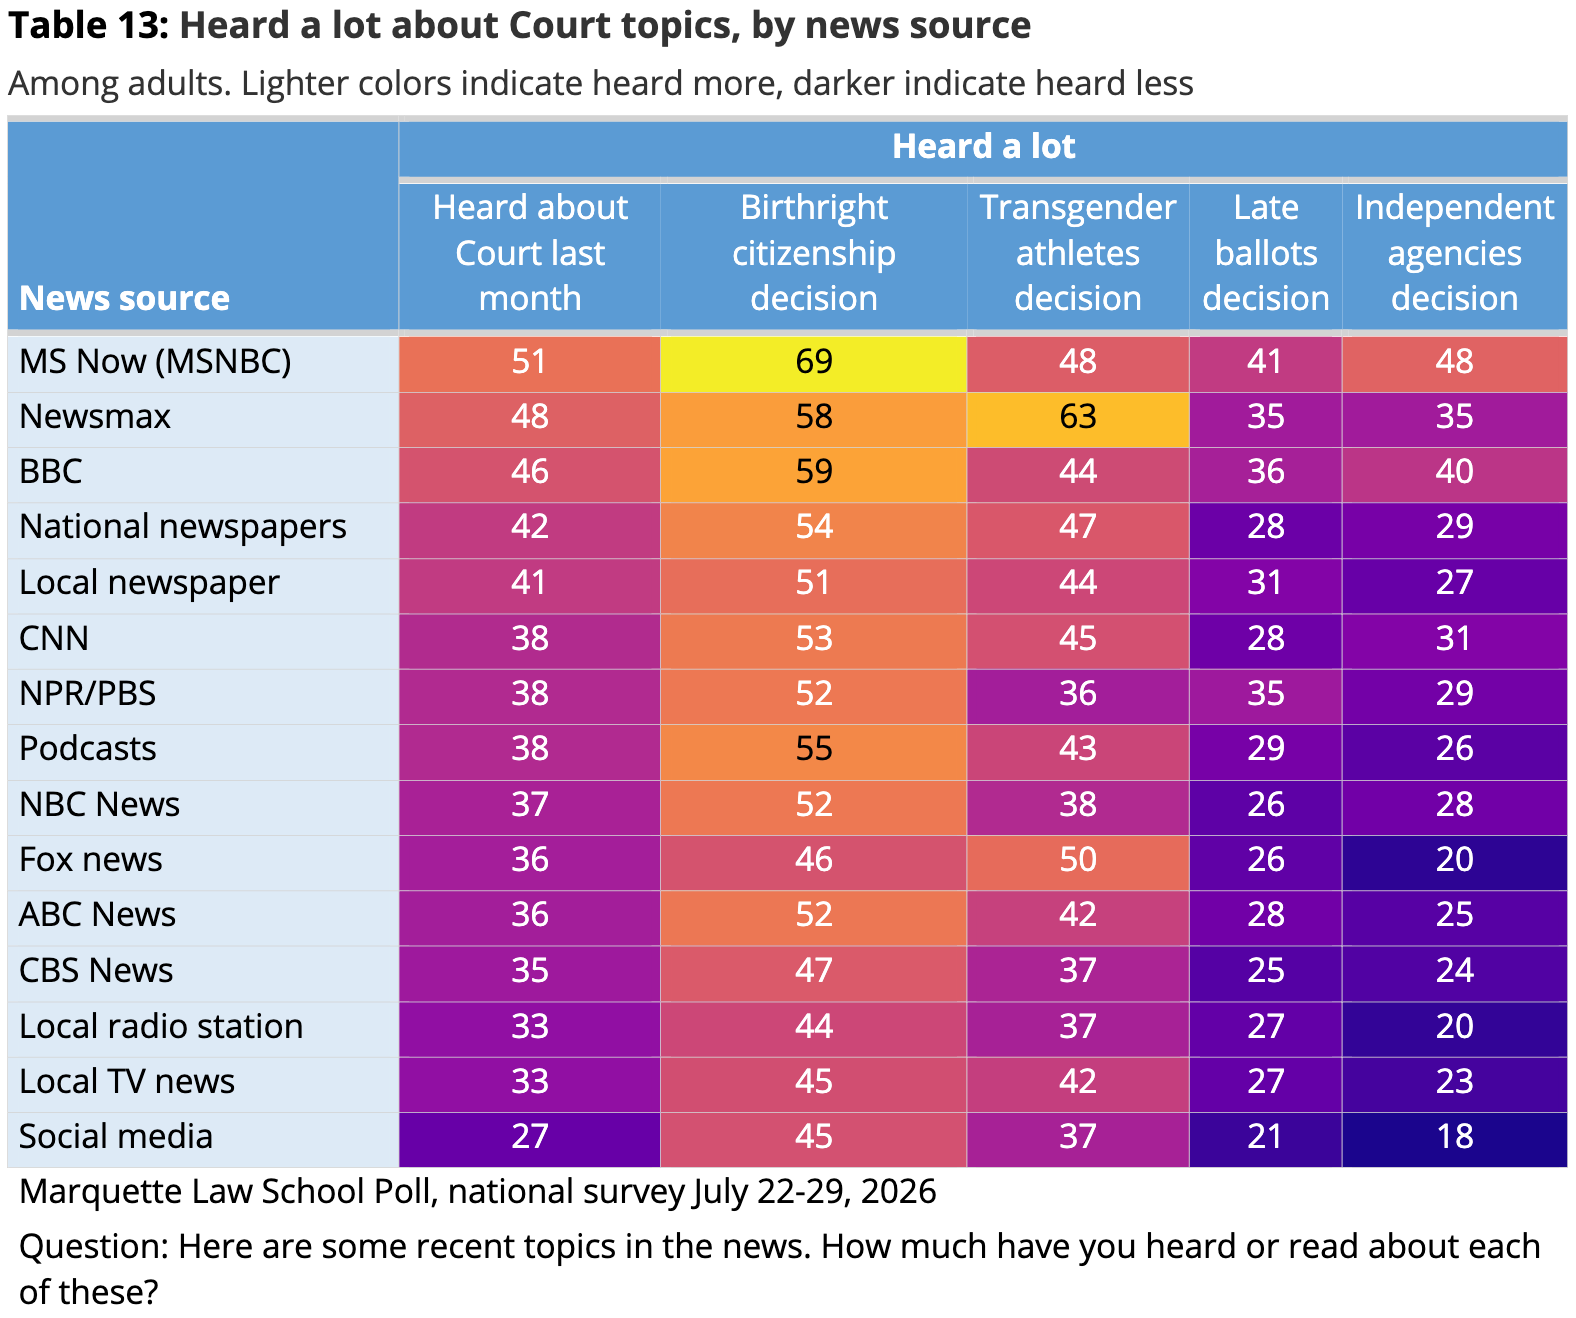
Awareness of Court decisions and of the Court itself varies by the sources people say they rely on for news and public affairs information. This variation is likely due to both the different content across sources and to the self-selected audiences who gravitate to news sources they find congenial. In this case, those more engaged by politics may also pick certain news sources while those less engaged may prefer different outlets.
For attention to the Supreme Court over the last month, the audiences for MS Now (formerly MSNBC), Newsmax, and the BBC are the most likely to say they have heard a lot about the Court, with more than 45% of each saying so. At the opposite end of awareness, the audiences for local radio, local TV news, and those who depend on social media have heard the least, with 33% or less of each saying they heard a lot about the Court.
A similar pattern appears for the four Court decisions, but with considerable variation across cases, and moderate to large differences across news sources within each case. The highest attention to the birthright citizenship case was among the audiences of MS Now, Newsmax, and the BBC, each with 58% or more hearing a lot. The local news audiences were also at the bottom of awareness of this decision. Among the major broadcast networks and Fox News audiences, 46% to 53% said they had heard a lot about this case.
The transgender athletes case shows a somewhat different pattern, with 63% of the Newsmax audience hearing a lot, while 48% of the MS Now and 44% of the BBC audiences heard a lot. Among the major network audiences, 50% of Fox viewers heard a lot, while between 37% and 42% of the audiences of ABC, CBS, and NBC heard a lot.
The less visible cases on late-arriving ballots and independent agencies show less variation across news sources, though the MS Now audience was most likely to hear a lot about both cases, with the BBC and Newsmax audiences a bit behind it.
Table 13 shows the amount read or heard about each case by news source. The lighter colors indicate more attention by the news source’s audience while darker shades indicate less exposure to the decision.
Public views of recent Supreme Court decisions
Of the 13 rulings by the Supreme Court this term included in the survey, a majority of the public favors the Court’s decisions in 11 cases and opposes the rulings in two. The degree of support for the Court varies substantially across cases, from 81% favoring the ruling that limits police access to cell phone location data, to 66% favoring the ruling that Trump may not impose tariffs under the International Economic Emergency Powers Act, and 51% favoring the decision allowing the Trump administration to restrict asylum seekers. Narrow majorities opposed the decision that allows the president to remove the heads of independent agencies, 51%, and the ruling that permits political parties to coordinate with candidate campaigns, 53%. Eight of the 13 rulings were favored by at least 60% of the public. All of these cases are shown in Table 14.
Table 14: Favor or oppose Court’s decisions
Among adults
| Item | Favor or oppose | |
| Favor | Oppose | |
| Limit police access to cell phone location data | 81 | 19 |
| President may not remove member of Federal Reserve | 70 | 30 |
| Rejected Trump appeal of $5M E. Jean Caroll verdict | 66 | 34 |
| Trump may not impose tariffs under IEEPA | 66 | 34 |
| States may ban transgender athletes in women’s sports | 65 | 35 |
| Uphold birthright citizenship | 63 | 37 |
| Allow counting late-arriving ballots | 62 | 38 |
| Federal law may not ban guns for drug user | 61 | 39 |
| Voting Rights Act does not require minority-majority districts | 53 | 47 |
| State may not ban conversion therapy | 53 | 47 |
| Allow restrictions on asylum seekers | 51 | 49 |
| President may remove heads of independent agencies | 49 | 51 |
| Allow parties to coordinate with candidate campaigns | 47 | 53 |
| Marquette Law School Poll, national survey: July 22-29, 2026 | ||
| Question: See full question wordings at the end of this release | ||
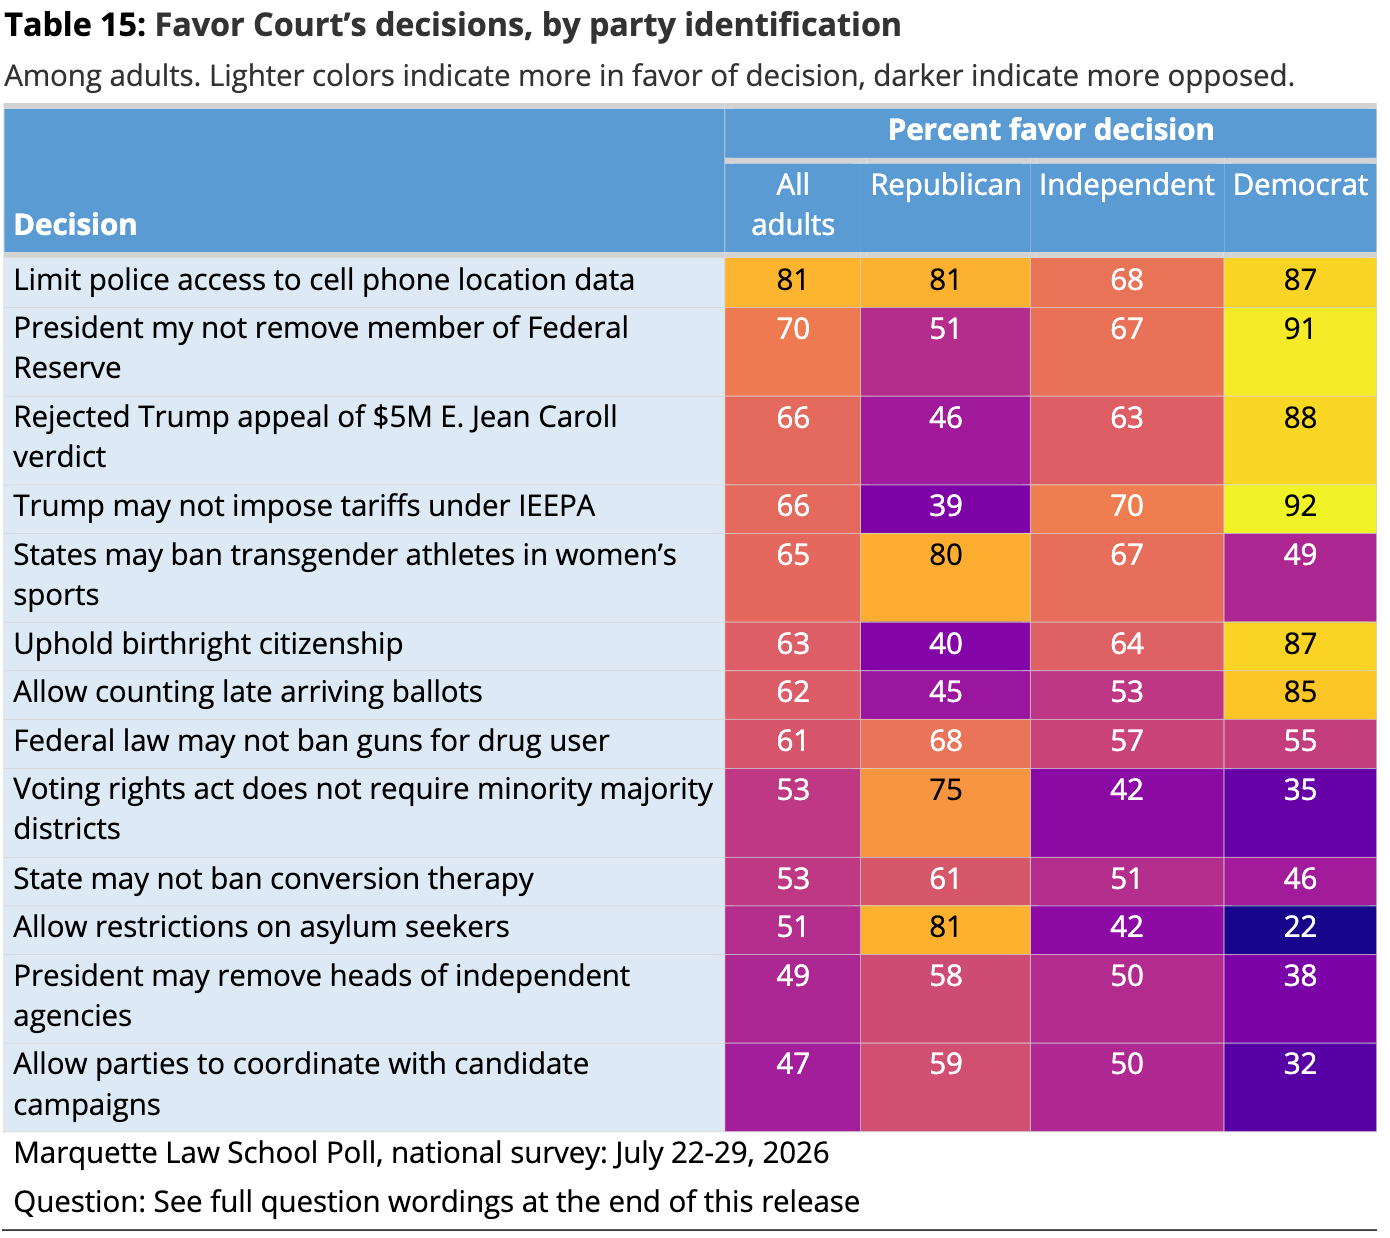
Partisanship plays a substantial role in how citizens see Supreme Court decisions, with partisan agreement in some cases but substantial disagreement in other cases. For example, majorities of each partisan group favor the decision to limit access to cell phone locations, the most popular of the 13 decisions. A much larger divide appears on the president’s ability to remove a member of the Federal Reserve Board, a decision that a bare majority of Republicans favor, 51%, but that larger majorities of independents, 67%, and of Democrats, 91%, favor.
In some cases, the partisan divide is a chasm, as on allowing the Trump administration to restrict asylum seekers, on which 81% of Republicans favor the ruling and just 22% of Democrats do so. Where Trump or the Trump administration is a party to the case, the partisan gap tends to be large, although, in a number of cases where the Court ruled against the administration’s position, sizable minorities of Republicans, 39% or more, favored the decision. Examples include rejecting Trump’s appeal of the E. Jean Caroll verdict and the rulings on tariffs and birthright citizenship.
Opinions of these cases by partisanship are shown in Table 15. Lighter colors indicate more support for the decision while darker colors indicate less support.
Public views of the justices
The justices of the Supreme Court are far from household names for most Americans. Asked whether they have a favorable or an unfavorable opinion of each justice, between 41% and 69% say they haven’t heard enough to have an opinion of that justice. Justices Clarence Thomas, Brett Kavanaugh, and Sonia Sotomayor are the best known, while Justices Samuel Alito, Neil Gorsuch, and Elena Kagan are the least known. Chief Justice John Roberts is not familiar to 60% of American adults.
The justices with more favorable than unfavorable opinions come from the “liberal” side of the bench, Sotomayor, Justice Ketanji Brown Jackson, and Kagan, while the six “conservative” justices are seen either more unfavorably than favorably or, in the cases of Roberts and Gorsuch, are seen equally favorably and unfavorably. The current views of the justices are shown in Table 16.
Table 16: Favorable and unfavorable ratings of justices
Among adults
| Date | Favorability | ||
| Favorable | Unfavorable | Haven’t heard enough | |
| Clarence Thomas | 28 | 31 | 41 |
| Brett Kavanaugh | 22 | 27 | 51 |
| Sonia Sotomayor | 29 | 19 | 52 |
| Ketanji Brown Jackson | 23 | 20 | 57 |
| Amy Coney Barrett | 18 | 24 | 58 |
| John Roberts | 20 | 20 | 60 |
| Samuel Alito | 19 | 20 | 61 |
| Neil Gorsuch | 16 | 16 | 68 |
| Elena Kagan | 19 | 13 | 69 |
| Marquette Law School Poll, National surveys, latest: July 22-29, 2026 | |||
| Question: Some justices of the Supreme Court are better known than others. For each of these names, have you never heard of them, heard of them but don’t know enough to have an opinion of them, have a favorable opinion or have an unfavorable opinion? | |||
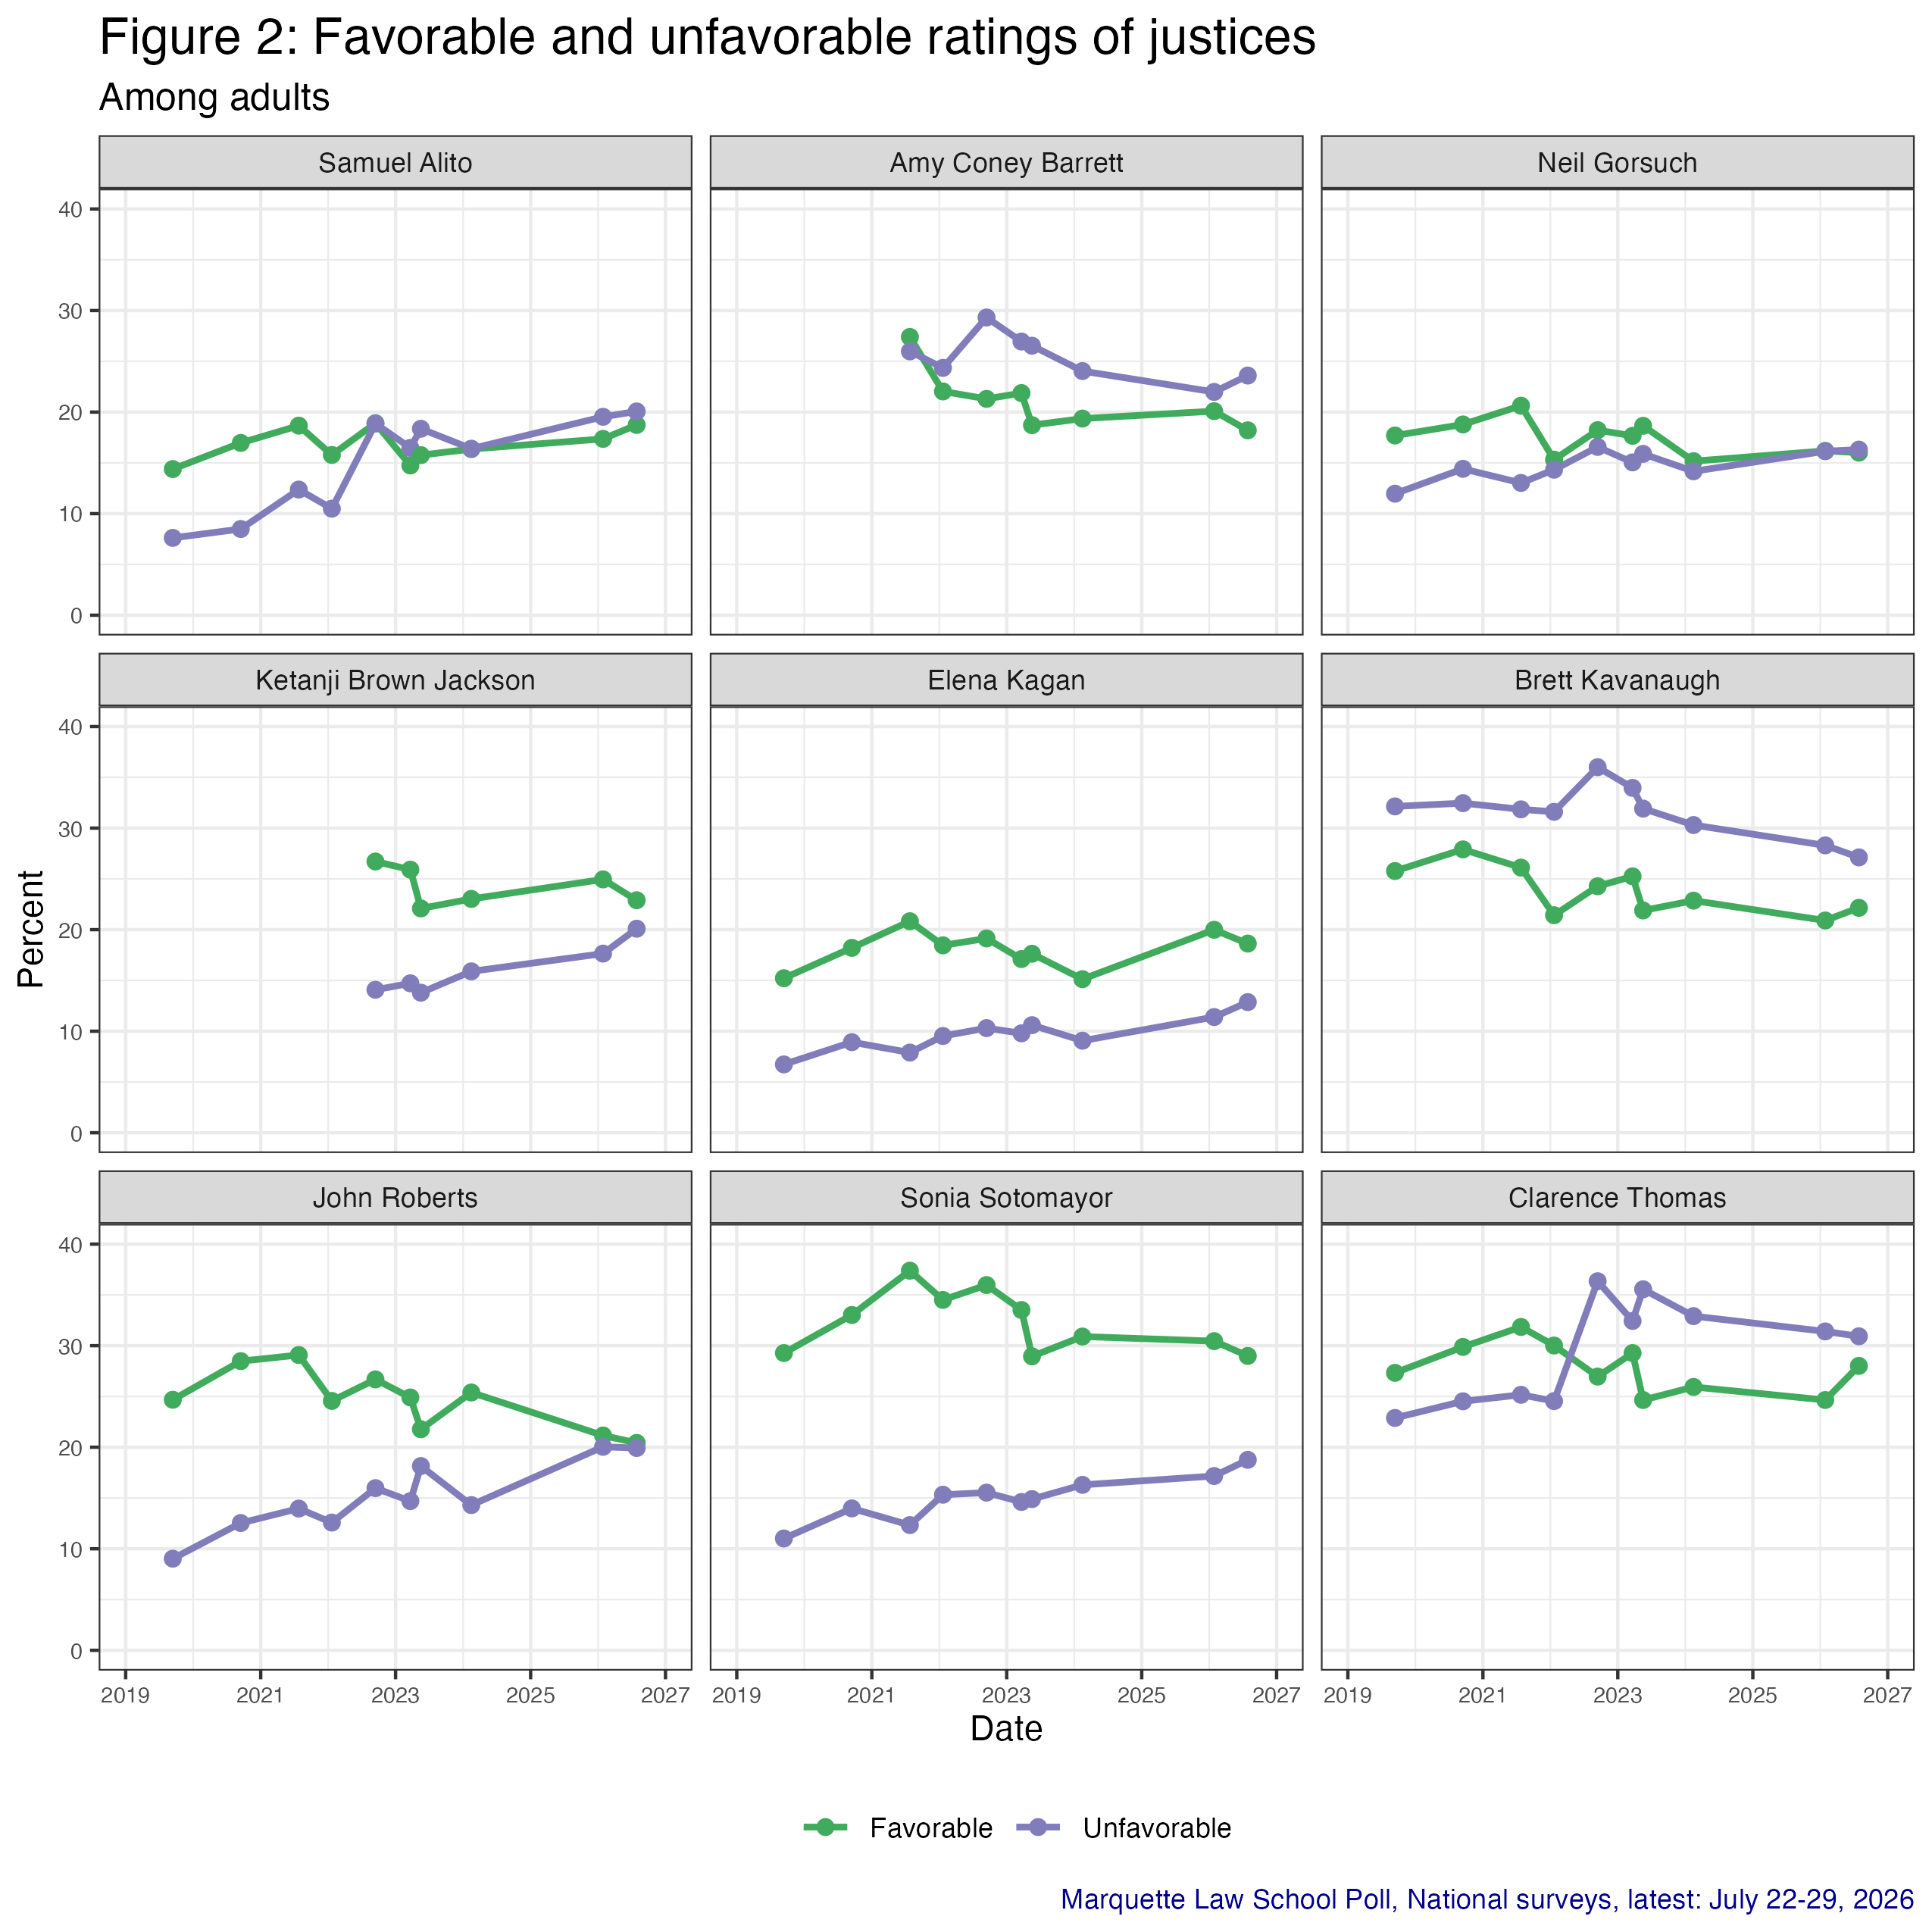
Despite the limited visibility of the justices, there has been some evolution in perceptions of them since the Marquette Law School Poll first started asking about them in 2019. In some cases, such as Alito, both favorable and unfavorable opinions have increased, with unfavorable views growing to roughly equal favorable opinion. Justice Amy Coney Barrett has seen decline in both favorable and unfavorable opinion. Kavanaugh has seen a similar decline in both positive and negative views. Roberts has seen a convergence of opinion, from initially having considerably higher favorable than unfavorable ratings to declining favorable and rising unfavorable views, which are now close to equal. Thomas has also gone from initially having more favorable than unfavorable opinions to the reverse. These trends in views of the justices are shown in Figure 2.
While the justices are less familiar to the public than many political figures, the public nonetheless views them through partisan lenses. Democrats consistently have net positive favorability to the three liberal members of the Court, while Republicans are consistently net positive toward the six conservative justices. The degrees of partisan division over the justices vary, with larger divisions over Kavanaugh and Thomas, and, to a lesser degree, over Sotomayor, while Chief Justice Roberts shows the least partisan differences. In Alito’s case, the partisan divide has widened, while in Barrett’s case the partisans have moved somewhat closer. For other justices, partisan divides have remained relatively constant since 2019. These opinions are shown in Figure 3.
About the Marquette Law School Poll
The survey was conducted July 22-29, 2026, interviewing 1,076 adults nationwide, with a margin of error of +/-3.2 percentage points.
Wording of questions about recent Supreme Court decisions: These items do not attempt to exactly frame the particular issues in specific cases but rather address the topic in more general terms. The questions were worded as follows:
- In June, the Supreme Court held that children born in the United States to parents unlawfully or temporarily present in the country are U.S. citizens at birth under the 14th Amendment. How much do you favor or oppose this decision?
- In June, in two cases the Supreme Court interpreted federal law to allow restrictions favored by the Trump administration on those seeking asylum in the United States. How much do you favor or oppose this decision?
- In June, the Supreme Court upheld a state law that permits the counting of mail-in ballots postmarked by Election Day but received up to five days later. How much do you favor or oppose this decision?
- In June, the Supreme Court struck down a federal law limiting the amount of money that political parties can spend in coordination with a candidate for office, as a violation of the First Amendment. How much do you favor or oppose this decision?
- In April, the U.S. Supreme Court ruled that the Voting Rights Act of 1965 generally does not require states to create congressional districts where nonwhite voters are in the majority, and that Louisiana’s having done so to protect the ability of Blacks to elect candidates of their choice therefore was a racial gerrymander violating the 14th Amendment’s equal protection clause. How much do you favor or oppose this decision?
- In June, the Supreme Court overruled a 1935 precedent and held that federal laws barring the president from removing members of federal regulatory agencies, like the Federal Trade Commission, except for cause, violate the constitutional separation of powers. How much do you favor or oppose this decision?
- In June, the Supreme Court rejected President Trump’s request to overturn a lower court order that prevented him from removing a member of the Federal Reserve board of governors. How much do you favor or oppose this decision?
- In February, the U.S. Supreme Court ruled that President Trump did not have the authority to impose tariffs under the International Emergency Economic Powers Act (IEEPA). How much do you favor or oppose this decision?
- In June, the Supreme Court held that a federal law making it a felony for any “unlawful user” of illegal drugs to have a gun is a violation of the Second Amendment. How much do you favor or oppose this decision?
- In June, the Supreme Court ruled that state laws that prohibit transgender girls and women from participating on girls’ and women’s sports teams do not violate the equal protection clause of the 14th Amendment. How much do you favor or oppose this decision?
- A Colorado law restricts mental health therapists from trying to change the gender identity or sexual orientation of clients under age 18, often called “conversion therapy.” In March, the Supreme Court ruled that Colorado’s law banning conversion therapy, as applied to talk therapy, regulates speech based on viewpoint, and the lower courts erred by failing to apply sufficiently rigorous First Amendment scrutiny. How much do you favor or oppose this decision?
- In June, the Supreme Court held that an individual has a reasonable expectation of privacy in information about their cell phone’s location, and police have to comply with the Fourth Amendment’s limitations in demanding that information from a tech company. How much do you favor or oppose this decision?
- The Supreme Court announced that it will not hear an appeal by President Donald Trump seeking review of the $5 million jury verdict entered against him in the sexual abuse and defamation case filed by journalist E. Jean Carroll. How much do you favor or oppose this decision?
Interviews were conducted using the SSRS Opinion Panel, a national probability sample with interviews conducted online. Certain other data from this survey (focusing on national political topics) were released on Aug. 5. The detailed methodology statement, survey instrument, topline results, and crosstabs for this release are available on the Marquette Law School Poll website.