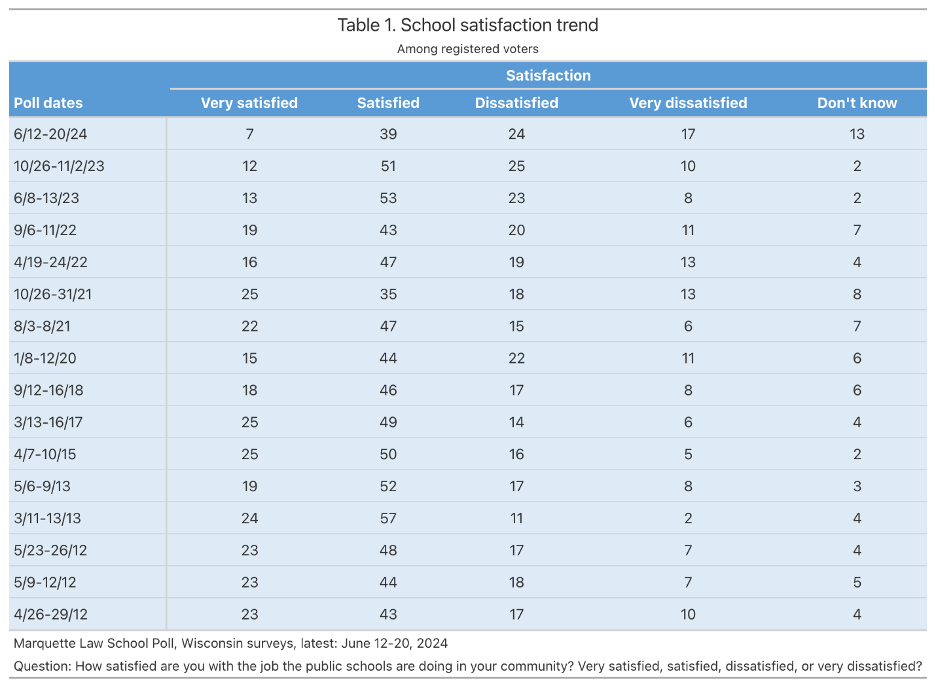
MILWAUKEE — A Marquette University Law School Poll survey of registered voters across Wisconsin this summer found 46% of respondents expressing satisfaction with the public schools in their community, down from 63% in a poll asking the same question in October 2023.
Seven percent in summer 2024 were “very satisfied” with their public schools, down from 12% last fall. In the latest poll, 39% reported themselves “satisfied,” compared to 51% last fall. This summer’s survey was conducted June 12-20, 2024, interviewing 871 Wisconsin registered voters, with a margin of error of +/-4.6 percentage points.
Overall, the June levels of satisfaction with public schools “in your community” were the lowest in any of the 16 Marquette Law School Poll surveys that have asked that question of Wisconsin adults, going back to 2012. Over the previous polls, before this survey’s 46%, the lowest satisfaction total was 59% (January 2020). That total included at least 15% who said they were “very satisfied” in each survey prior to 2023.
The June 2024 poll found 41% were dissatisfied with the public schools in their Wisconsin community, including 17% who said they were very dissatisfied. The dissatisfied percentage was the highest on record. Another 13% of those in this summer’s poll gave no opinion, a shift from previous surveys, which had not previously surpassed 8% without an opinion. The full trend in satisfaction with public schools is shown in Table 1.
All results in the tables are stated as percentages; the precise wording of the questions can be found in the online link noted above.
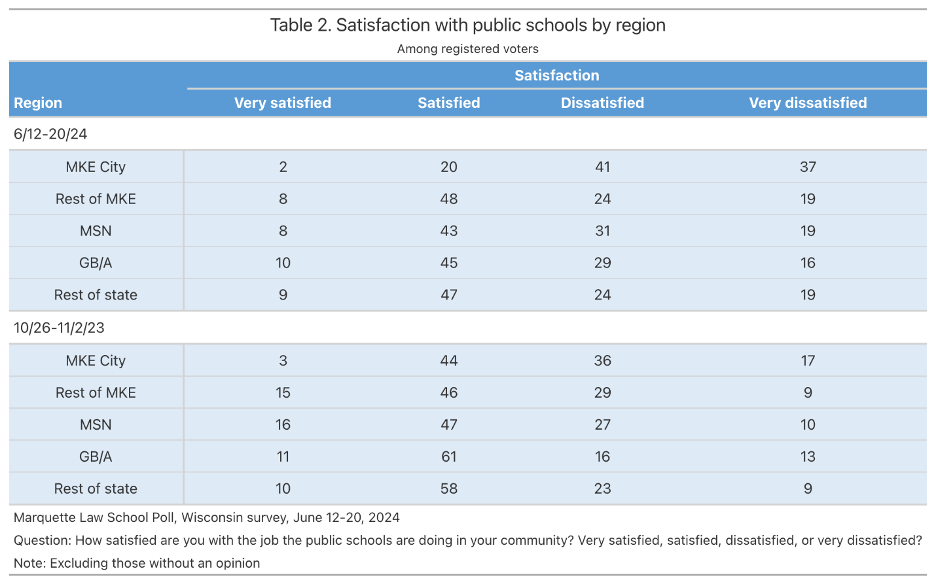
“The rise in dissatisfaction is seen across all regions of the state, but especially in the city of Milwaukee, where more than three-quarters reported dissatisfaction,” said Charles Franklin, director of the Marquette Law School Poll. In the latest poll, among those surveyed who live in the city of Milwaukee, 2% said they were very satisfied with the public schools, 20% were satisfied, 41% were dissatisfied, and 37% were very dissatisfied. In other parts of Wisconsin—including the rest of the Milwaukee metropolitan area, the Madison area, and the Green Bay area—between 51% and 56% expressed satisfaction, including 8% to 10% of voters who were very satisfied. Table 2 shows opinion by region.
The survey in June was conducted while management issues for Milwaukee Public Schools were attracting major attention and the MPS superintendent had resigned abruptly, but dissatisfaction with public schools has been consistently higher over time in the city of Milwaukee than in the rest of Wisconsin. In the October 2023 survey, 3% of Milwaukee residents said they were very satisfied, 44% said they were satisfied, 36% were dissatisfied, and 17% were very dissatisfied.
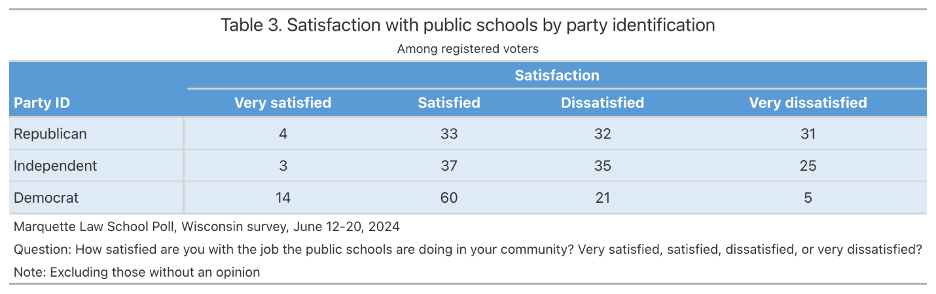
There was a large difference in the summer 2024 poll in satisfaction between Wisconsinites who identified as Republicans and those who identified as Democrats. Among Democrats, 74% said they were very satisfied or satisfied with their Wisconsin community’s public schools, while 26% were dissatisfied or very dissatisfied. Among Republicans in Wisconsin, 37% were very satisfied or satisfied, while 63% were dissatisfied or very dissatisfied. Only 5% of Democrats were very dissatisfied, whereas 31% of Republicans were very dissatisfied.
Franklin said the partisan gap in school satisfaction was modest in 2012 to 2020 and grew larger from 2021 to this year, which has seen the largest gap. Current satisfaction is shown by party identification in Table 3.
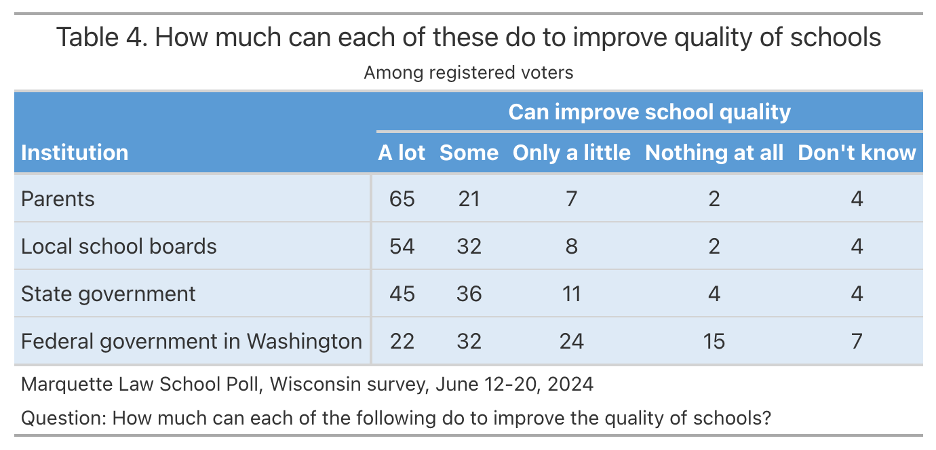
In June, more than 80% of Wisconsin voters felt that parents, local school boards, and state government could do a lot or do some to improve the quality of schools. Overall opinion was lower when it came to the question of how much the federal government could do to improve schools.
Specifically, 65% of the surveyed Wisconsin voters said parents could do a lot to improve schools and 21% said they could do some. As for school boards, 54% said they could do a lot and 32% said they could do some, while 45% said state government could do a lot and 36% said the state could do some. For the federal government, just 22% said it could do a lot and 32% said it could do some. These results are shown in Table 4.
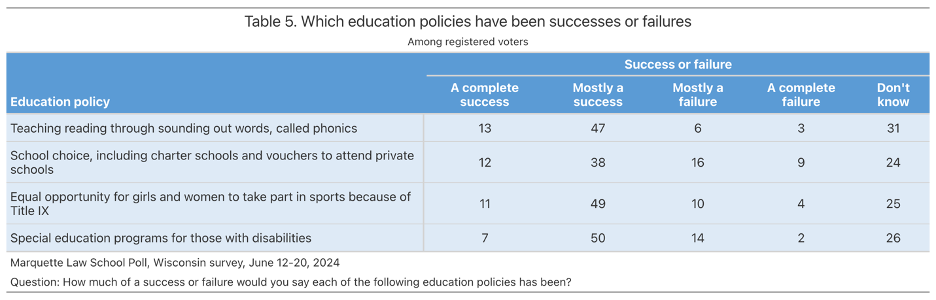
The survey asked whether people thought that four major educational policy developments in recent years were successful.
For the use of phonics-based reading instruction, which emphasizes teaching students to sound out letters and words, 60% thought that it was very successful or successful, while 9% thought it was mostly a failure or a total failure. Another 31% said they did not know.
Asked about school choice, 50% said that it was a complete success or mostly a success, while 25% said it was mostly a failure or a total failure and 24% said they did not know. The question did not define the term “school choice,” but it is often taken to focus on publicly funded vouchers for students to attend private schools.
Federal legislation known as Title IX has been a total success or mostly a success in the opinion of 60% of those polled, while 14% said Title IX has been mostly a failure or a total failure. Another 25% said they didn’t know. Title IX bars discrimination in education based on sex and is best known for spurring major growth in girls’ and women’s sports programs over the past five decades.
Finally, special education programs were regarded as a total success or mostly a success by 57% of those polled, while 16% thought such programs were mostly a failure or a total failure and 26% said they did not know.
About the Marquette Law School Poll
The Marquette Law School Poll is the most extensive statewide polling project in Wisconsin history. This survey was conducted June 12-20, 2024, interviewing 871 Wisconsin registered voters, with a margin of error of +/-4.6 percentage points.
The survey was conducted with a hybrid sample of 637 respondents selected from the Wisconsin voter registration list, and 234 selected from the SSRS Opinion Panel, a sample drawn from postal addresses across the state and invited to take part in surveys online. The interview was conducted online with 769 respondents and by telephone with a live interviewer with 102. Full details of the methodology are contained in the methodology statement at the link below.
The partisan makeup of the sample is 31% Republican, 29% Democratic, and 40% independent.
The entire questionnaire, methodology statement, full results and breakdowns by demographic groups are available on the Marquette Law School Poll website.
Majority of those polled view justices’ decisions as motivated mostly by politics, while opinion is divided on the Court’s honesty and ethics
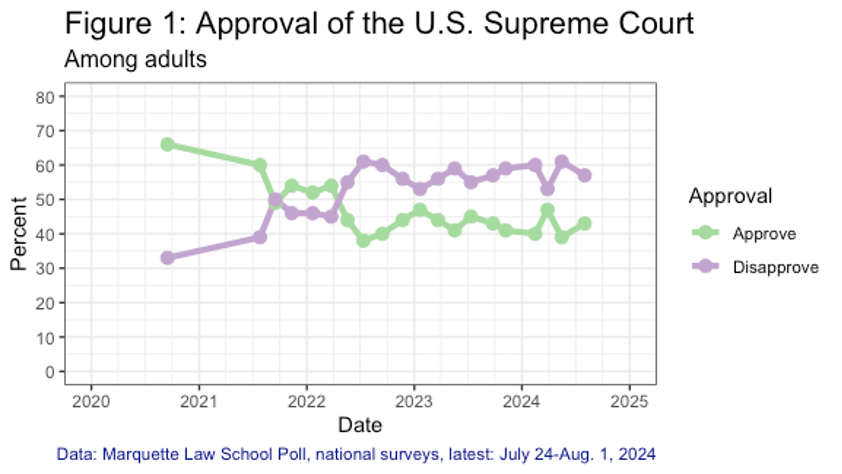
MILWAUKEE – A new Marquette Law School Poll national survey finds that 43% of adults approve of the job the U.S. Supreme Court is doing, while 57% disapprove. In May, approval was 39% and disapproval was 61%.
The trend in approval since 2020 is shown in Figure 1 and Table 1. (All results in the tables are stated as percentages; the precise wording of the questions can be found in the online link noted above.)
Table 1: U.S. Supreme Court approval
Among Adults
Poll dates
Approval
Approve
Disapprove
7/24-8/1/24
43
57
5/6-15/24
39
61
3/18-28/24
47
53
2/5-15/24
40
60
11/2-7/23
41
59
9/18-25/23
43
57
7/7-12/23
45
55
5/8-18/23
41
59
3/13-22/23
44
56
1/9-20/23
47
53
11/15-22/22
44
56
9/7-14/22
40
60
7/5-12/22
38
61
5/9-19/22
44
55
3/14-24/22
54
45
1/10-21/22
52
46
11/1-10/21
54
46
9/7-16/21
49
50
7/16-26/21
60
39
9/8-15/20
66
33
Marquette Law School Poll, national surveys, latest: July 24-Aug. 1, 2024
Question: Overall, how much do you approve or disapprove of the way the U.S. Supreme Court is handling its job?
The latest Marquette Law School Poll’s national Supreme Court survey was conducted July 24-Aug. 1, 2024. The survey interviewed 1,005 adults nationwide and has a margin of error of +/-4 percentage points.
Public opinion about recent decisions
The poll asked about seven recent decisions of the Supreme Court:
Large majorities of the public favor the ruling that it does not violate the Second Amendment for the government to take guns away from people subject to domestic violence restraining orders from a court (U.S. v. Rahimi).
Two-thirds favor the decision that maintained access to a widely available abortion pill, mifepristone, and rejected a bid from a group seeking to undo the Food and Drug Administration’s approval of the pill (FDA v. Alliance for Hippocratic Medicine).
A small majority favors the decision that upheld city ordinances that prohibit people who are homeless from sleeping and camping on public property, ruling that such ordinances do not constitute cruel and unusual punishment prohibited by the Constitution (City of Grants Pass, Oregon v. Johnson).
A similar small majority of the public favors a decision that states cannot bar Donald Trump from election ballots based on the 14th Amendment’s insurrection clause (Trump v. Anderson).
A majority opposes the decision that the Bureau of Alcohol, Tobacco, Firearms and Explosives exceeded its statutory authority when it prohibited bump stocks which enable semiautomatic rifles to fire at speeds rivaling those of machine guns (Garland v. Cargill).
A majority also opposes the decision that while there is no immunity for unofficial acts, former presidents have broad immunity from criminal prosecution for official acts as president (Trump v. U.S.)
Two different question wordings were asked on the Court’s decision that overturned the 1984 Chevron decision, which required courts to defer to executive agencies’ reasonable interpretations of ambiguous statutes (the 2024 decision being Loper Bright Enterprises v. Raimondo). A random half-sample was asked Version 1, and the other half-sample was asked Version 2. The majority reverses between the two wordings of the question, with a majority opposed to the ruling when the question simply says the ruling overturns deference to agencies, but a majority favoring the decision when the question adds that courts must exercise independent judgment on statutory interpretation.
When asking about Loper Bright Enterprises v. Raimondo, Version 1, which yielded majority opposition to the Court’s ruling was worded:
In June, the U.S. Supreme Court overturned a 1984 decision that required courts to defer to executive agencies’ reasonable interpretations of ambiguous statutes. How much do you favor or oppose this decision?
Version 2, which found majority support for the ruling, added further description of the ruling:
In June, the U.S. Supreme Court overturned a 1984 decision that required courts to defer to executive agencies’ reasonable interpretations of ambiguous statutes, ruling instead that courts must exercise their independent judgment on all questions of statutory interpretation made by agencies administering statutes. How much do you favor or oppose this decision?
Table 2 summarizes opinion about all seven decisions.
Table 2: Favor or oppose the Court’s decision
Among Adults
Case
Favor or oppose decision
Favor
Oppose
Remove guns from those under restraining order
76
24
Maintain current access to abortion medication
67
33
Overturn deference to executive agencies, wording Version 2
57
43
Restrict homeless camping
55
45
States cannot remove Trump from ballots under 14th Amendment
54
46
Overturn deference to executive agencies, wording Version 1
44
56
Ban on bump stocks exceeded statutory authority
43
57
Presidents have immunity for official acts
41
59
Marquette Law School Poll, national survey, July 24-Aug. 1, 2024
Question: (Description of the decision) Do you favor or oppose this decision?
Note: See complete question wording at end of the release.
Note: Decision on deference to executive agencies was asked, of different half-samples of respondents, with two wordings.
Previous decisions
Among major decisions from earlier terms, a solid majority of the public favors the 2015 decision that the Constitution guarantees a right to same-sex marriage, with 68% approving of that ruling and 32% opposed (Obergefell v. Hodges).
A similarly large majority, 69%, favors the 2022 decision that, subject to some restrictions, the Second Amendment protects an individual’s right to carry a handgun for self-defense outside the home (New York State Rifle & Pistol Association Inc. v. Bruen). The decision is opposed by 31%.
The most controversial opinion of recent years overturned Roe v. Wade, thus striking down the 1973 decision that made abortion legal in all 50 states (Dobbs v. Jackson Women’s Health Organization in 2022). This decision is opposed by 67% and favored by 33%.
Basis of the justices’ decisions
In this latest survey, 57% say the justices’ decisions are motivated mainly by politics, while 43% say decisions are based mainly on the law. In September 2019, 35% said mainly politics and 64% said mainly the law. The percentage saying that politics is the main motivation of justices began increasing in January 2022 and has remained at or above 50% since July 2023. The full trend is shown in Table 3.
Table 3: Are justices’ decisions motivated mainly by the law or mainly by politics
Among Adults
Poll dates
Perceived motivation
Mainly politics
Mainly the law
7/24-8/1/24
57
43
5/6-15/24
56
44
3/18-28/24
50
50
2/5-15/24
54
46
11/2-7/23
55
45
9/18-25/23
52
48
7/7-12/23
58
42
1/9-20/23
49
51
7/5-12/22
52
48
1/10-21/22
47
53
11/1-10/21
30
70
9/7-16/21
39
61
7/16-26/21
29
71
9/8-15/20
37
62
9/3-13/19
35
64
Marquette Law School Poll, national surveys, latest: July 24-Aug. 1, 2024
Question: In general, what most often motivates Supreme Court justices’ decisions?
Among Republicans, 59% say the justices’ decisions are based mainly on the law, whereas 55% of independents and 73% of Democrats say decisions are mainly based on politics. Table 4 shows these results.
Table 4: Justices’ decisions based mainly on law or politics
Among Adults
Party ID
Basis of decisions
Mainly politics
Mainly the law
Total
57
43
Republican
41
59
Independent
55
45
Democrat
73
27
Marquette Law School Poll, national survey, July 24-Aug. 1, 2024
Question: In general, what most often motivates Supreme Court justices’ decisions?
Amid debate about the ethical standards of the Court, the public is more likely to rate the honesty and ethical standards of Supreme Court justices as low or very low (38%) than to rate them as high or very high (27%). The remaining 34% rate the justices’ ethical standards as average. Despite calls for a strengthened code of ethics for justices, opinions about the justices in this respect have not changed much since May 2023, as shown in Table 5.
Table 5: Rate the ethical standards of justices
Among Adults
Poll dates
Rating
Very high/high
Average
Low/Very low
7/24-8/1/24
27
34
38
2/5-15/24
27
37
36
11/2-7/23
28
39
34
9/18-25/23
30
41
29
7/7-12/23
32
33
35
5/8-18/23
26
39
35
Marquette Law School Poll, national surveys, latest: July 24-Aug. 1, 2024
Question: How would you rate the honesty and ethical standards of U.S. Supreme Court justices?
Attention to news about the Court
Table 6 shows the trend in attention to news about the Court from September 2023 to July 2024. Few respondents had heard a lot about the Court in the past month in either September or November, but there has been some increase since. Following major decisions at the end of the term in late June and on July 1, awareness of news about the Court increased in July. Even so, more than half in each poll since September say they’ve heard only a little about the Court in the last month.
Table 6: Attention to news about the Court
Among Adults
Poll dates
How much heard or read
A lot
A little
Nothing at all
7/24-8/1/24
32
54
14
5/6-15/24
27
52
21
3/18-28/24
30
50
19
2/5-15/24
24
56
20
11/2-7/23
15
60
25
9/18-25/23
17
61
22
Marquette Law School Poll, national surveys, latest: July 24-Aug. 1, 2024
Question: Thinking about the last month only, how much have you heard or read about the U.S. Supreme Court?
The Court has had a majority of justices appointed by Republican presidents since 1970, a span of nearly 54 years, with the exception of a 14-month vacancy in 2016-17 which created a 4-4 tie in terms of such appointments. The current Court has six justices appointed by Republicans and three appointed by Democrats. Nonetheless, 24% of adults believe a majority of justices were definitely or probably appointed by Democratic presidents. Forty-one percent say a majority were probably appointed by Republican presidents and 35% say the majority were definitely appointed by Republicans. This opinion has varied modestly since 2019, as shown in Table 7.
Table 7: Majority of Court appointed by which party’s presidents
Among Adults
Poll dates
Majority appointed by
Definitely/Probably Dem majority
Probably Rep majority
Definitely Rep majority
7/24-8/1/24
24
41
35
5/6-15/24
28
40
33
3/18-28/24
25
43
32
2/5-15/24
29
38
33
11/2-7/23
26
43
30
9/18-25/23
26
42
32
7/7-12/23
22
42
36
5/8-18/23
29
41
30
3/13-22/23
27
41
31
1/9-20/23
23
41
36
11/15-22/22
24
40
35
9/7-14/22
22
40
37
7/5-12/22
20
40
40
5/9-19/22
31
39
31
3/14-24/22
28
47
24
1/10-21/22
23
44
33
11/1-10/21
28
44
28
9/7-16/21
25
46
29
7/16-26/21
24
45
30
9/8-15/20
28
51
21
9/3-13/19
27
53
19
Marquette Law School Poll, national surveys, latest: July 24-Aug. 1, 2024
Question: What is your guess as to whether a majority of the current U.S. Supreme Court justices were appointed by Democratic or Republican presidents?
Knowledge of which party’s presidents have appointed a majority of the Court varies by party, with 26% of Republicans saying there is definitely a majority appointed by Republicans. Many more Democrats, 47%, say there is definitely a majority of Republican appointees. Likewise, 33% of Republicans say a majority were definitely or probably appointed by Democrats, while 14% of Democrats believe a majority were appointed by Democratic presidents. The full results are shown in Table 8.
Table 8: Majority of Court appointed by which party’s presidents, by party identification
Among Adults
Party ID
Majority appointed by
Definitely/Probably Dem majority
Probably Rep majority
Definitely Rep majority
Total
24
41
35
Republican
33
42
26
Independent
34
43
20
Democrat
14
39
47
Marquette Law School Poll, national survey, July 24-Aug. 1, 2024
Question: What is your guess as to whether a majority of the current U.S. Supreme Court justices were appointed by Democratic or Republican presidents?
Confidence in institutions
Confidence in several institutions is summarized in Table 9. Juries in criminal cases enjoy the highest confidence of the five institutions, as well as the lowest percentage of those saying they have little or no confidence. Each of the other institutions has more respondents expressing little or no confidence than a great deal or quite a lot of confidence. The Presidency has the second highest level of confidence, followed by the U.S. Supreme Court.. Congress has the second lowest confidence rating, with 13% expressing a great deal or a lot of confidence and 47% saying they have little or no confidence in Congress. The lowest confidence is in the national new media with just 12% having a great deal or a lot of confidence, and over half, 57%, with little or no confidence.
Table 9: Confidence in institutions
Among Adults
Institution
Confidence
Great deal/a lot
Some
Little/None
Juries that decide criminal cases
39
41
20
The Presidency
32
33
35
U.S. Supreme Court
26
32
42
Congress
13
40
47
National news media
12
31
57
Marquette Law School Poll, national survey, July 24-Aug. 1, 2024
Question: Here is a list of institutions in American society. How much confidence do you have in each one?
As approval of the Supreme Court has declined, so has confidence in the Court. In 2019, 39% had a great deal or a lot of confidence in the Court, while 16% had little or no confidence. In this July poll, the balance has sharply reversed, with 26% having a great deal or a lot of confidence while 42% have little or no confidence. The full trend is shown in Table 10.
Table 10: Confidence in the Supreme Court, 2019-2024
Among Adults
Poll dates
Confidence
Great deal/a lot
Some
Little/None
7/24-8/1/24
26
32
42
5/6-15/24
24
37
40
3/18-28/24
30
37
33
2/5-15/24
25
35
40
11/2-7/23
28
36
36
9/18-25/23
28
37
35
7/7-12/23
31
32
37
5/8-18/23
25
36
39
3/13-22/23
28
40
32
1/9-20/23
31
38
31
11/15-22/22
30
36
34
9/7-14/22
30
34
36
7/5-12/22
28
28
44
9/8-15/20
39
45
16
9/3-13/19
37
42
20
Marquette Law School Poll, national surveys, latest: July 24-Aug. 1, 2024
Question: Here is a list of institutions in American society. How much confidence do you have in each one?
Perceived ideological leaning of the Court
In this July survey, 28% describe the Supreme Court as “very conservative,” 30% describe it as “somewhat conservative,” and 32% call the Court “moderate,” while 7% see the Court as “somewhat liberal” and 3% believe it is “very liberal.”
Views of the Court have shifted to the right since 2019, with fewer seeing the Court as moderate and more seeing it as conservative or very conservative, as shown in Table 11. The shift in perceptions is most apparent in May and July 2022, around the time of news of the Dobbs decision overturning the Roe v. Wade abortion rights decision.
Table 11: Perceived ideological leaning of the Court, 2019-2024
Among Adults
Poll dates
Perceived ideology
Very conservative
Somewhat conservative
Moderate
Somewhat liberal
Very liberal
7/24-8/1/24
28
30
32
7
3
5/6-15/24
25
32
31
10
2
3/18-28/24
25
32
33
8
3
2/5-15/24
21
34
33
7
5
11/2-7/23
21
35
32
7
5
9/18-25/23
20
37
32
7
3
7/7-12/23
27
35
28
7
3
5/8-18/23
24
33
30
10
3
3/13-22/23
23
35
34
6
2
1/9-20/23
22
37
31
8
2
11/15-22/22
25
36
32
6
2
9/7-14/22
29
35
27
5
3
7/5-12/22
34
33
21
7
3
5/9-19/22
23
33
34
8
2
3/14-24/22
15
37
36
10
2
1/10-21/22
17
38
35
8
2
11/1-10/21
15
35
39
8
1
9/7-16/21
16
35
40
7
2
7/16-26/21
13
37
42
6
1
9/8-15/20
5
30
54
9
2
9/3-13/19
5
33
50
9
3
Marquette Law School Poll, national surveys, latest: July 24-Aug. 1, 2024
Question: In general, would you describe each of the following… The U.S. Supreme Court
About the Marquette Law School Poll
The survey was conducted July 24-Aug. 1, 2024, interviewing 1005 adults nationwide, with a margin of error of +/-4 percentage points. Interviews were conducted using the SSRS Opinion Panel, a national probability sample with interviews conducted online. The detailed methodology statement, survey instrument, topline results, and crosstabs for this release are available on the Marquette Law Poll website. Some items from this survey concerning the 2024 presidential election were released previously, on Aug. 8.
Wording of questions about recent and past Supreme Court decisions: These items do not attempt to exactly frame the particular issues in specific cases but rather address the topic in more general terms.
The wording of questions about recent decisions includes:
U.S. v. Rahimi
In June, the U.S. Supreme Court ruled that it does not violate the Second Amendment for the government to take guns away from people subject to domestic violence restraining orders from a court. How much do you favor or oppose this decision?
Food and Drug Administration v. Alliance for Hippocratic Medicine
In June, the U.S. Supreme Court maintained access to a widely available abortion pill, mifepristone, rejecting a bid from a group seeking to undo the Food and Drug Administration’s approval of the pill. How much do you favor or oppose this decision?
City of Grants Pass, Oregon v. Johnson
In June, the U.S. Supreme Court upheld city ordinances that prohibit people who are homeless from sleeping and camping on public property, ruling that such ordinances do not constitute cruel and unusual punishment prohibited by the Constitution. How much do you favor or oppose this decision?
Trump v. Anderson
In March, the U.S. Supreme Court ruled that states cannot bar Donald Trump from election ballots based on the 14th Amendment’s insurrection clause. How much do you favor or oppose this decision?
Loper Bright Enterprises v. Raimondo
Version 1: In June, the U.S. Supreme Court overturned a 1984 decision that required courts to defer to executive agencies’ reasonable interpretations of ambiguous statutes. How much do you favor or oppose this decision?
Version 2: In June, the U.S. Supreme Court overturned a 1984 decision that required courts to defer to executive agencies’ reasonable interpretations of ambiguous statutes, ruling instead that courts must exercise their independent judgment on all questions of statutory interpretation made by agencies administering statutes. How much do you favor or oppose this decision?
Garland v. Cargill
In June, the U.S. Supreme Court ruled that the Bureau of Alcohol, Tobacco, Firearms and Explosives had exceeded its statutory authority when it prohibited bump stocks, which enable semiautomatic rifles to fire at speeds rivaling those of machine guns. How much do you favor or oppose this decision?
Trump v. U.S.
In July, the U.S. Supreme Court ruled that, while there is no immunity for unofficial acts, former presidents have broad immunity from criminal prosecution for official acts as president. How much do you favor or oppose this decision?
The wording of questions about prior decisions include:
Obergefell v. Hodges
In 2015, the Supreme Court ruled that the Constitution guarantees a right to same-sex marriage. How much do you favor or oppose this decision?
New York State Rifle & Pistol Association Inc. v. Bruen
In 2022, the Supreme Court ruled that, subject to some restrictions, the Second Amendment protects an individual’s right to carry a handgun for self-defense outside the home. How much do you favor or oppose this decision?
Dobbs v. Jackson Women’s Health Organization
In 2022, the Supreme Court overturned Roe v. Wade, thus striking down the 1973 decision that made abortion legal in all 50 states. How much do you favor or oppose this decision?