Americans closely divided in terms of satisfaction with their local public schools, amid notable partisan gap, according to Marquette Law School Poll survey
MILWAUKEE – As a new school year begins across the country, a Marquette University Law School Poll national survey found that Americans are inclined overall to be at least somewhat satisfied with the public schools in their communities, but almost half of Americans are somewhat dissatisfied or very dissatisfied with these public schools.
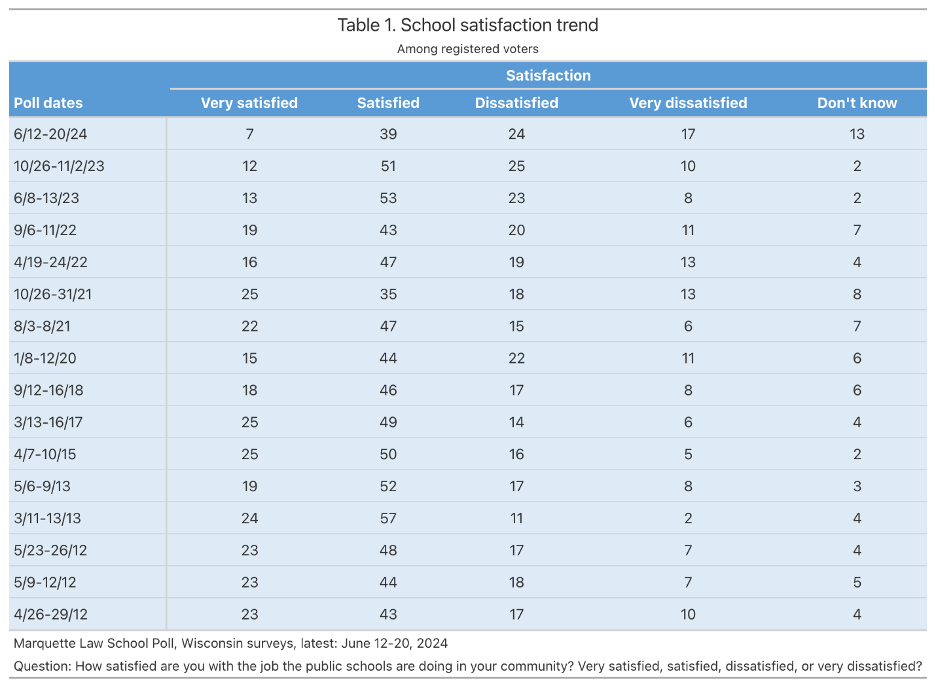
The nationwide poll this summer found that 12% of those surveyed were very satisfied with their community’s public schools, while 37% were somewhat satisfied, totaling 49% on the satisfied side. But 24% were somewhat dissatisfied, and 20% were very dissatisfied, totaling 44% on the dissatisfied side. Seven percent said they didn’t know.
The close-to-evenly-divided results indicate that public schools face challenges, something that can also be seen in local education controversies across the United States.
The Marquette Law School Poll was conducted June 21-24, 2024, interviewing 1,005 adults, with participants selected randomly nationwide and interviewed online. This is the first time the Marquette Law School Poll has asked about school satisfaction in a national poll. However, it has asked such questions 16 times over 12 years in Wisconsin polling, where dissatisfaction with public schools has increased significantly in recent years, as shown in a separate, Wisconsin-specific June 2024 survey, which was the subject of a Marquette Law School Poll release yesterday.
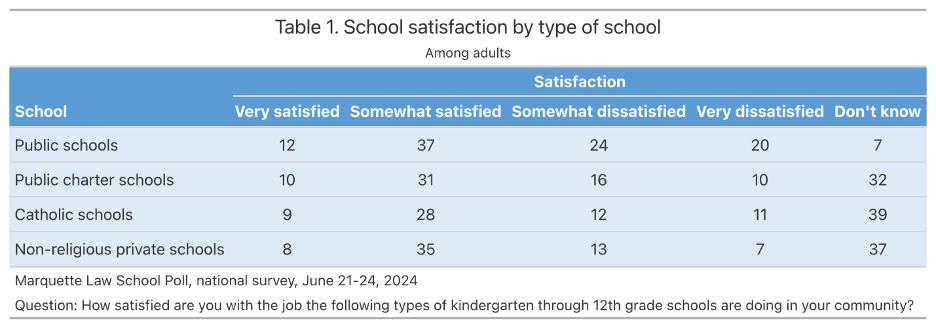
The national poll also asked about respondents’ satisfaction with other schools in their communities.
- Ten percent of respondents said they were very satisfied with public charter schools, 31% said they were somewhat satisfied, 16% were somewhat dissatisfied, and 10% were very dissatisfied, with 32% saying they didn’t know.
- For Catholic schools, 9% were very satisfied, 28% were somewhat satisfied, 12% somewhat dissatisfied, and 11% very dissatisfied, with 39% saying they didn’t know.
- And for non-religious private schools, 8% were very satisfied, 35% somewhat satisfied, 13% somewhat dissatisfied, and 7% very dissatisfied, with 37% saying they didn’t know.
The responses pointed to much more familiarity with public schools than with other school sectors. Table 1 shows satisfaction with the types of schools.
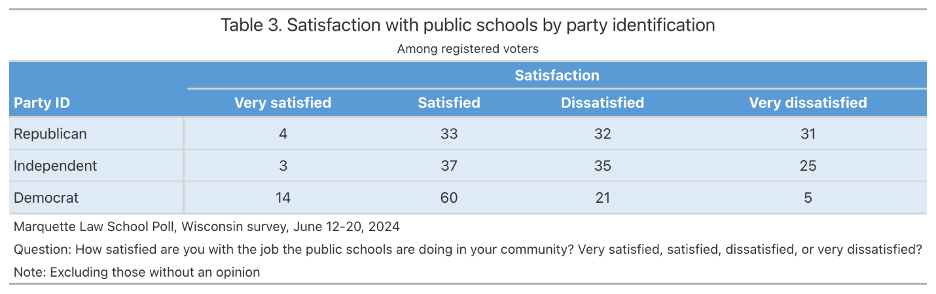
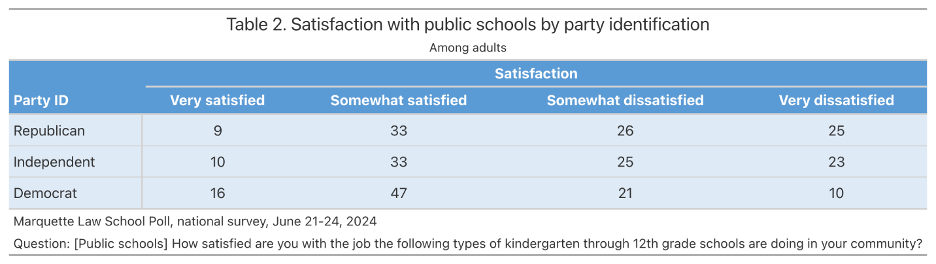
Satisfaction with public schools was higher among those who identified themselves as Democrats than among those who identified themselves as Republicans. Among Democrats, 63% were very satisfied or somewhat satisfied with their community’s public schools, while 10% were very dissatisfied. Among Republicans, 42% were very satisfied or somewhat satisfied, while 25% were very dissatisfied. Table 2 shows satisfaction with public schools by party identification.
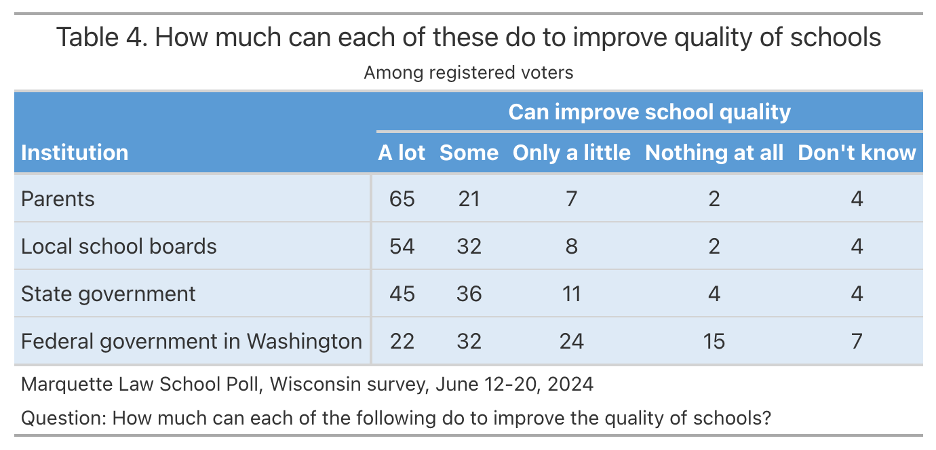
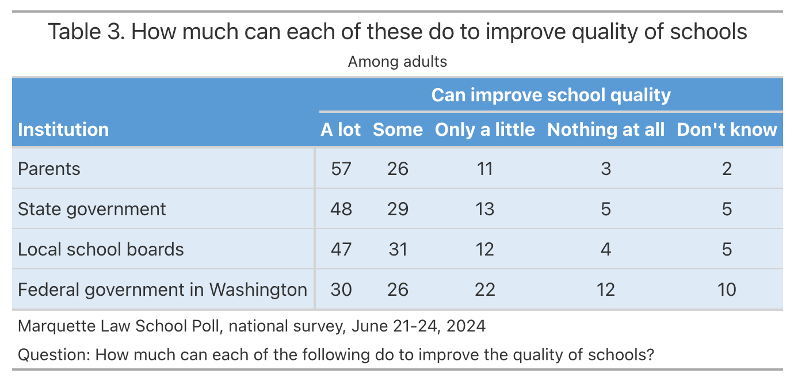
Asked who could help improve education, the nationwide results pointed to parents as the prime choice, with 57% saying parents could do a lot to improve education and 26% saying they could do some. Local school boards and state governments also could do a lot to improve education, those surveyed said. For school boards, 47% of respondents said that these local government entities could do a lot and 31% said they could do some. For state governments, 48% said they could do a lot and 29% said they could do some to improve education.
But expectations for the federal government were lower. Thirty percent said the federal government could do a lot to improve schools and 26% said the federal government could do some. While between 14% and 18% of those polled thought that parents, local school boards, and state governments could do only a little or nothing at all to improve education, a considerably higher number, 34%, thought this to be the case for the federal government. These results are shown in Table 3.
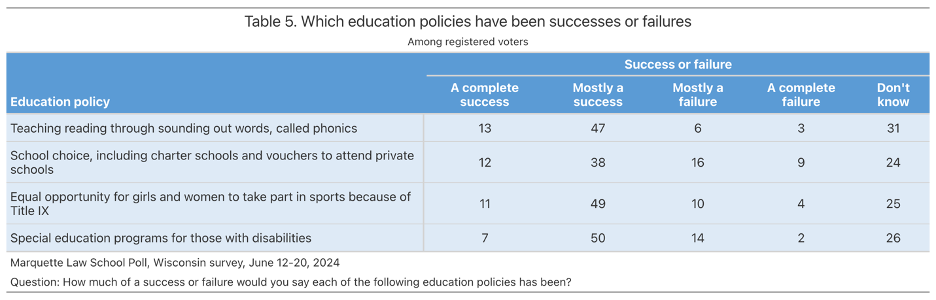
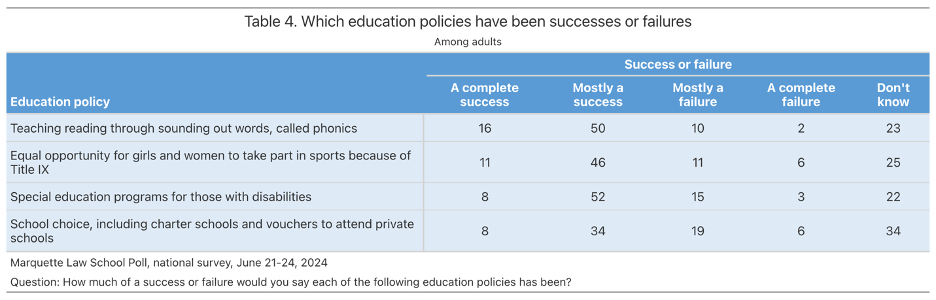
The national sample was asked to judge four major education initiatives.
- Teaching reading by use of phonics (emphasizing sounding out letters and words) has been a complete success in the opinion of 16% of those polled, while 50% said it has been mostly a success. Ten percent called phonics mostly a failure and 2% said it was a complete failure, with 23% saying they didn’t know.
- Eight percent said special education programs have been a complete success, and 52% said they had been mostly a success. Another 15% said they have been mostly a failure, 3% said they have been a complete failure, and 22% said they didn’t know.
- Title IX, the federal program that calls for equal education opportunities by sex (best known for opening the doors to major expansion of girls’ and women’s athletic opportunities), was called a complete success by 11% and mostly a success by 46%. It was called mostly a failure by 11% and a complete failure by 6%, while 25% said they didn’t know.
- Finally, school choice was called a complete success by 8%, mostly a success by 34%, mostly a failure by 19%, and a complete failure by 6%, with 34% saying they didn’t know. The question did not define the term “school choice,” but it often is associated with making public funds available for children to attend private schools.
Table 4 shows these policy evaluations.
The survey was conducted June 21-24, 2024, interviewing 1,005 adults nationwide, with a margin of error of +/-3.5 percentage points. Interviews were conducted using the SSRS Opinion Panel Omnibus, a national probability sample with interviews conducted online. The detailed methodology statement, survey instrument, topline results, and crosstabs for this release are available on the Marquette Law Poll website.