Mitchell Henke and I are pleased to share a new tool mapping the homes and workplaces of American workers. LODESMap.com allows you to quickly visualize how many workers commute between each county, county subdivision, census tract, or block group.
Not only does the tool allow viewers to quickly move between higher and lower levels of aggregation, it also includes data from 21 years in spatially integrated geographies. You can measure how worker flows have changed between two municipalities without worrying if boundary changes confound the comparison. Data is currently available from 2002-2022. We will add 2023 data once it is published by the Census Bureau, likely in September 2025.
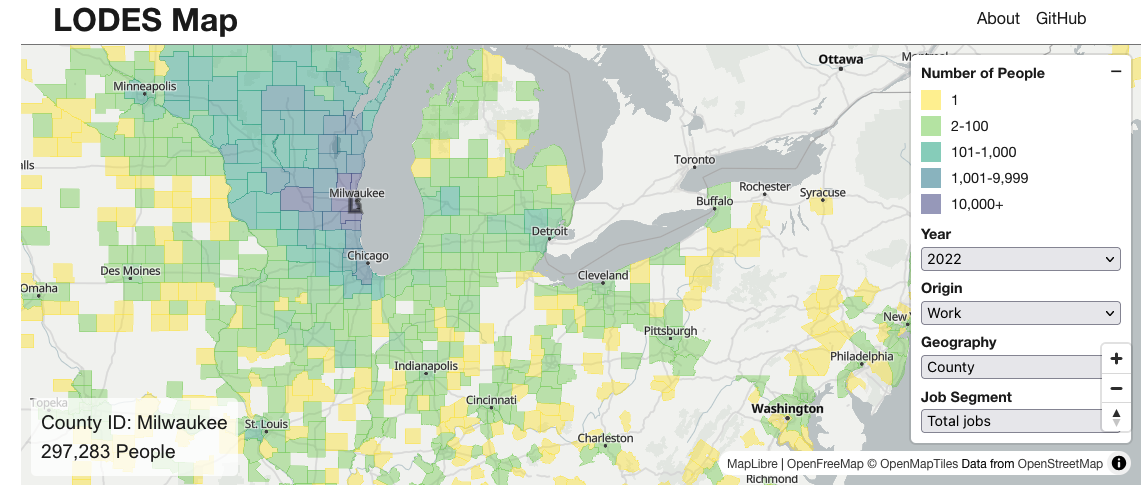
Here is a short demonstration of the tool to get you started.
LODES Map makes it easy to save and share maps by simply copy/pasting the URL, which continuously updates as you pan, zoom, and select different geographies or menu options. Sending someone the URL will show them an identical map to the one you are viewing.
The entire project is open-source. See this technical overview or the Github repository for details. Our technical approach was inspired by Dan Snow’s OpenTimes project.