A Look at 2026 Primary Polling in Wisconsin

Campaigns matter, and a chaotic last month in the Wisconsin Democratic primary is a prime example.

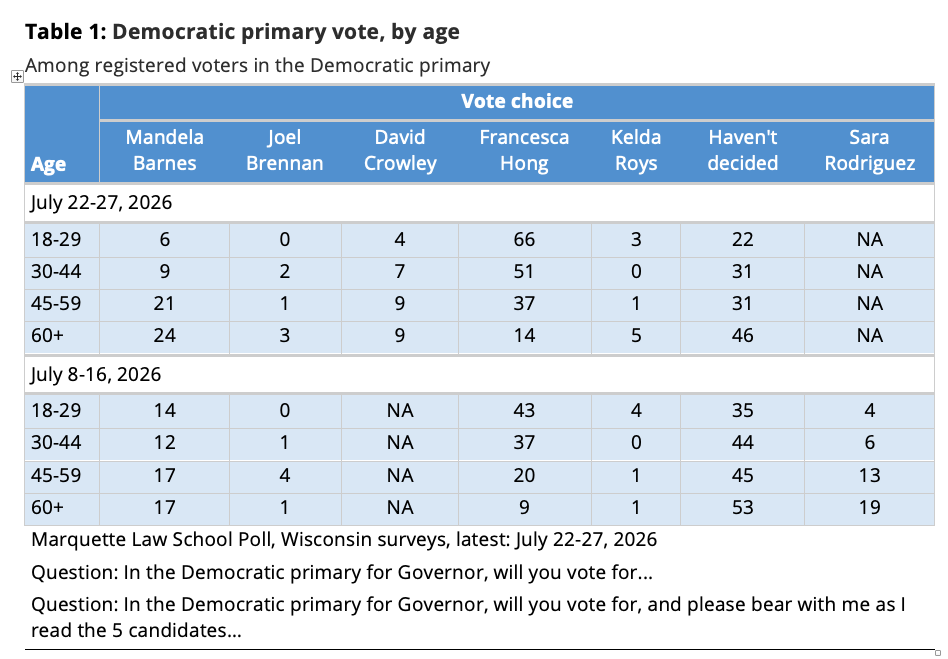
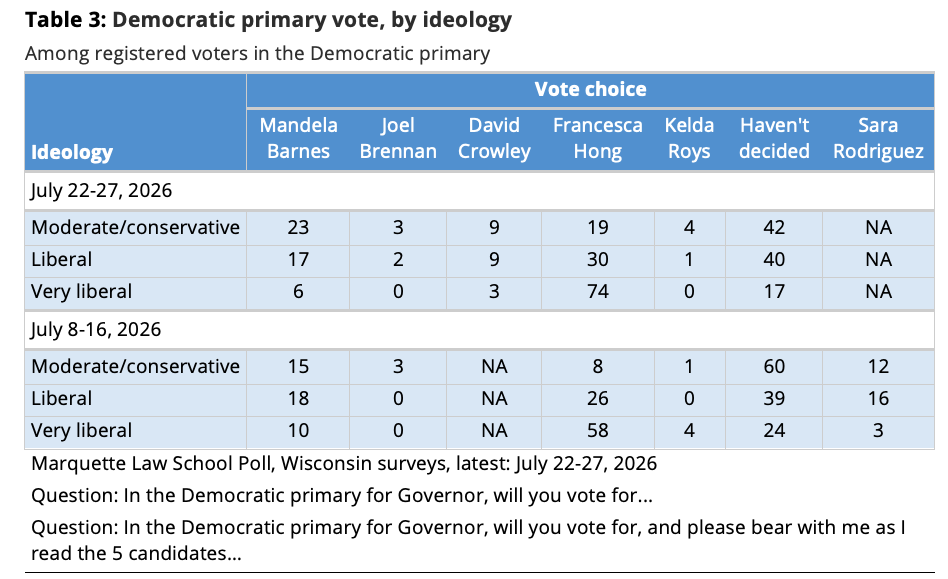
In the Marquette Law School Poll’s final survey of Wisconsin voters, July 22-27, Francesca Hong received 38%. Her unofficial vote total in the August 11 primary election is 39.3%. And 34% said they were undecided. The remarkable difference between poll and outcome was that the poll had David Crowley at 7% and he won with 39.8%. Mandela Barnes, who dropped out three days after the poll was completed, had 16% in the final survey. One clear thing is that the vast majority of late-deciding voters went to Crowley and very few went to Hong.

The race was complicated by three candidates dropping out, and Crowley reentering, in the final month. 

On the demographics of the race, older voters were both the least supportive of Hong and the most undecided age group. They also said they were more likely to vote than did younger voters, providing a potential advantage to Crowley, though they had not settled on him at the time of the final poll.

Another unusual aspect of the race was the very late endorsement of Crowley by Gov. Tony Evers. In our final poll, more than one-third (36%) of Democratic primary voters said that this endorsement made them more likely to support Crowley. Evers’ job approval with Democrats was also over 85%.

Non-response bias is always a potential source of error in polls. In this case, the age and ideological makeup of the survey samples of primary voters was similar to the pre-primary makeup of Democrats, suggesting that young, very liberal, Hong supporters were not overrepresented. Those groups strongly supported her but were not an unusually large share of the samples. Older and moderate voters were more undecided and less supportive of Hong in both of our July polls but had not settled on the very newly returned Crowley at the time of the last survey.

And Hong’s actual vote of 39% was barely different from her 38% in the final poll, further demonstrating that her supporters were not overrepresented in the survey.

Turnout was much larger than in recent Democratic primary contests: an unofficial 792,009, compared to 640,247 in the 2024 Senate primary and 538,857 in the 2018 gubernatorial primary. We don’t know the makeup of that surge beyond the polling results, but this turnout was considerably larger than expected.

On the substantive side, Hong’s performance was generally impressive during most of the campaign, but the late shifts from poll to vote suggest the limits of her appeal. 

Finally, in our mid-July poll (July 8-16), 80% of Democratic primary voters said that it was extremely or very important to nominate a candidate who could win against the Republican in November, and electability became an increasingly common topic in the closing weeks of the campaign. And in the mid-July poll, Hong trailed Republican Tom Tiffany by 3 percentage points, whereas then-candidate Barnes led Tiffany by 4 points (this poll was conducted while Crowley was out of the race). 

The chaotic changes of candidates, plus the governor’s late endorsement and increasing electability concerns, all made for a surprising endgame to the race. 

Note: Below are the tables from the July 29 release showing survey results of the vote and percent undecided, by age and by ideology.
Continue ReadingA Look at 2026 Primary Polling in Wisconsin

Public opinion favors Supreme Court decision limiting Trump tariffs

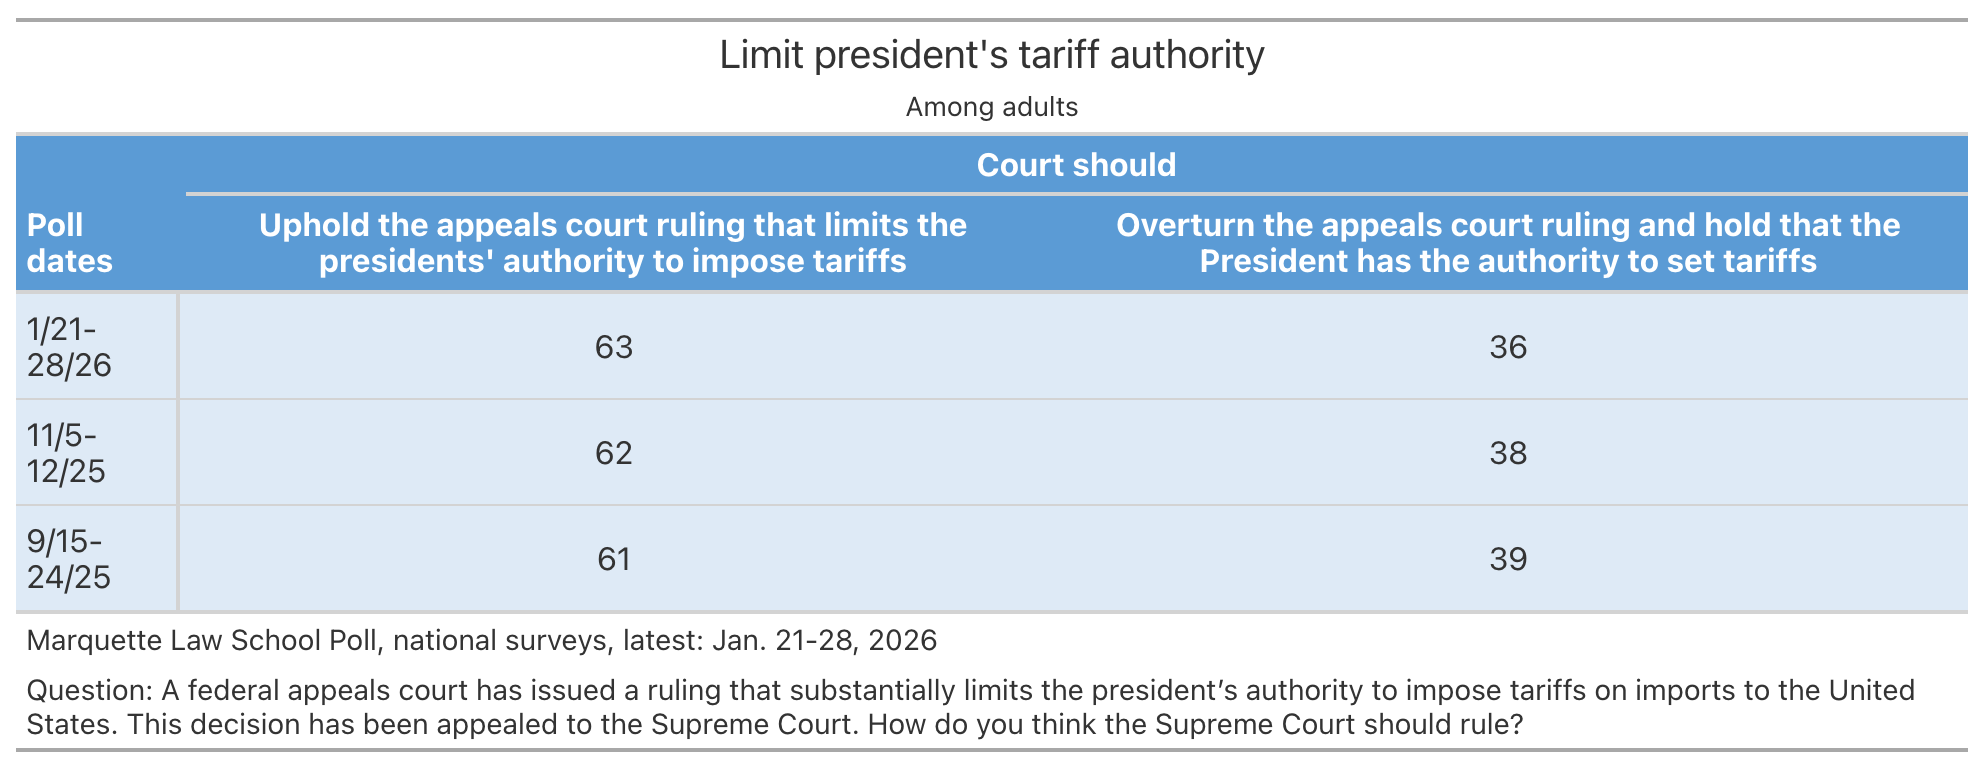
In Jan. 63% said Court should rule against Trump, including 33% of Republicans

On Feb. 20 the United State Supreme Court ruled against President Trump’s authority to impose tariffs under the International Emergency Economic Powers Act of 1977. The case is Learning Resources, Inc. v. Trump.

Public views of the case have been consistently in favor of upholding limits on the tariff authority since the Marquette Law School national poll first asked about this case in September. The table shows opinion over three national surveys.

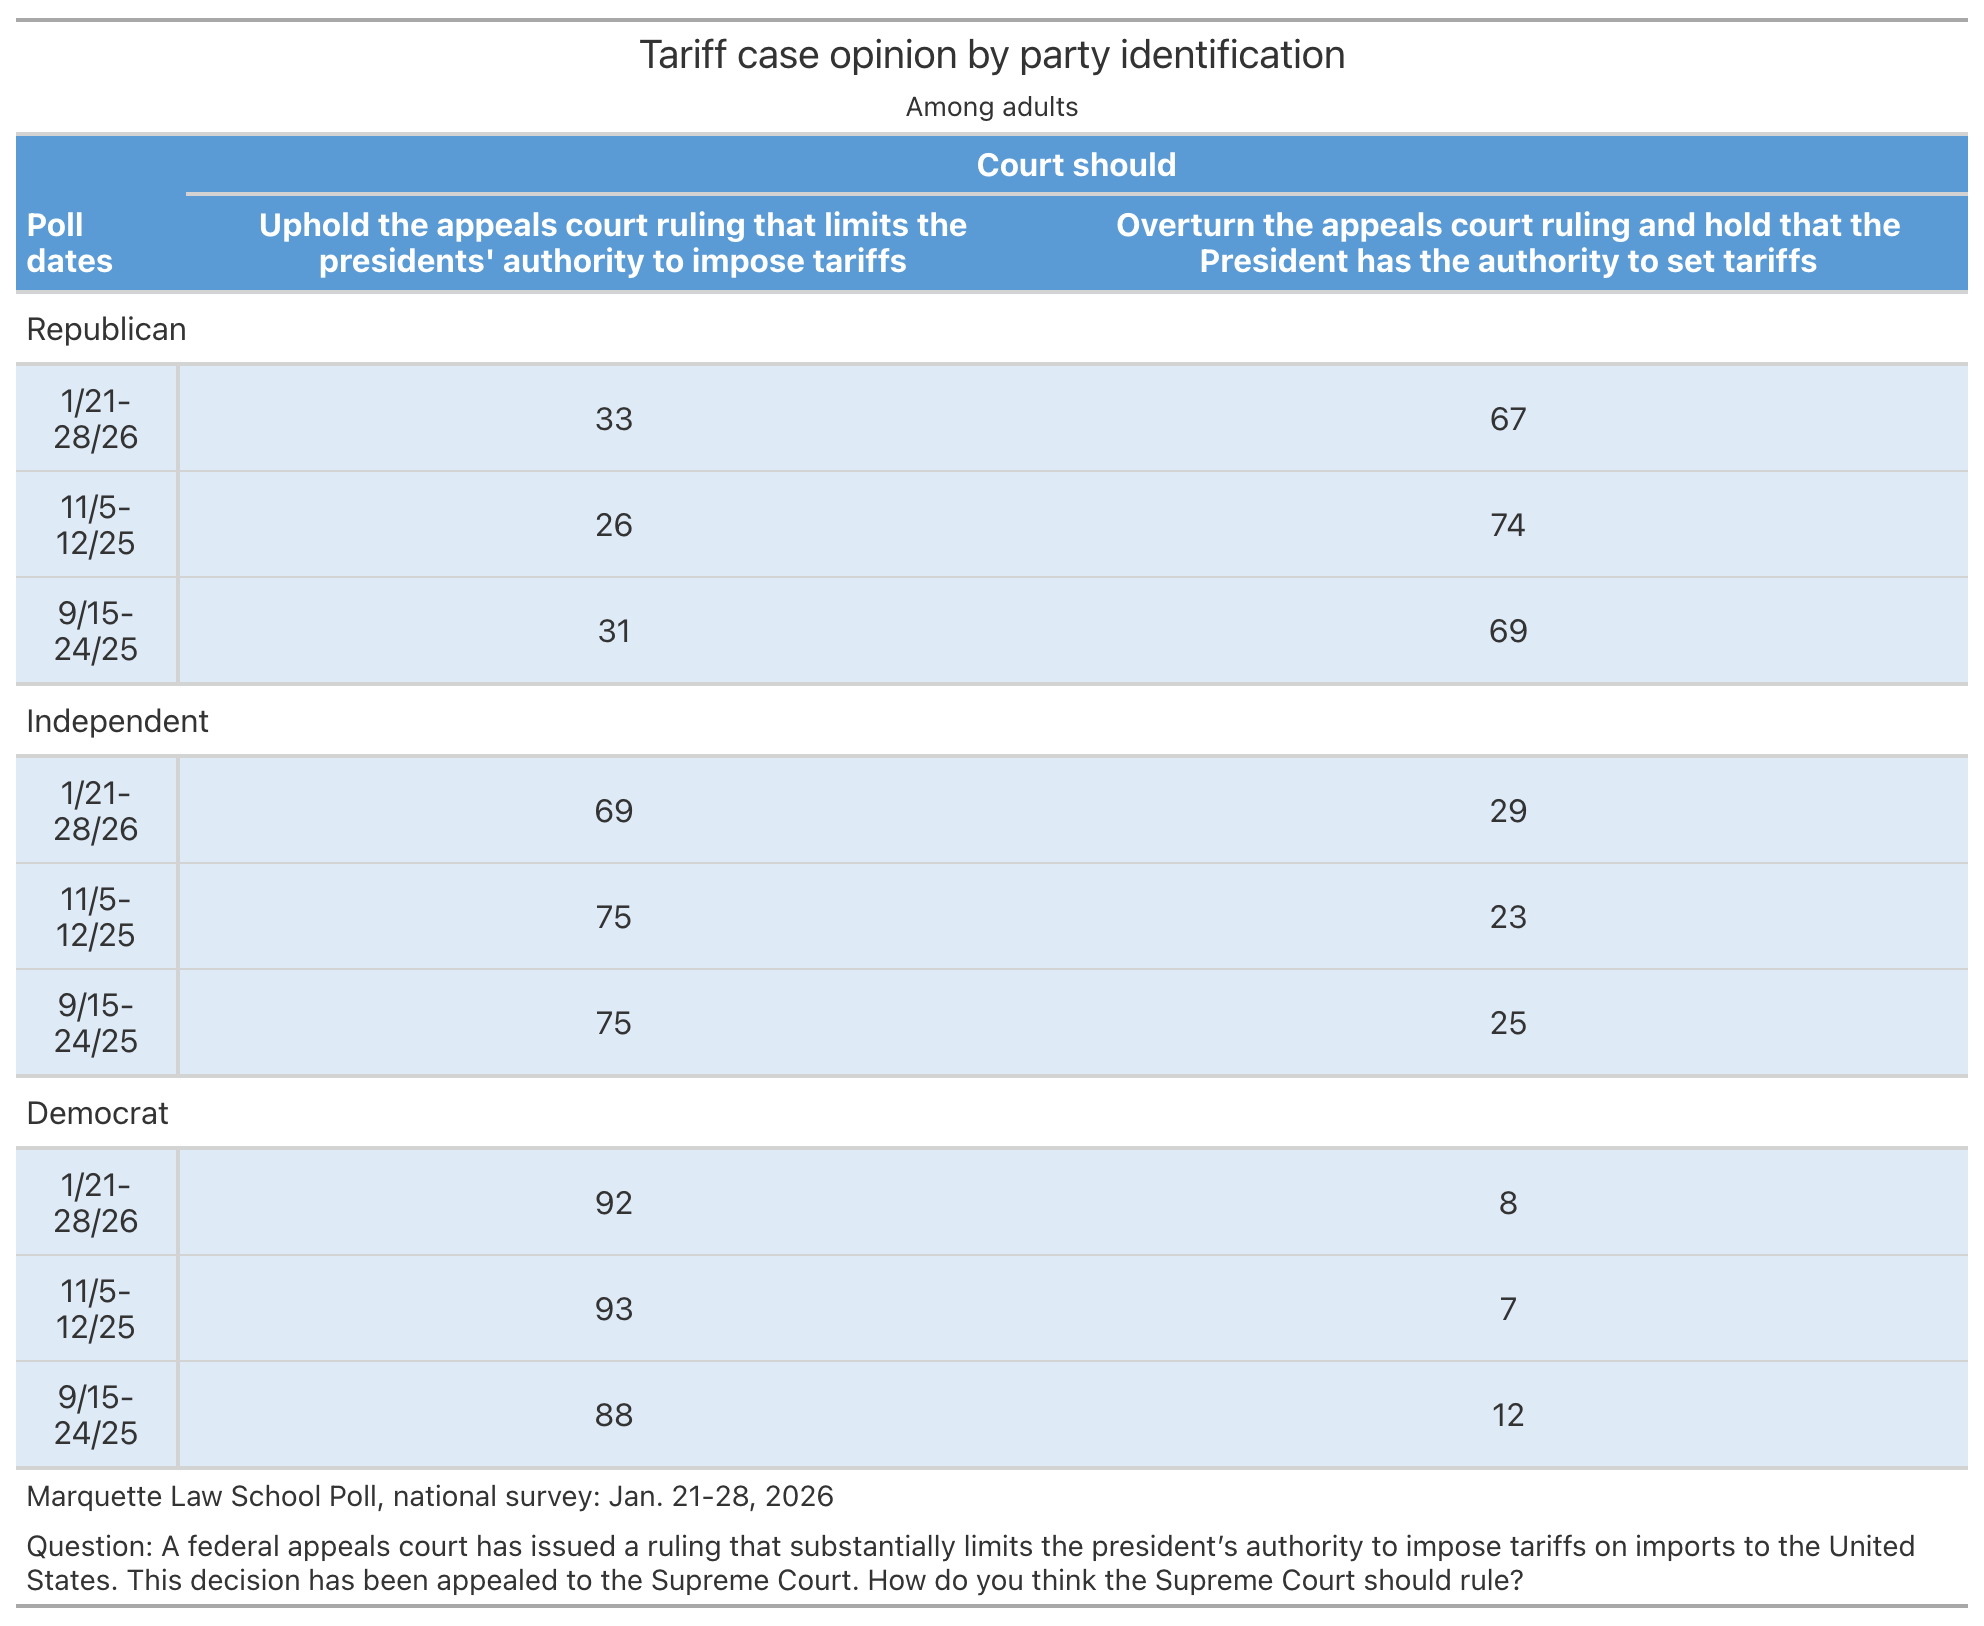
The partisan divide on the tariff case is somewhat less stark than on many issues, with a significant minority of Republicans opposing the president’s position. A third of Republicans in the January poll wanted the Court to strike down the tariffs, an increase from 26% in November. More than two-thirds of independents favored overturning Trump’s use of tariffs, as did an overwhelming 92% of Democrats.

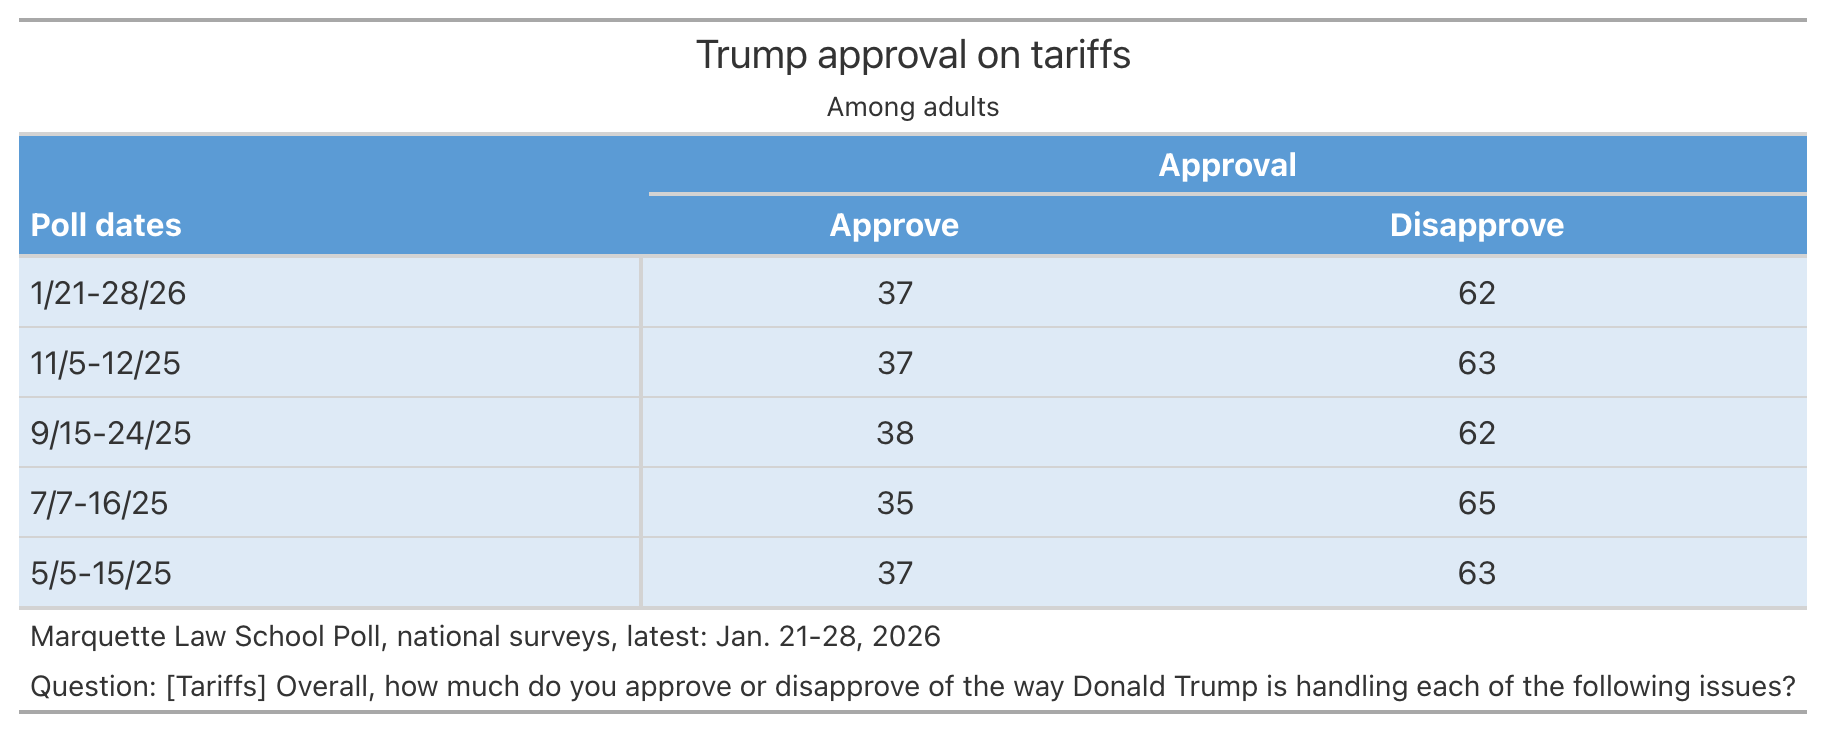
Approval of Trump’s handling of tariffs has consistently been below his overall approval rating in Marquette Law School national polls, with approval on tariffs below 40% in each of five polls since May 2025. In January, 26% of Republicans disapproved of Trump’s handling of tariffs, as did 71% of independents and 95% of Democrats.

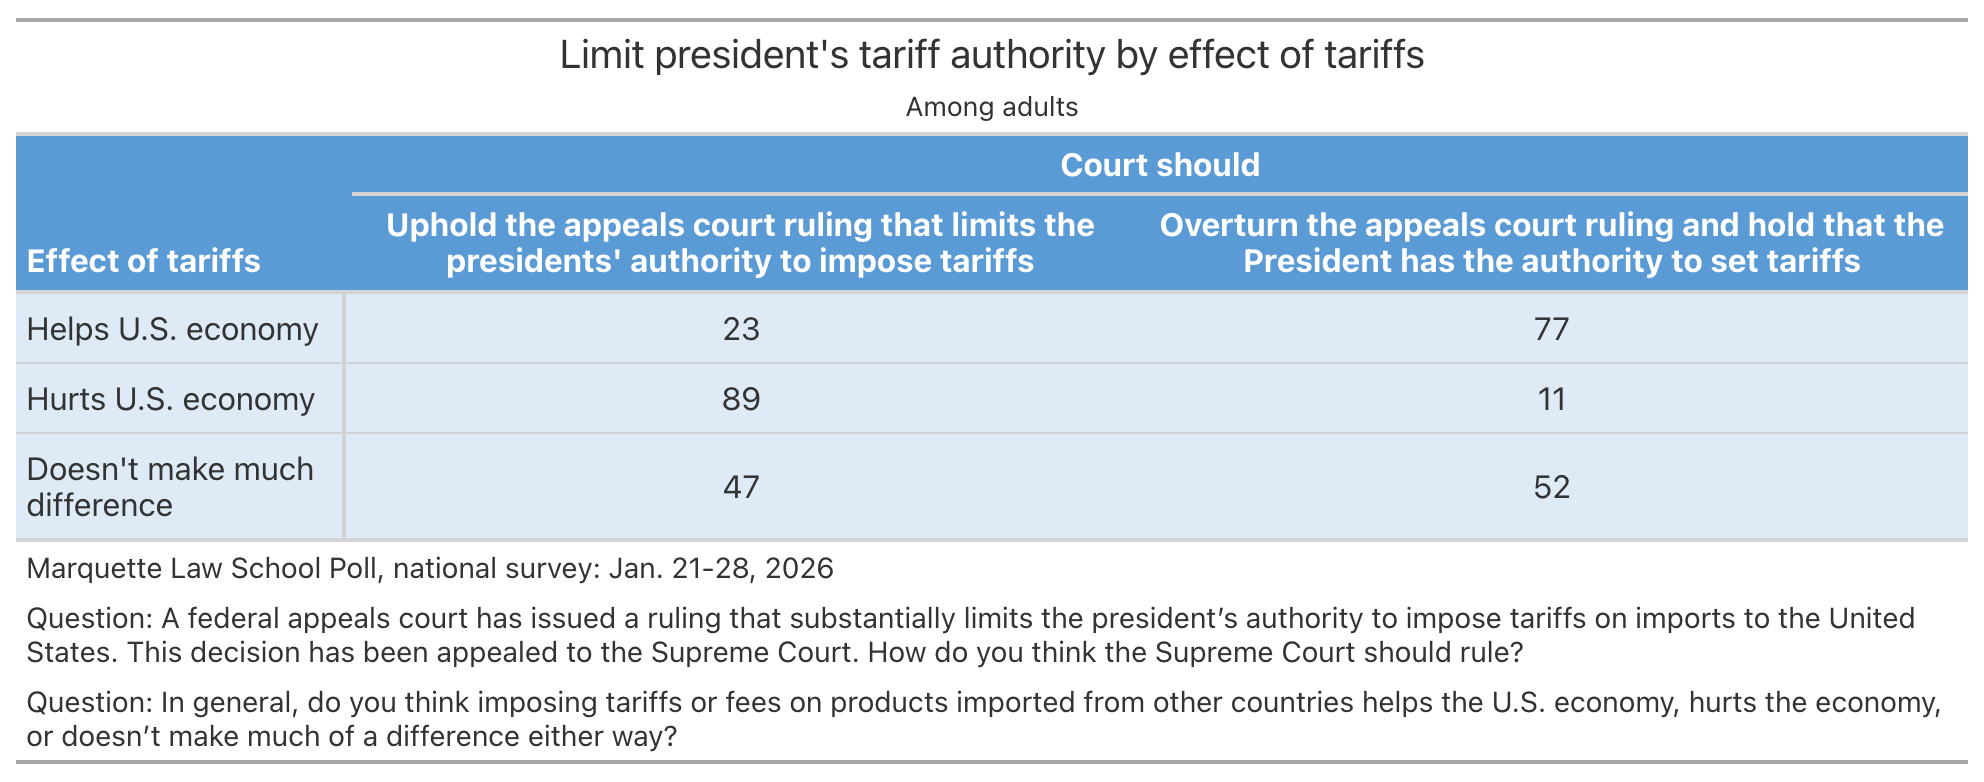
A majority of the public, 56% say that tariffs hurt the U.S. economy, while 30% think they help the economy and 14% say tariffs don’t make much difference. Views of the effect of tariffs are related to opinion of how the Court should rule, as shown in the table below. Those who think tariffs help the economy are in favor of overturning the limits on the president’s authority, 77%, though even among this group more than one-in-five think the president’s authority should be limited, 23%. Among those who say tariffs harm the economy, 89% think the Court should limit presidential authority. Opinion is evenly divided among those who say tariffs don’t make much difference.

The Court and the President

A large majority of adults believe that the president must obey a Supreme Court decision, 82% with 17% who say the president can ignore a decision with which he disagrees. These views have been quite stable in 10 Marquette polls since 2019, never dipping below 76% saying the president must obey the Court, and not below 83% since Jan. 2025.

This belief in the authority of the Court is not a partisan matter. Among Republicans 76% say the president must obey the Court, as do 79% of independents and 90% of Democrats.

In January, a majority, 57% said the Court was going out of it’s way to avoid ruling against Trump, while 43% said the Court was not doing so. Among Republicans 34% thought the Court was avoiding ruling against Trump, as did 59% of independents and 78% of Democrats.

Approval of the Supreme Court

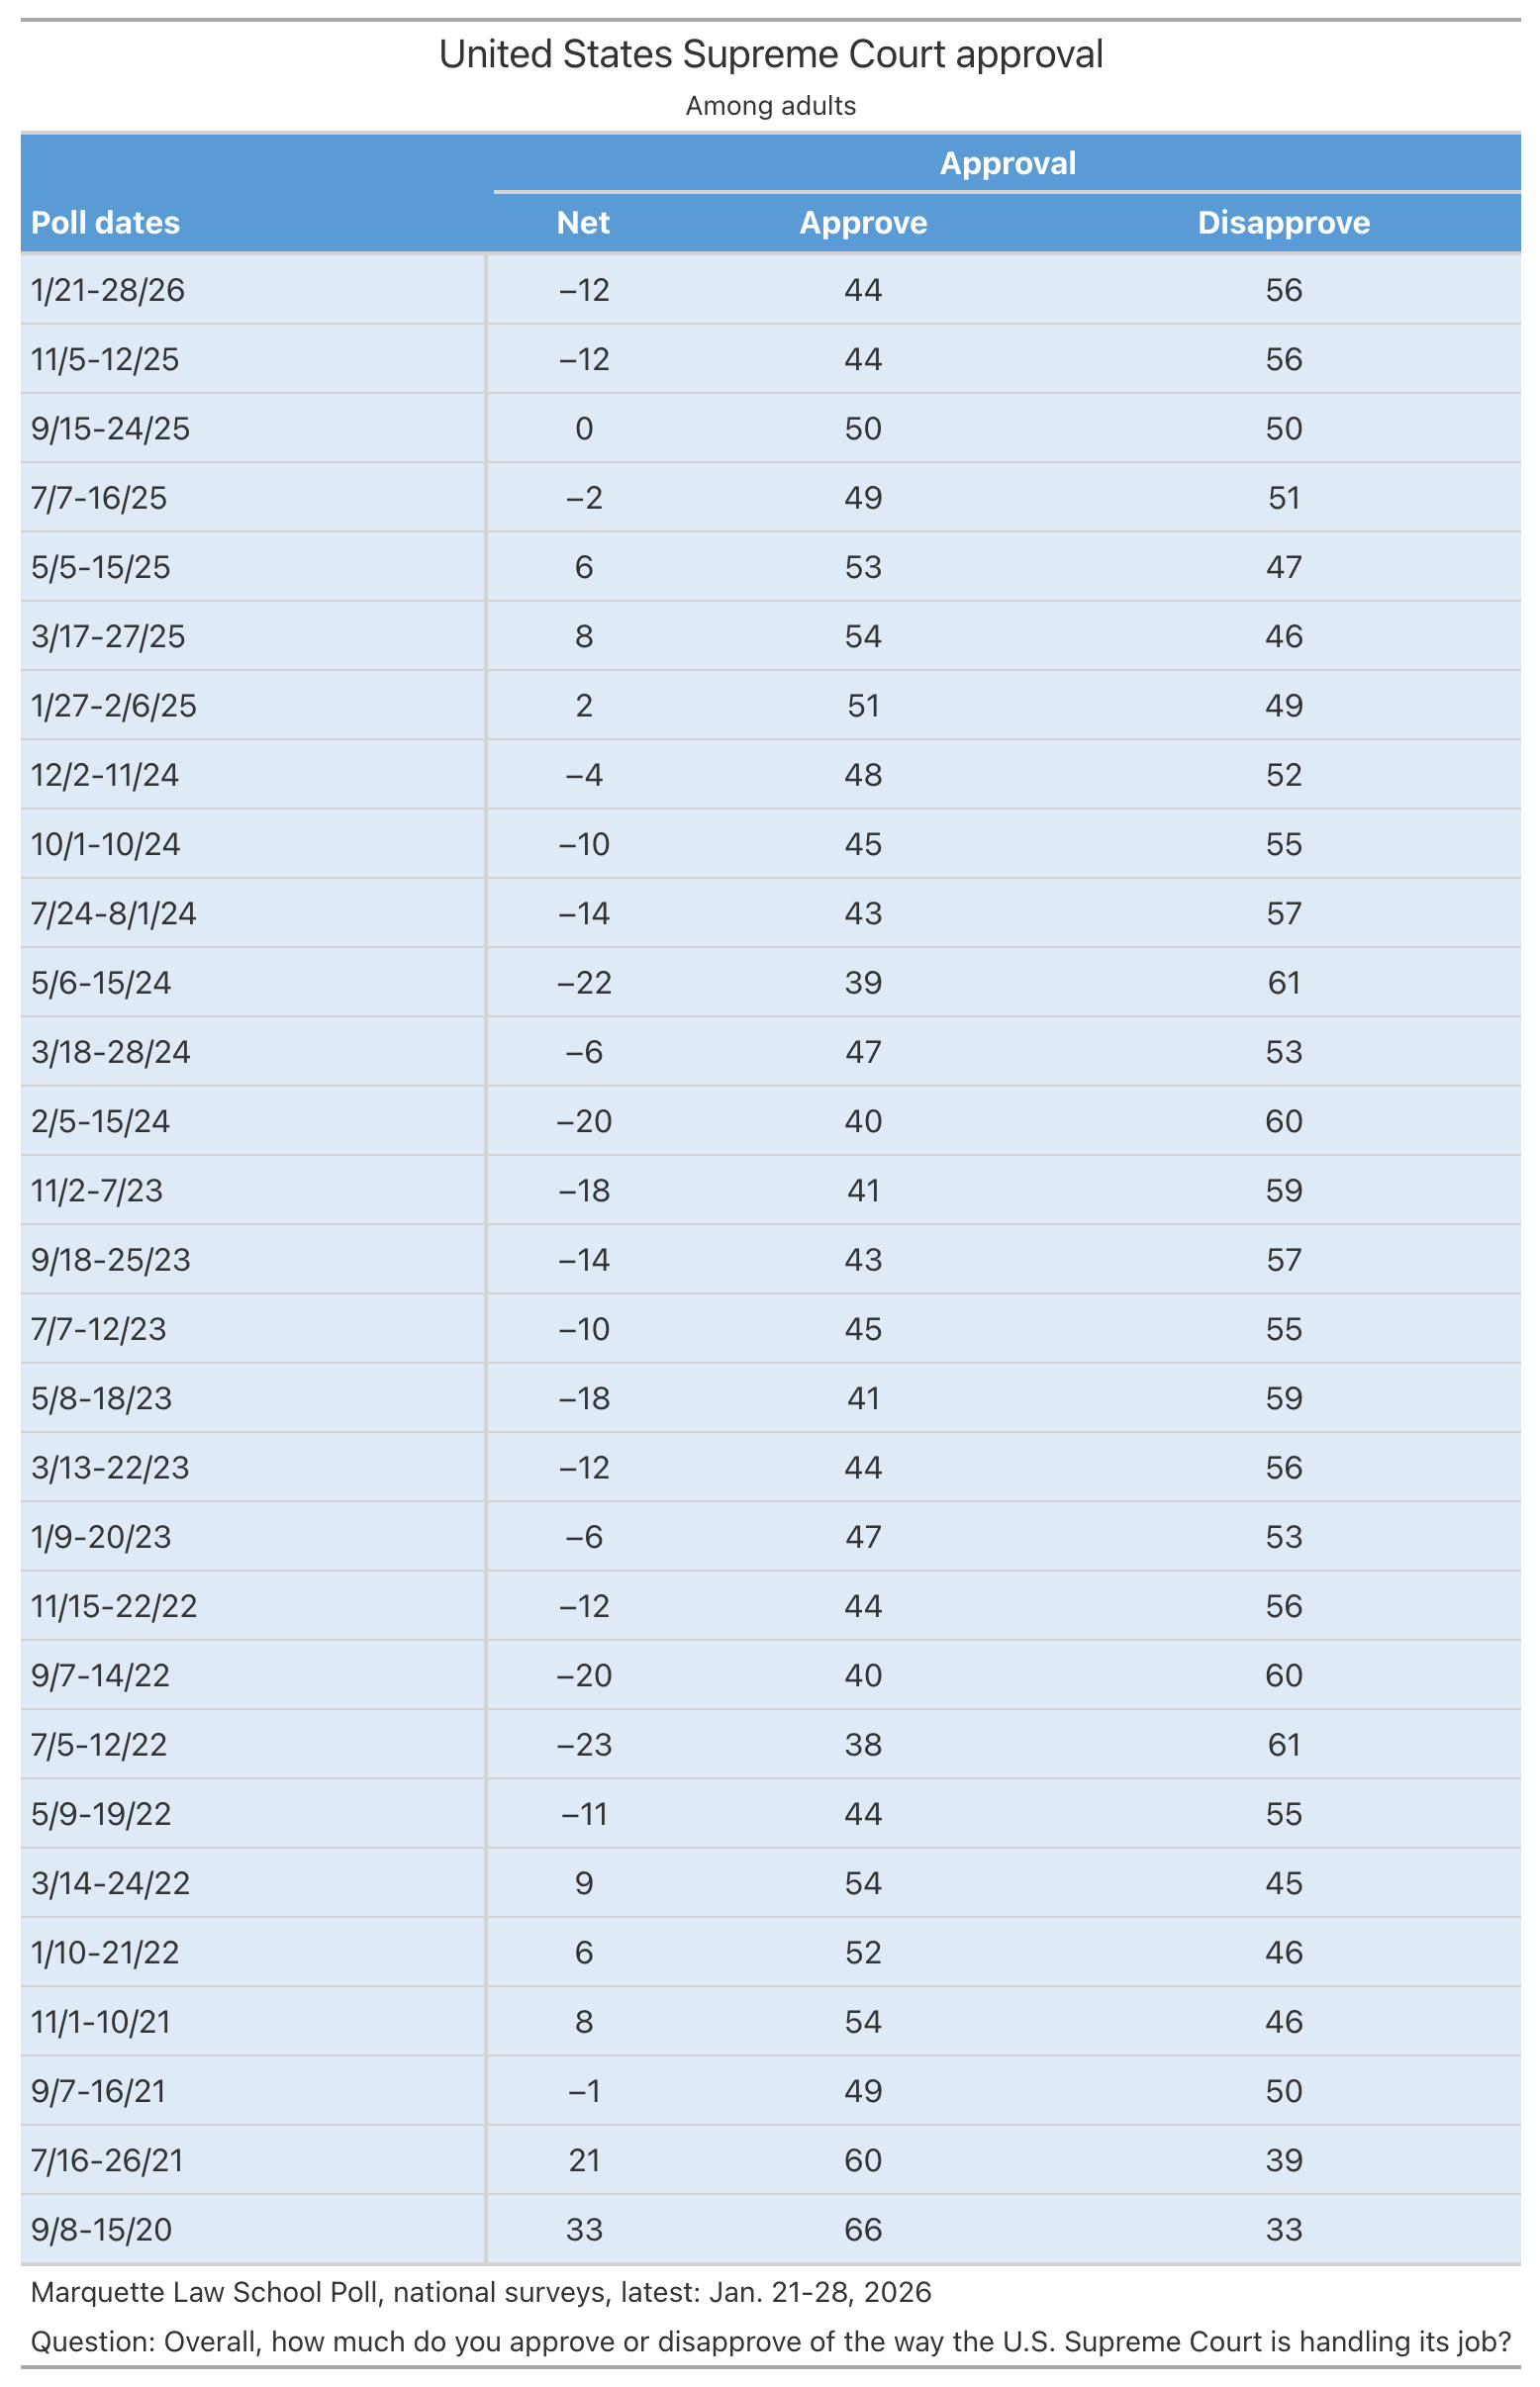
Approval of the U.S. Supreme Court has fallen since September, from 50% to 44% in January. Approval fell sharply in 2022 following the Dobbs v. Jackson Women’s Health Organizationdecision which overturned abortion rights established in Roe v. Wade. Net approval, the percentage approval minus disapproval, remained negative throughout the remainder of 2022 and through 2024. In January 2025 net approval moved up into positive territory before turning down in July. The table shows approval of the Court since September 2020.

About the Marquette Law School Poll

The survey was conducted Jan. 21-28, 2026, interviewing 1003 adults nationwide, with a margin of error of +/-3.4 percentage points.

Interviews were conducted using the SSRS Opinion Panel, a national probability sample with interviews conducted online. The detailed methodology statement, survey instrument, topline results, and crosstabs for this release are available at https://law.marquette.edu/poll/category/results-and-data/

Continue ReadingPublic opinion favors Supreme Court decision limiting Trump tariffs

Highest highs and lowest lows: Gallup 1937-2025

Closing the books on Gallup presidential approval

When I refreshed my presidential approval database in January, I wondered when Gallup would update their measure from December. They usually release approval in mid-month, but there wasn’t an update as of Jan. 20. I assumed it would come soon.

Now we learn that there won’t be any more Gallup presidential approval polls. As reported in the Washington Post and the New York Times on Feb. 11, Gallup has decided to discontinue their approval polling. Gallup made a similar decision in 2015 to discontinue their presidential horse race polls.

This is a loss to the public. The Gallup organization has the longest running, and most voluminous, time series of approval, dating back to 1937. While their methodology has evolved over time, they have always used what was “state of the art” methods for the time, and their question wording has been stable for decades, after evolving a bit in the early years. That means when we want to make the best apples-to-apples comparison across presidents and decades, Gallup is the indispensable source.

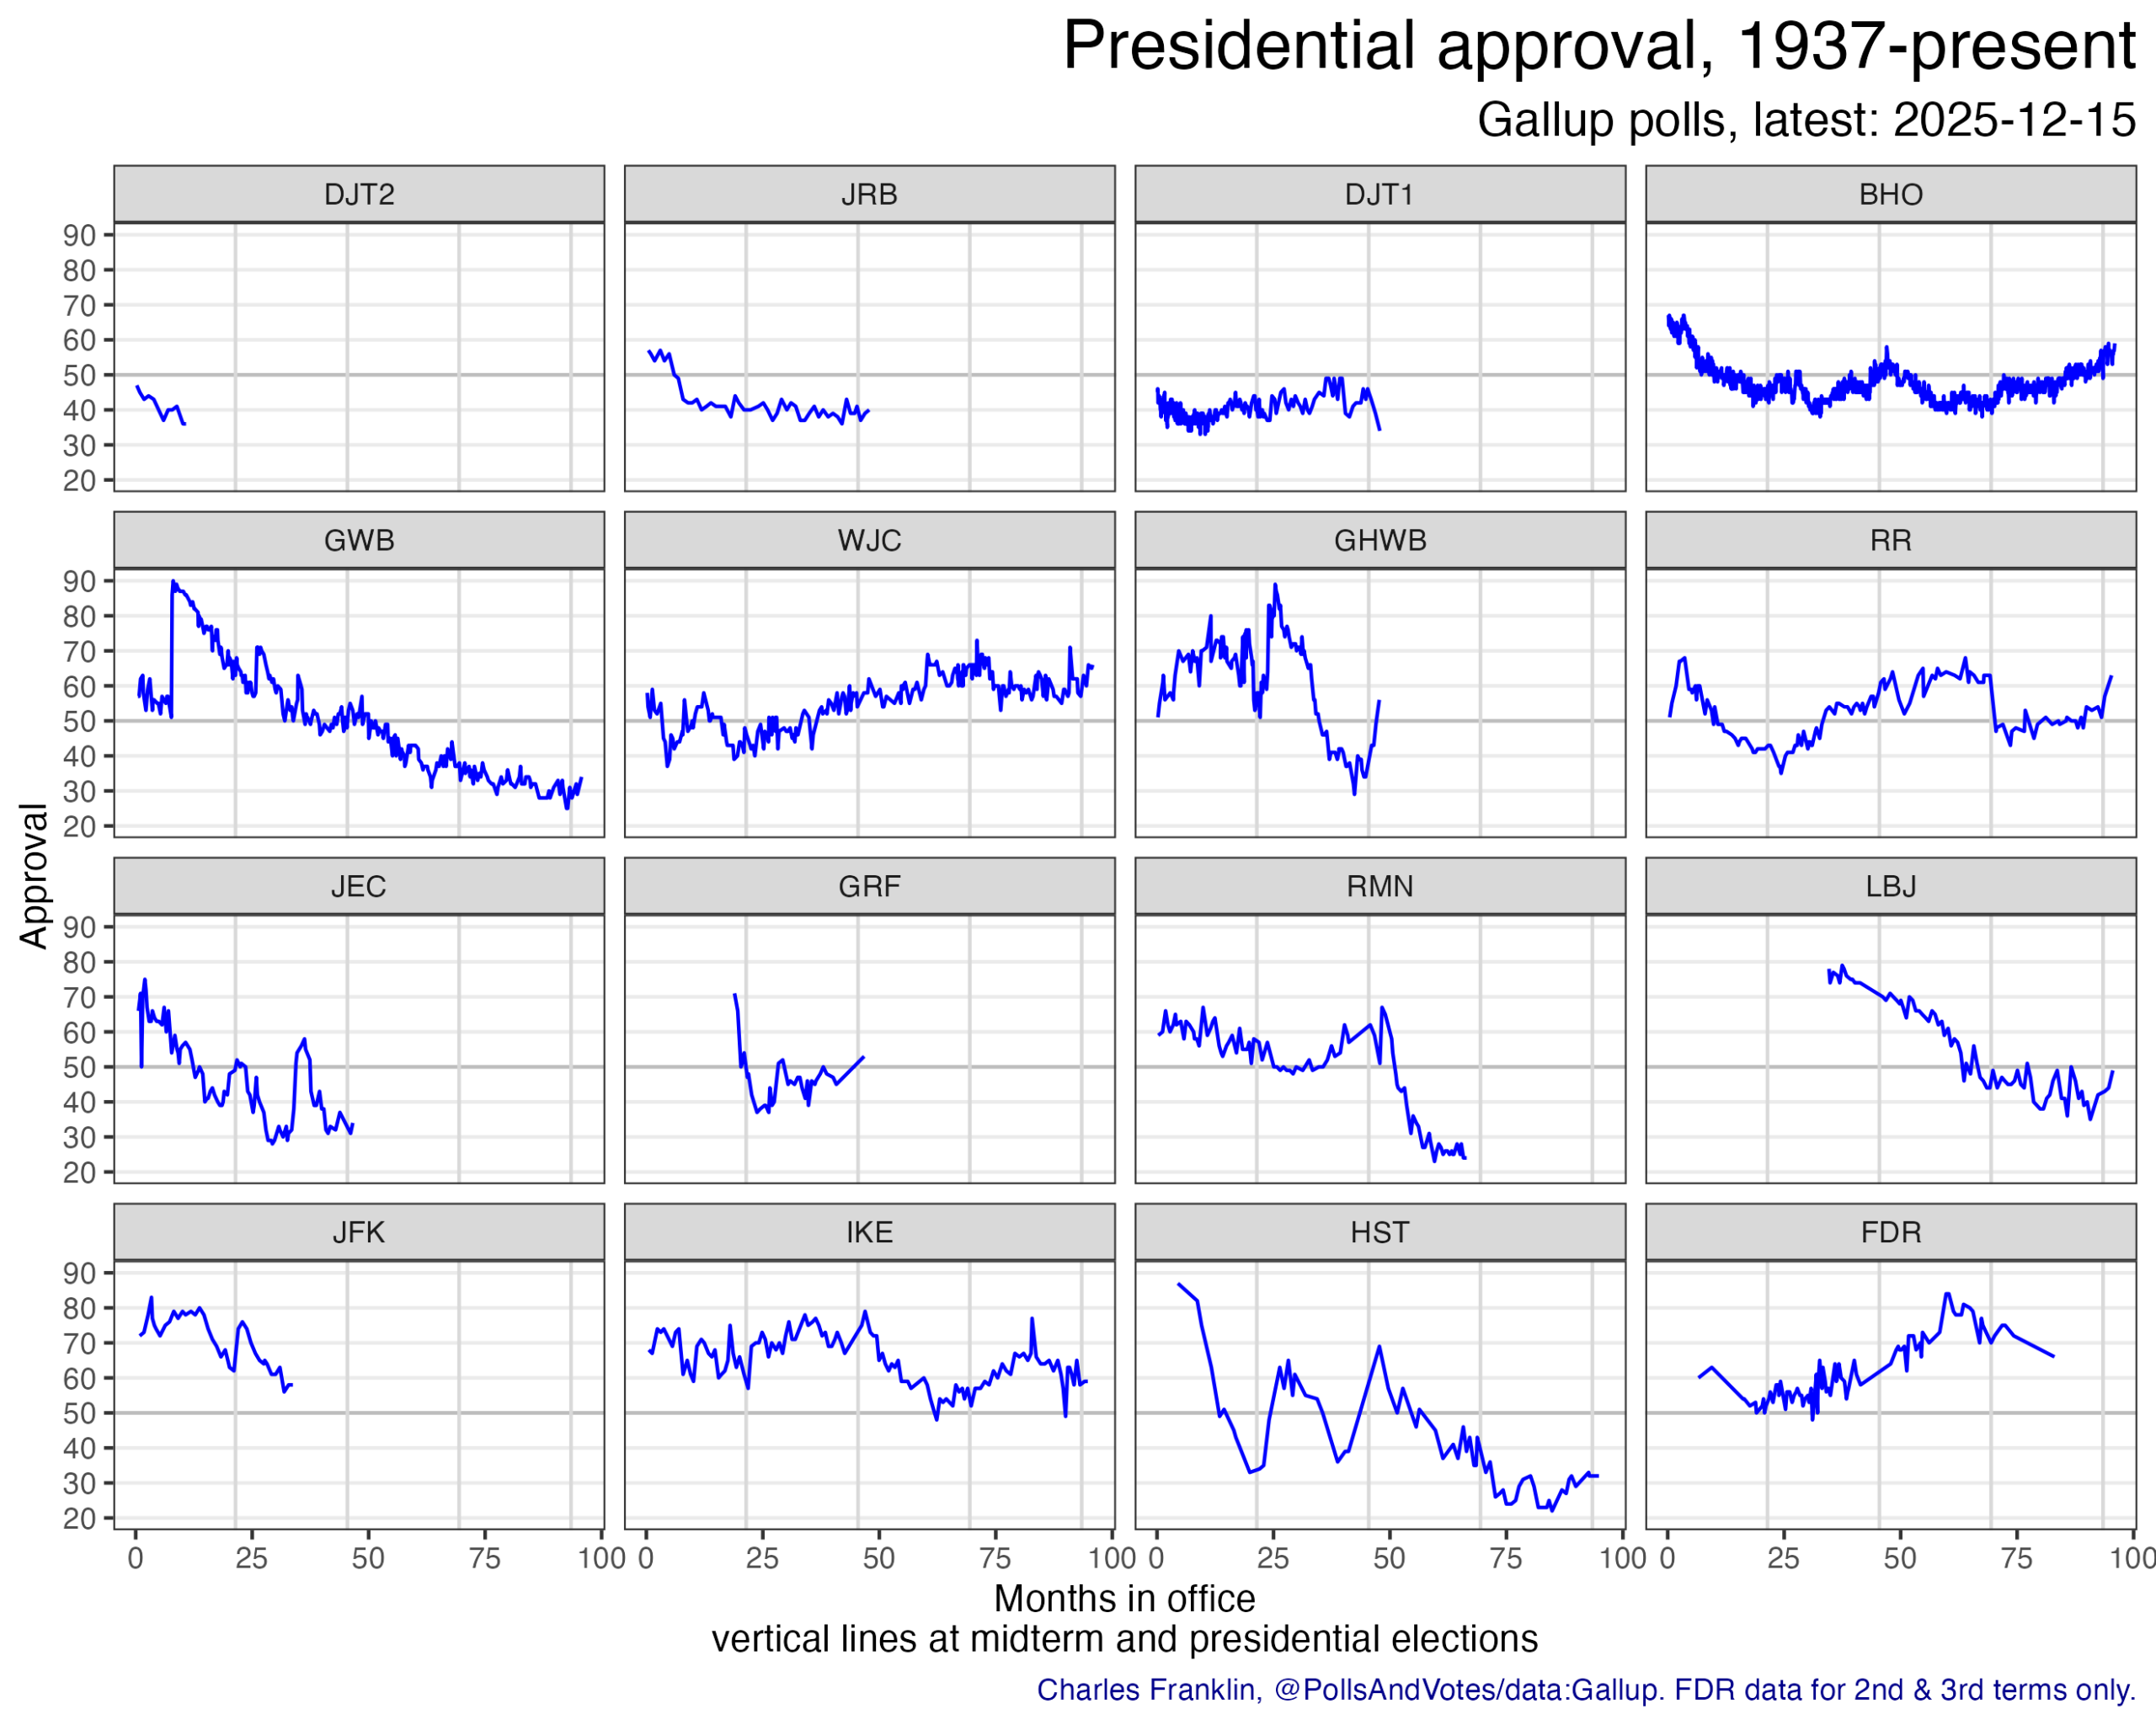
Here is what I now realize to be my final update of all the 2846 Gallup approval polls since Roosevelt in Aug. 1937 to Trump in Dec. 2025.

There are plenty of high quality national polls available now, so Gallup is hardly the only game in town. The polling averages from Silver BulletinFiftyPlusOneNew York TimesRealClearPolitics and others are now widely recognized as a better way to track the full measure of approval across dozens of pollsters rather than rely on a single pollster.

When George Gallup started the poll in the 1930s there was money to be made in public opinion polling. Newspapers across the country subscribed to his polls and distributed his results to a national audience. Gallup actually offered newspapers a money back guarantee that his 1936 presidential horse race poll would outperform the Literary Digest poll that year, which it did. The poll also survived embarrassing errors, most notably the 1948 presidential election.

These days, there isn’t such a financial interest in providing opinion data to the public. Private polling for interest groups, parties and candidates remains financially viable, but those polls serve private, not public, interests. News organizations either run their own polls, contracting the work through various pollsters, or report on polls they don’t produce themselves but also don’t pay for. Universities (like my Marquette Law School Poll) produce public polls in the public interest and for the publicity value. Gallup is reported to say they are refocusing their business away from approval polling, which is sad but understandable.

This moment of closure lets us make one final list of the lows and highs of Gallup approval results over the decades.

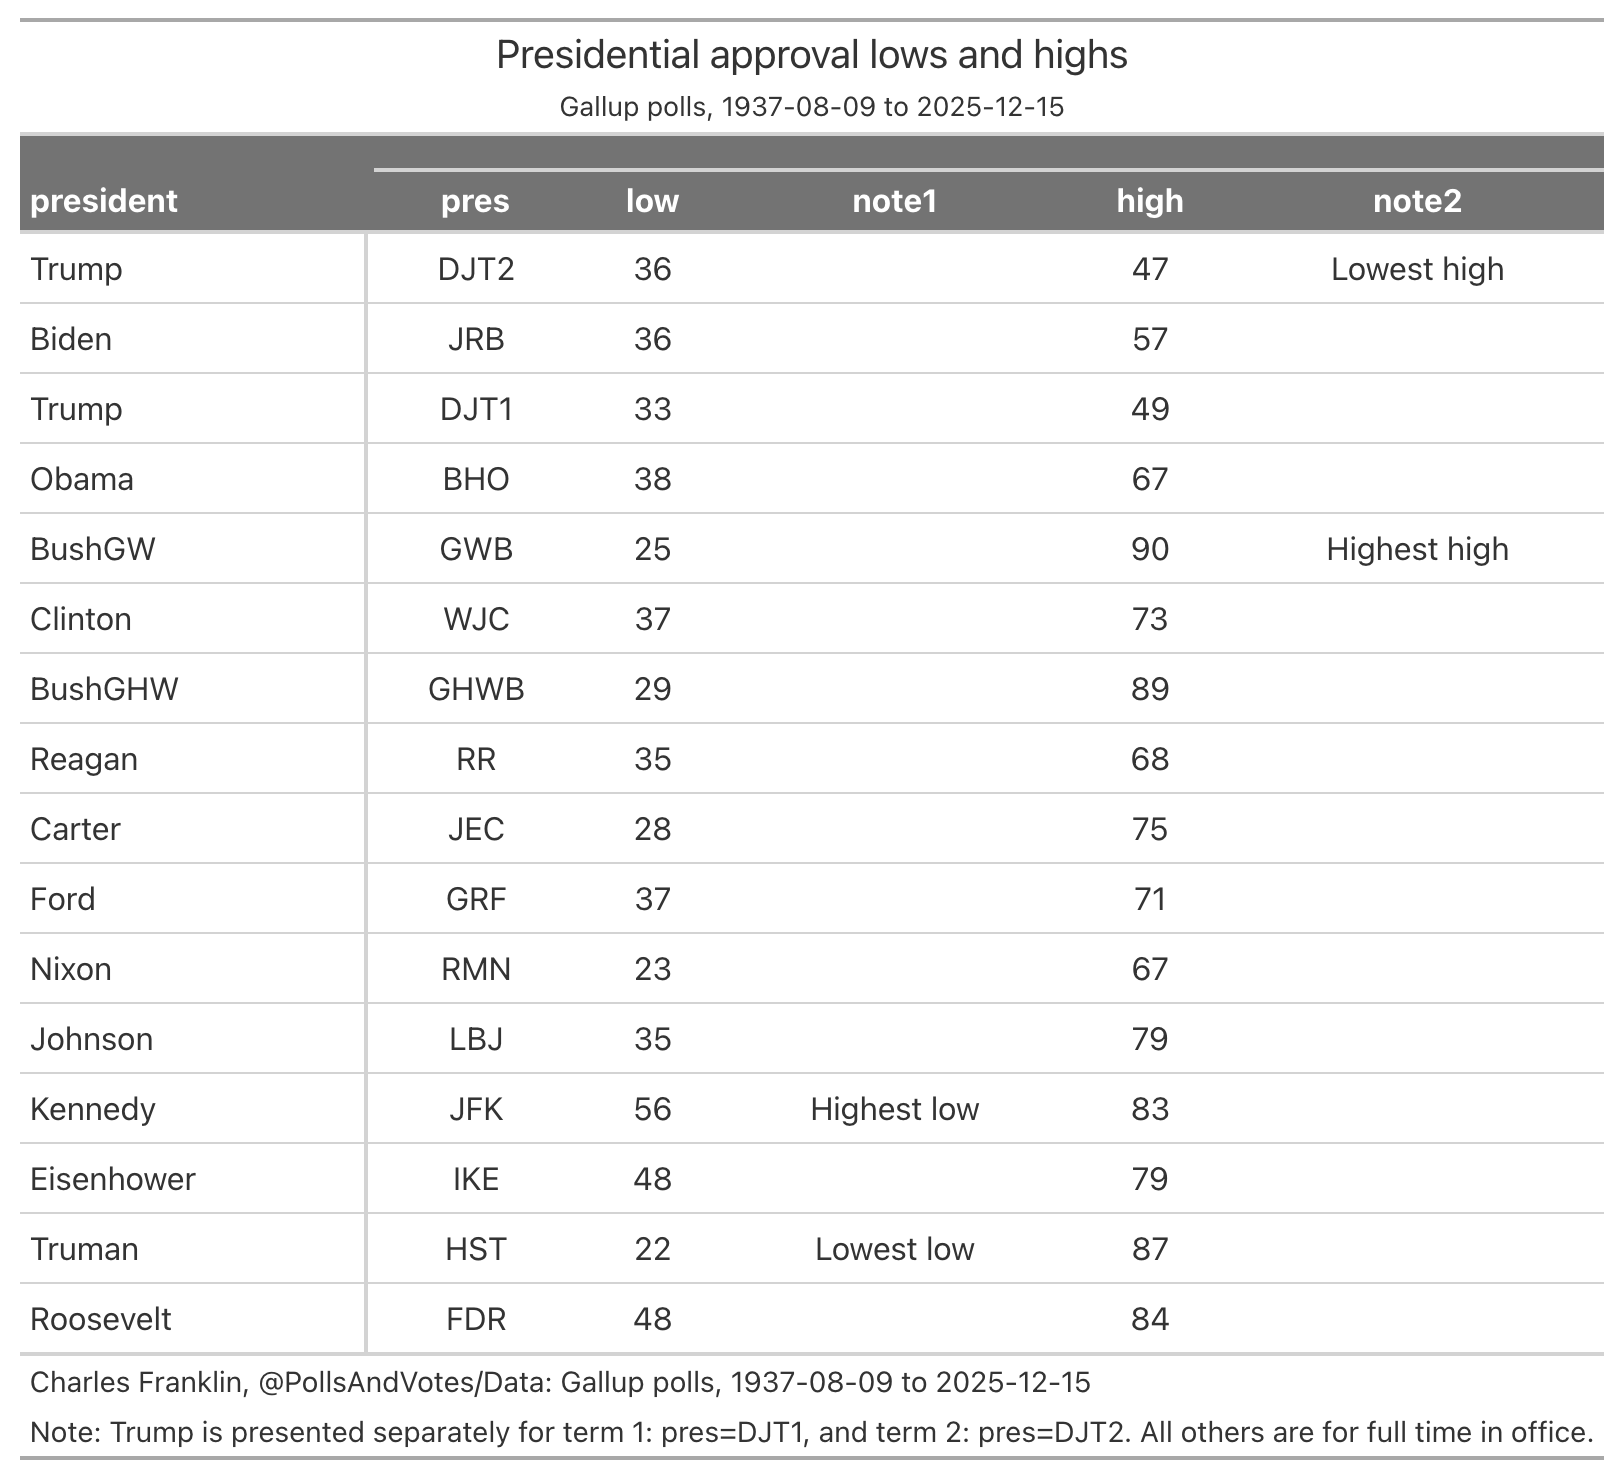
The all time lowest low goes to Harry Truman, at 22%. John F. Kennedy has the highest low, never falling below 56%. And as for highs, George W. Bush owns that record at 90%, eclipsing his father, George H.W. Bush by one point. As for the lowest high, that belongs to the current president, at 47% in his second term, two points lower than his high in the first term. No other president has failed to reach 50% on their best days.

That all time low for Truman was misreported for some decades as a point higher, 23%. I found the discrepancy in 2006, tracked down the evidence, and presented it to Gallup’s then Editor in Chief, Frank Newport, who was gracious enough to review my results and confirm the new low of 22%. I told that story in a post in July 2006. To my surprise, the post still lives at my first website, Political Arithmetik

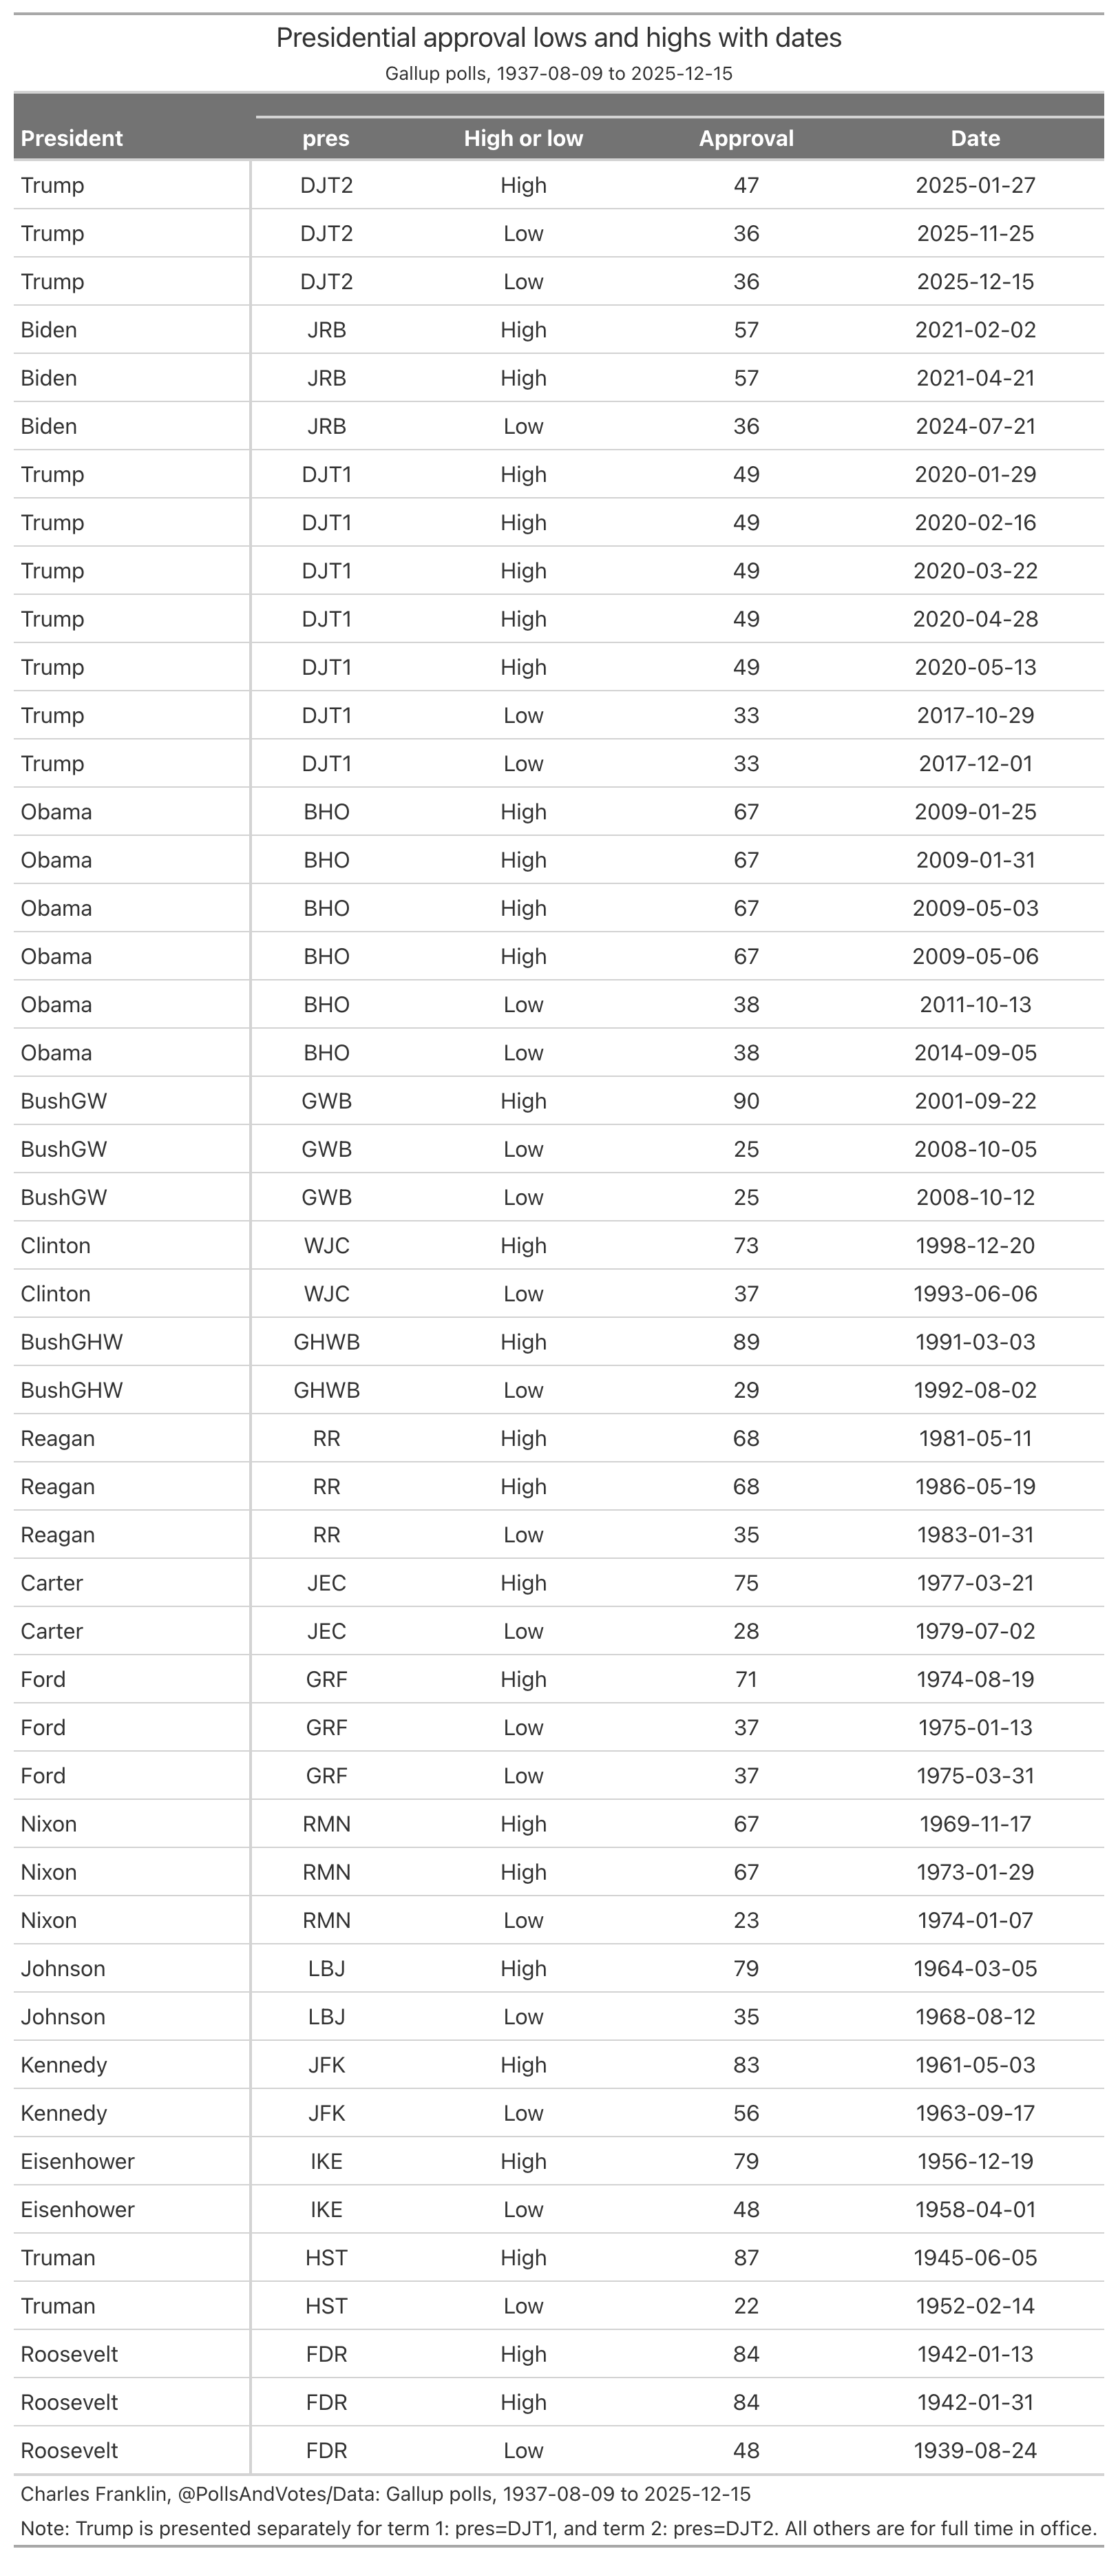
Presidents can tie their highs or lows in multiple polls on different days. The next table shows all the lows and highs and the dates on which those polls were taken. Some of the dates are instructive. Trump’s second term high came 7 days after his inauguration. And his first term highs were all during the early months of the Covid pandemic. Biden’s low came about the time he dropped out of the presidential race in 2024. For George W. Bush and Franklin D. Roosevelt, their highest marks came after attacks on the United States, after Sept. 11, 2001 and after Dec. 7, 1941.

As for largest range from high to low, that honor is shared by George W. Bush and Harry S Truman, both with a 65 point range, Bush from 90-25 and Truman from 87-22. (Truman lacks a middle name, just an initial, hence no period after the S, a lesson I learned from my 12th grade government teacher, Dr. Austin F. Staples. The great Google AI tells me official documents include a period, but I trust Dr. Staples on this.)

So there you have it. An end of a polling era. “Official” highs and lows will no longer have a consistent standard to use. This means as a practical problem that the highs and lows going forward will come from outliers– the rare poll with an exceptionally high approval and the exceptionally low ones. That, I think, is a loss.

Continue ReadingHighest highs and lowest lows: Gallup 1937-2025