Appellate Judges Give a Window into How They Do Their Work (Seventh Circuit Day, Part 3)
In two noteworthy ways, the term “dialogue” was central to an event involving four judges of the U.S. Court of Appeals for the Seventh Circuit at Eckstein Hall on September 25, 2025.
A daylong visit by Seventh Circuit judges to Marquette Law School had multiple components. It included a morning session in the Law School’s Lubar Center in which the court heard arguments on six cases; a midafternoon program in which the judges discussed their work with an audience of Marquette law students; and an end-of-day reception which included a recognition of the Hon. Diane S. Sykes, L’84, as she completed her term as chief judge of the Seventh Circuit and assumed senior status (the next blog post in this series will say a few words about that event).
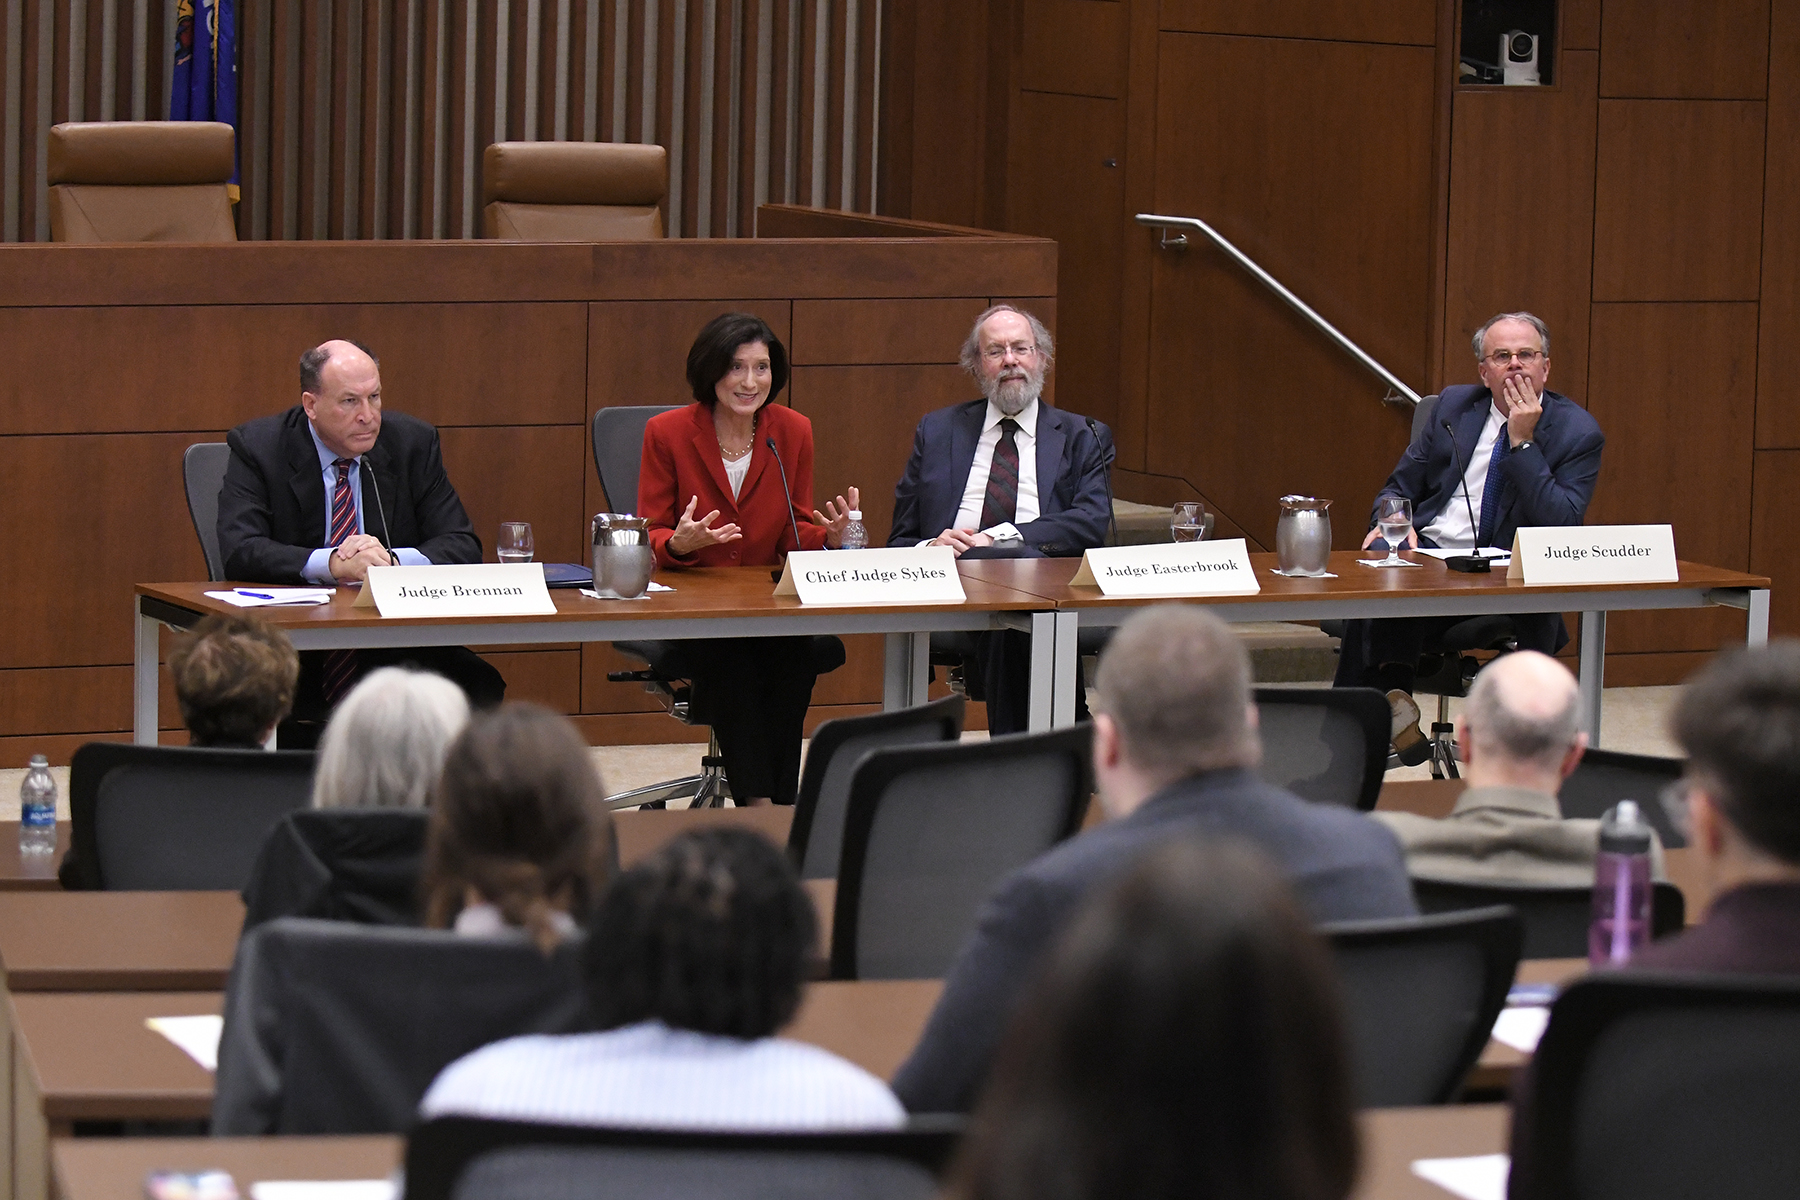
Even beyond all of this, the day included a late-afternoon CLE panel discussion program, before about 200 lawyers in the Lubar Center. It was titled “Judges on Judging: A Window into Appellate Decision Making” and moderated by Marquette Law School Professor Chad Oldfather.
That is the first reason to use the term “dialogue.” The relatively informal program offered a chance to hear collegial conversation among Chief Judge Sykes and Judges Frank H. Easterbrook, Michael B. Brennan, and Michael Y. Scudder about how they approach cases that come before them.