The Contents of Milwaukee’s Ballot Dump

And How Many Early Voters Wasted Their Vote

In Wisconsin, anybody can vote early by mail or in-person at an early voting site for any reason, and many people do. This is referred to, interchangeably, as “early” or “absentee” voting.

In the August 2026 primary, 25.8% of ballots were cast by mail and another 11.9% in-person at an early voting center. Thirty-eight percent of Wisconsin Democrats didn’t wait until election day to cast their ballot in the governor’s primary.

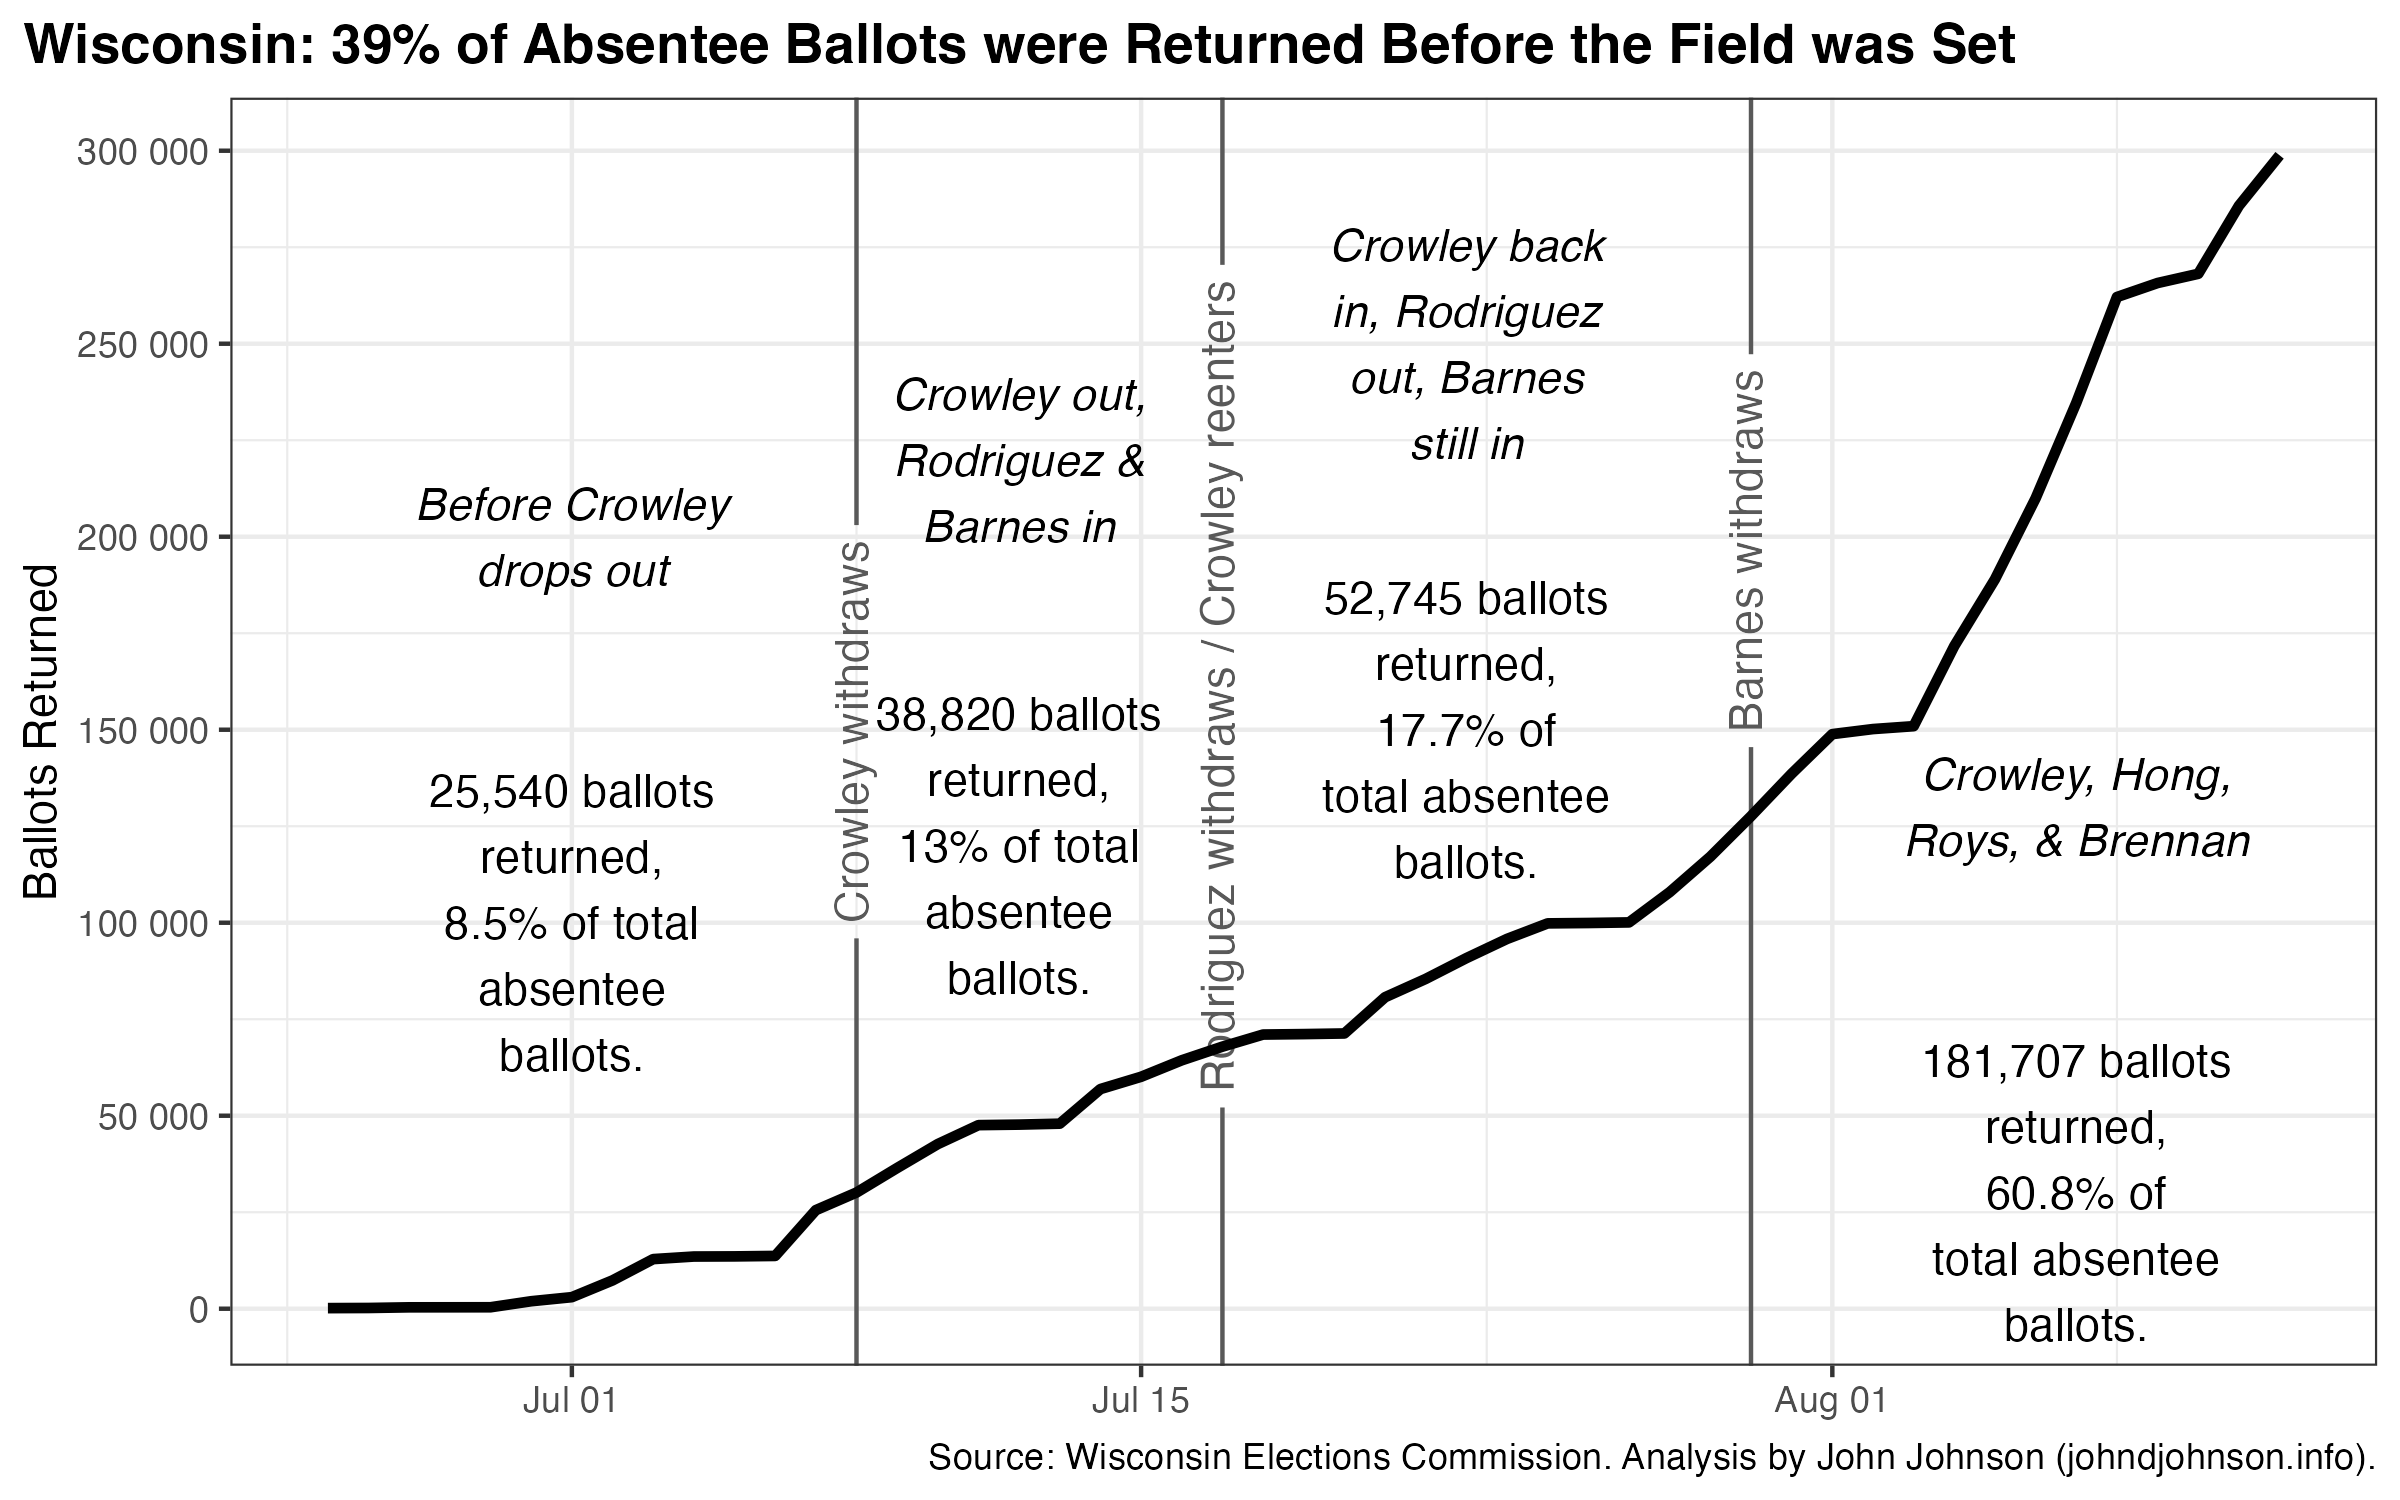
Voting early is risky in a primary election, because the nature of the contest can change a lot in the weeks before a race. The first absentee ballots were sent out in late May and early voting centers opened on July 28th. David Crowley withdrew his candidacy on July 8th. On July 17th, Sara Rodriguez dropped out and Crowley reentered. On July 30th, Mandela Barnes–then polling in second place–ended his campaign. Any voter casting a ballot before July 30th ran the risk of wasting their vote on a candidate no longer running by election day on August 11th.

Statewide, 8.5% of absentee ballots were cast before Crowley dropped out the first time. Thirteen percent were cast while Crowley was officially out of the race but Rodriguez was still in. Then, another 17.7% were cast after Crowley reentered but before Barnes dropped out. Across Wisconsin, 39% of early voters cast their ballot before the final field was set.

How many of them voted for a candidate who subsequently dropped out? Doubtlessly, some of them. According to the Associated Press on Wednesday afternoon, the three suspended campaigns (Rodriguez, Barnes, and Hughes) collectively received 68,343 votes, or 8.6% of the total. Recall that Crowley defeated Hong by about 3,800 votes.
In most places, it is impossible to tell who those early voters voted for, because their ballots are counted along with those of regular, election day voters at each individual polling place. The complete results for each ward are reported one time, including ballots from every mode of voting.

However, many larger municipalities count their early votes separately at a central count location. The City of Milwaukee is one of these. In Milwaukee, the process of counting absentee ballots often drags on late into the night, well after the election day results from each ward have been tallied and published. Because Milwaukee always has tens of thousands of absentee ballots, this means that close statewide elections can never be called until those votes are reported–a process that occurs all at once and involves some drama as elections officials (accompanied by a police escort) transfer thumb drives containing the absentee results from the central count location to the courthouse. Once the thumb drives arrive, the early votes are added to the ward totals where each voter would’ve gone had they voted on election day. This instantaneous addition of thousands of votes to Milwaukee’s total is commonly called the “ballot dump.”

The ballot dump causes much angst in Wisconsin by providing fodder for conspiracy theorists who watch Milwaukee’s late addition of votes lift Democratic candidates to victory, as happened in 2018, 2020, and 2024. In fact, state law prohibits Milwaukee’s election commission from taking steps to speed up their central count, such as pre-processing absentee ballot signatures and envelopes before election day, and Republican legislative leadership killed a bipartisan bill aimed at reforming this in 2023.

As bad as these late-night ballot updates are for confidence in our elections, they are useful for researchers like me. We can use them to measure differences between the early vote and the election day vote. The contents of the early vote ballot dump are not explicitly reported, but by subtracting the election day totals for each ward from the final, complete totals, we can see exactly how early voters cast their ballots.

Crowley led Hong by just over 1,000 votes in Milwaukee’s election day returns, and he doubled that raw vote lead once the city’s absentee ballots were added. Unlike in several previous general elections, Milwaukee’s late night ballot dump did not change the leader of the 2026 Democratic primary. The added ballots merely added to the lead he already held in AP’s running tally. When it was all said and done, the City of Milwaukee was not individually decisive in Crowley’s statewide victory. He won the state by around 3,800 votes. Of that victory margin, the City of Milwaukee contributed about 2,200 votes–half from early voters and half from election day ballots.

Votes for Crowley vs. Hong
City of Milwaukee1
vote modeDavid CrowleyFrancesca HongCrowley net
early9,4238,357+1,066
in-person28,56427,473+1,091
total37,98735,830+2,157
1 Excludes three wards (24th, 25th, & 27th) which did not separately report election day and early votes.
Data Source: Milwaukee County Election Commission unofficial election night results posted at 10:36PM and 1:09AM. Analysis by John Johnson (johndjohnson.info).

Milwaukeeans who cast their ballots early did waste their votes at a much higher rate. This table shows the share received by each candidate listed on the ballot among early vs. election day voters.

Share of the Vote, by Vote Mode
City of Milwaukee1
Dem. Gov. candidateearlyin-persontotal
David Crowley38.7%47.4%44.9%
Francesca Hong34.3%45.6%42.3%
Joel Brennan5.1%2.3%3.1%
Kelda Roys4.1%3.0%3.3%
Mandela Barnes10.4%0.9%3.7%
Missy Hughes0.3%0.1%0.2%
Sara Rodriguez7.0%0.6%2.5%
write-in:0.1%0.0%0.1%
1 Excludes three wards (24th, 25th, & 27th) which did not separately report election day and early votes.
Data Source: Milwaukee County Election Commission unofficial election night results posted at 10:36PM and 1:09AM. Analysis by John Johnson (johndjohnson.info).

Sara Rodriguez, who ended her campaign on July 17th, received 7% of early votes and only 0.6% of election day ballots. Mandela Barnes, who dropped out on July 30th, took 10.4% among early voters but just 0.9% on election day.

All told, 17.7% of early voters voted for somebody who dropped out before the election, compared to just 1.6% of election day voters. In this way, election day voters appear to have been very well informed about which candidates remained actively in the running.

People who waited to vote until election day also appear to have consolidated more behind one of the two front-runners. Joel Brennan and Kelda Roys remained in the race until the very end, but they never drew much support. Combined, 9.2% of Milwaukee’s early voters picked one of these minor candidates. This fell to 5.3% by election day.

As discussed above, Crowley received a similar number of net votes (relative to Hong) in both the election day totals and the smaller absentee totals. But in percentage terms, Crowley actually did better with early voters, among whom he beat Hong by 4.4 points, than among election day voters, among whom his margin of victory shrank to 1.8 points. By the end of the race, Milwaukee’s Democratic primary voters had thoroughly consolidated behind the two frontrunners, with Hong winning 45.6% of election day voters to Crowley’s 47.4%.
Continue ReadingThe Contents of Milwaukee’s Ballot Dump

David Crowley Wins an Upset with a Familiar Coalition Behind Him

Talk about a come-from-behind victory. David Crowley’s roughly 3,200-vote, 0.4-point victory in the Wisconsin Democratic primary came after every public poll—and Crowley’s own internal survey—showed him trailing Francesca Hong by double digits in the weeks preceding the election. The late-July Marquette poll, for instance, showed Hong drawing the support of 38%, followed by 16% for Mandela Barnes and 7% for Crowley. Thirty-four percent remained undecided in that poll.

Those undecided voters apparently broke heavily for Crowley, following Barnes’s exit from the race and high-profile endorsements from politicians like Congresswoman Gwen Moore. He wound up winning the race with roughly 39.8% of the vote to Hong’s 39.4%.

It took Milwaukee’s “ballot dump”—separately tallied absentee votes added in the wee hours of Wednesday morning—to seal Crowley’s 2026 victory. But Crowley did not win his home county by an overwhelming margin. Here, he won 43.0% to Hong’s 41.5%, a considerably smaller margin of victory than he achieved in any of Milwaukee’s neighboring counties.

Crowley is no stranger to close races like this one. He won his current office, Milwaukee County Executive, by an almost equally slim margin in 2020, when he defeated State Senator Chris Larson by 0.6 points and just over 1,000 votes.

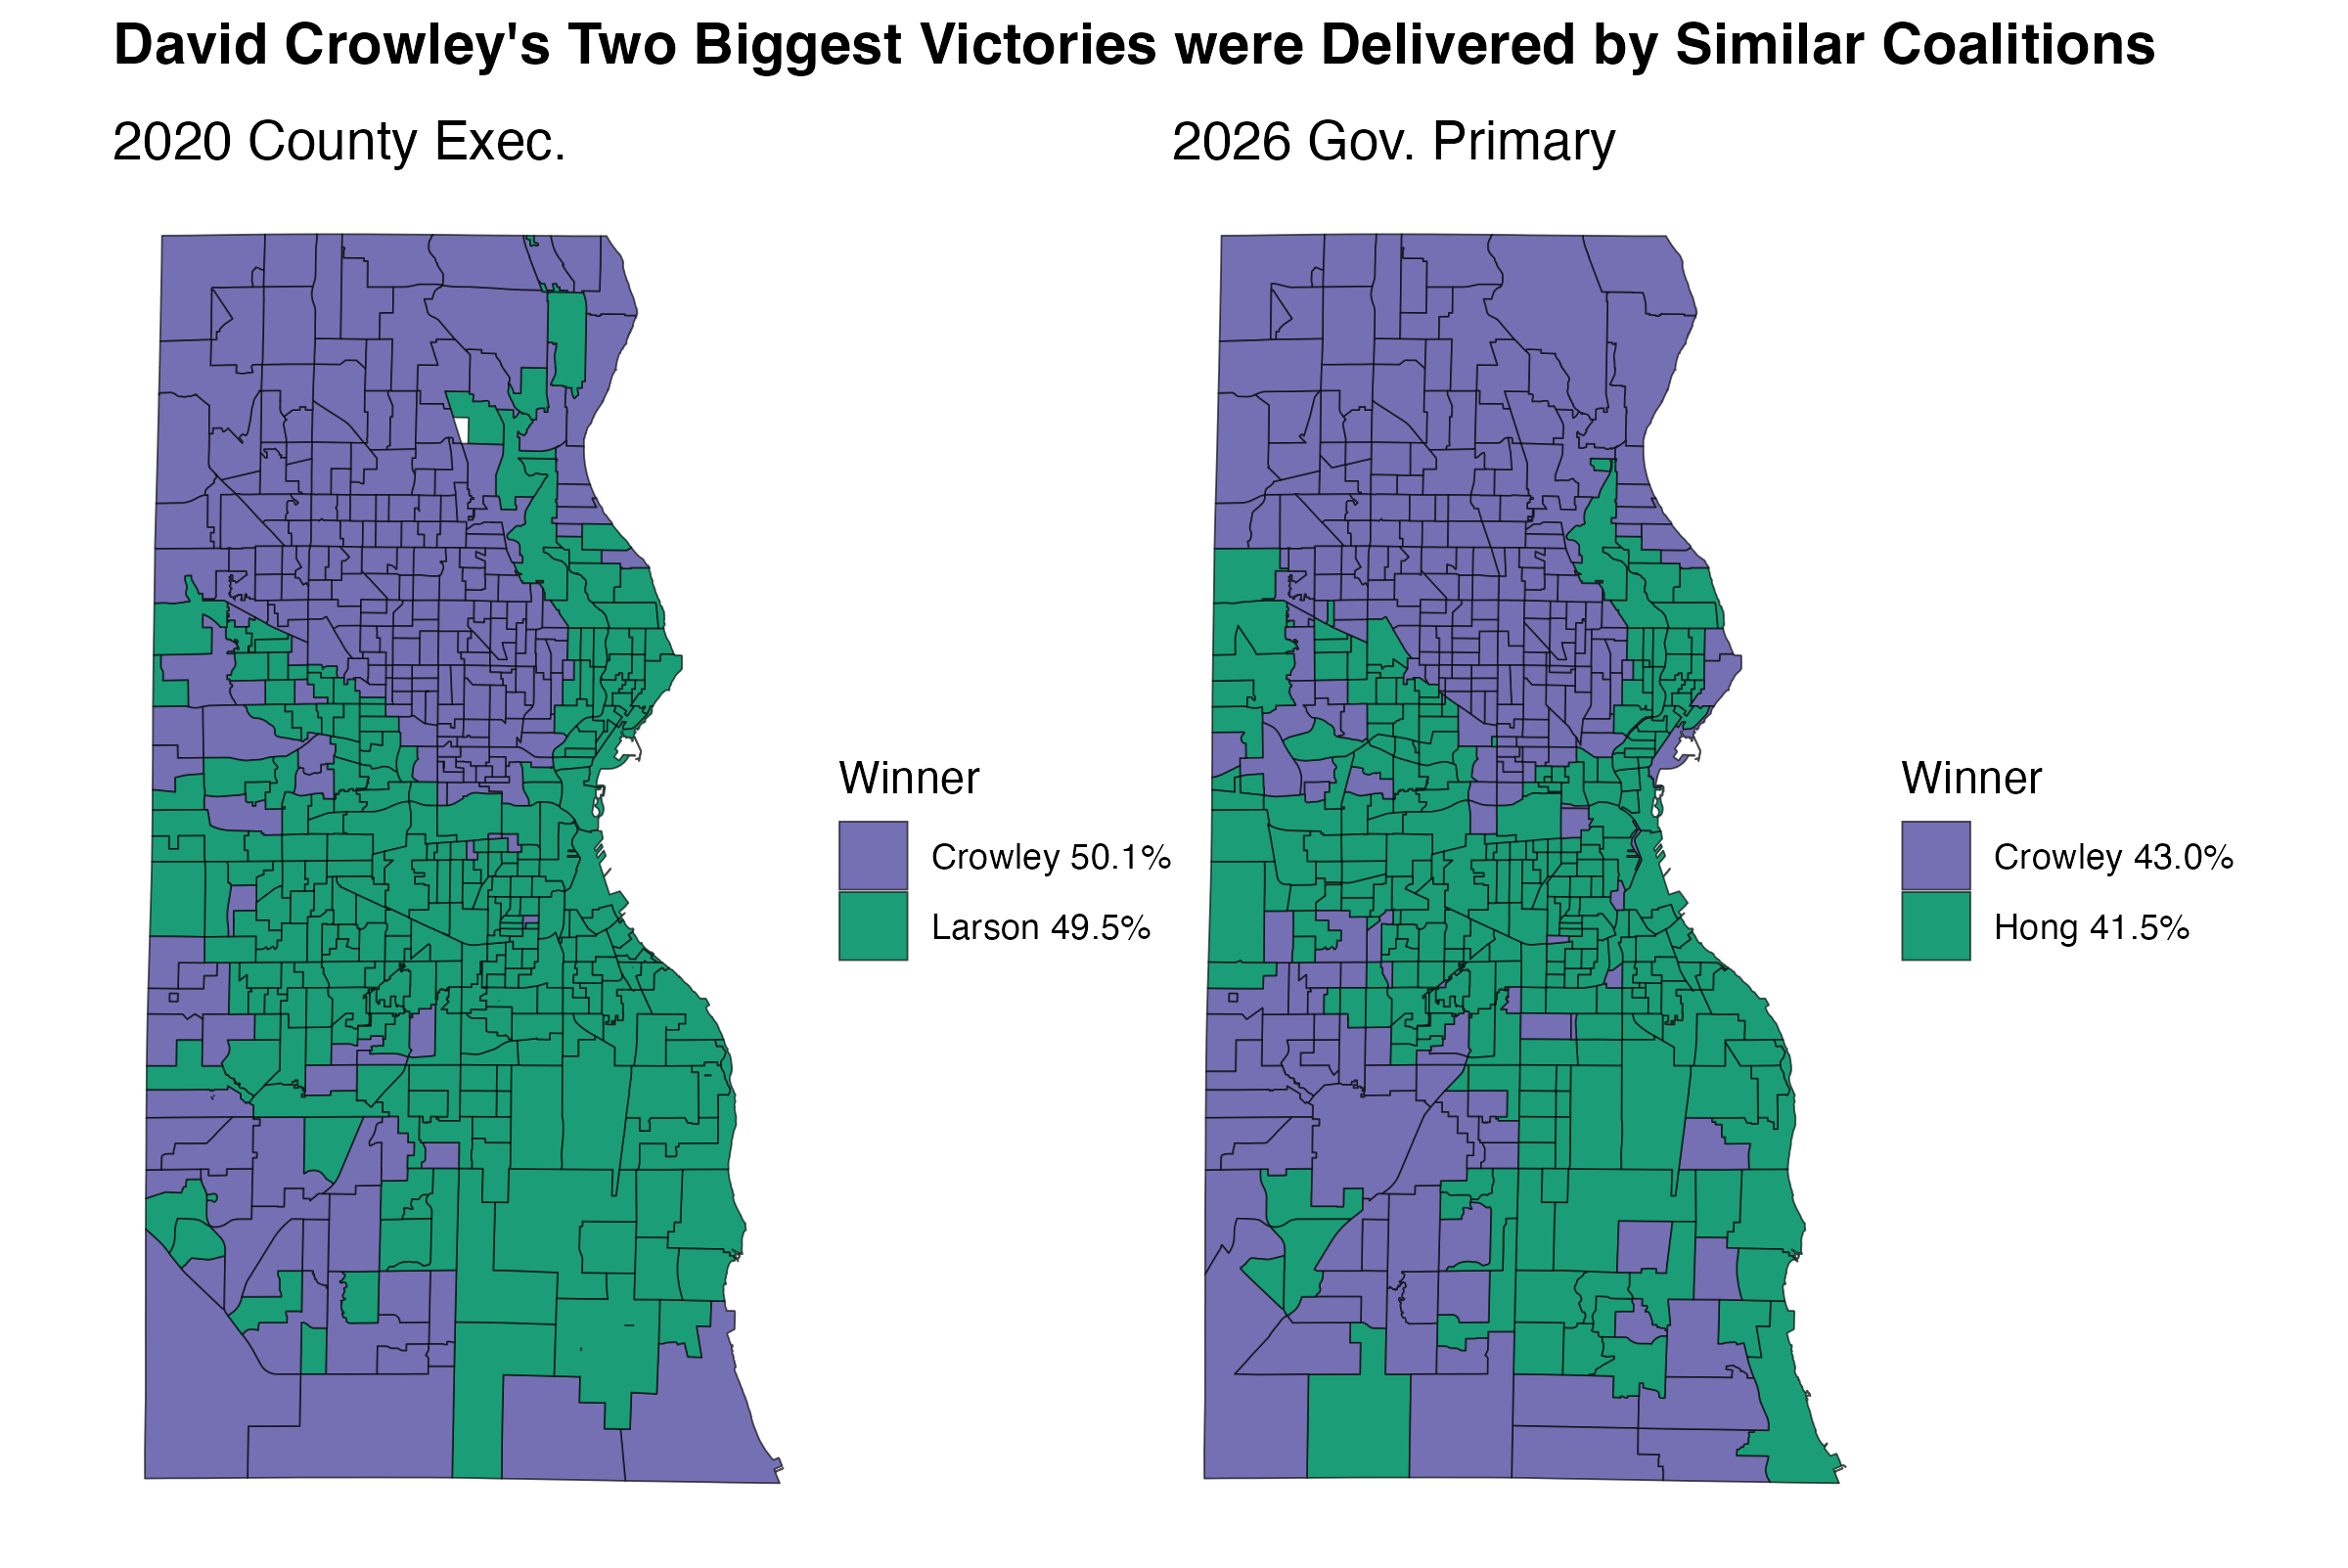
More than just a narrow margin of victory connects Crowley’s 2020 and 2026 campaigns. Consider the following two maps, which show how Crowley fared across each Milwaukee County ward in those two elections.

In both campaigns, Crowley (a moderate Democrat) faced off against a progressive challenger running clearly to his left. In 2020, this challenger was State Senator Chris Larson, whose district covers the east side of Milwaukee. In 2026, his main opponent, Francesca Hong, was a member of the Democratic Socialists of America (and endorsed by Larson).

To a remarkable degree, Hong and Larson won similar parts of Milwaukee County in their respective campaigns against Crowley.

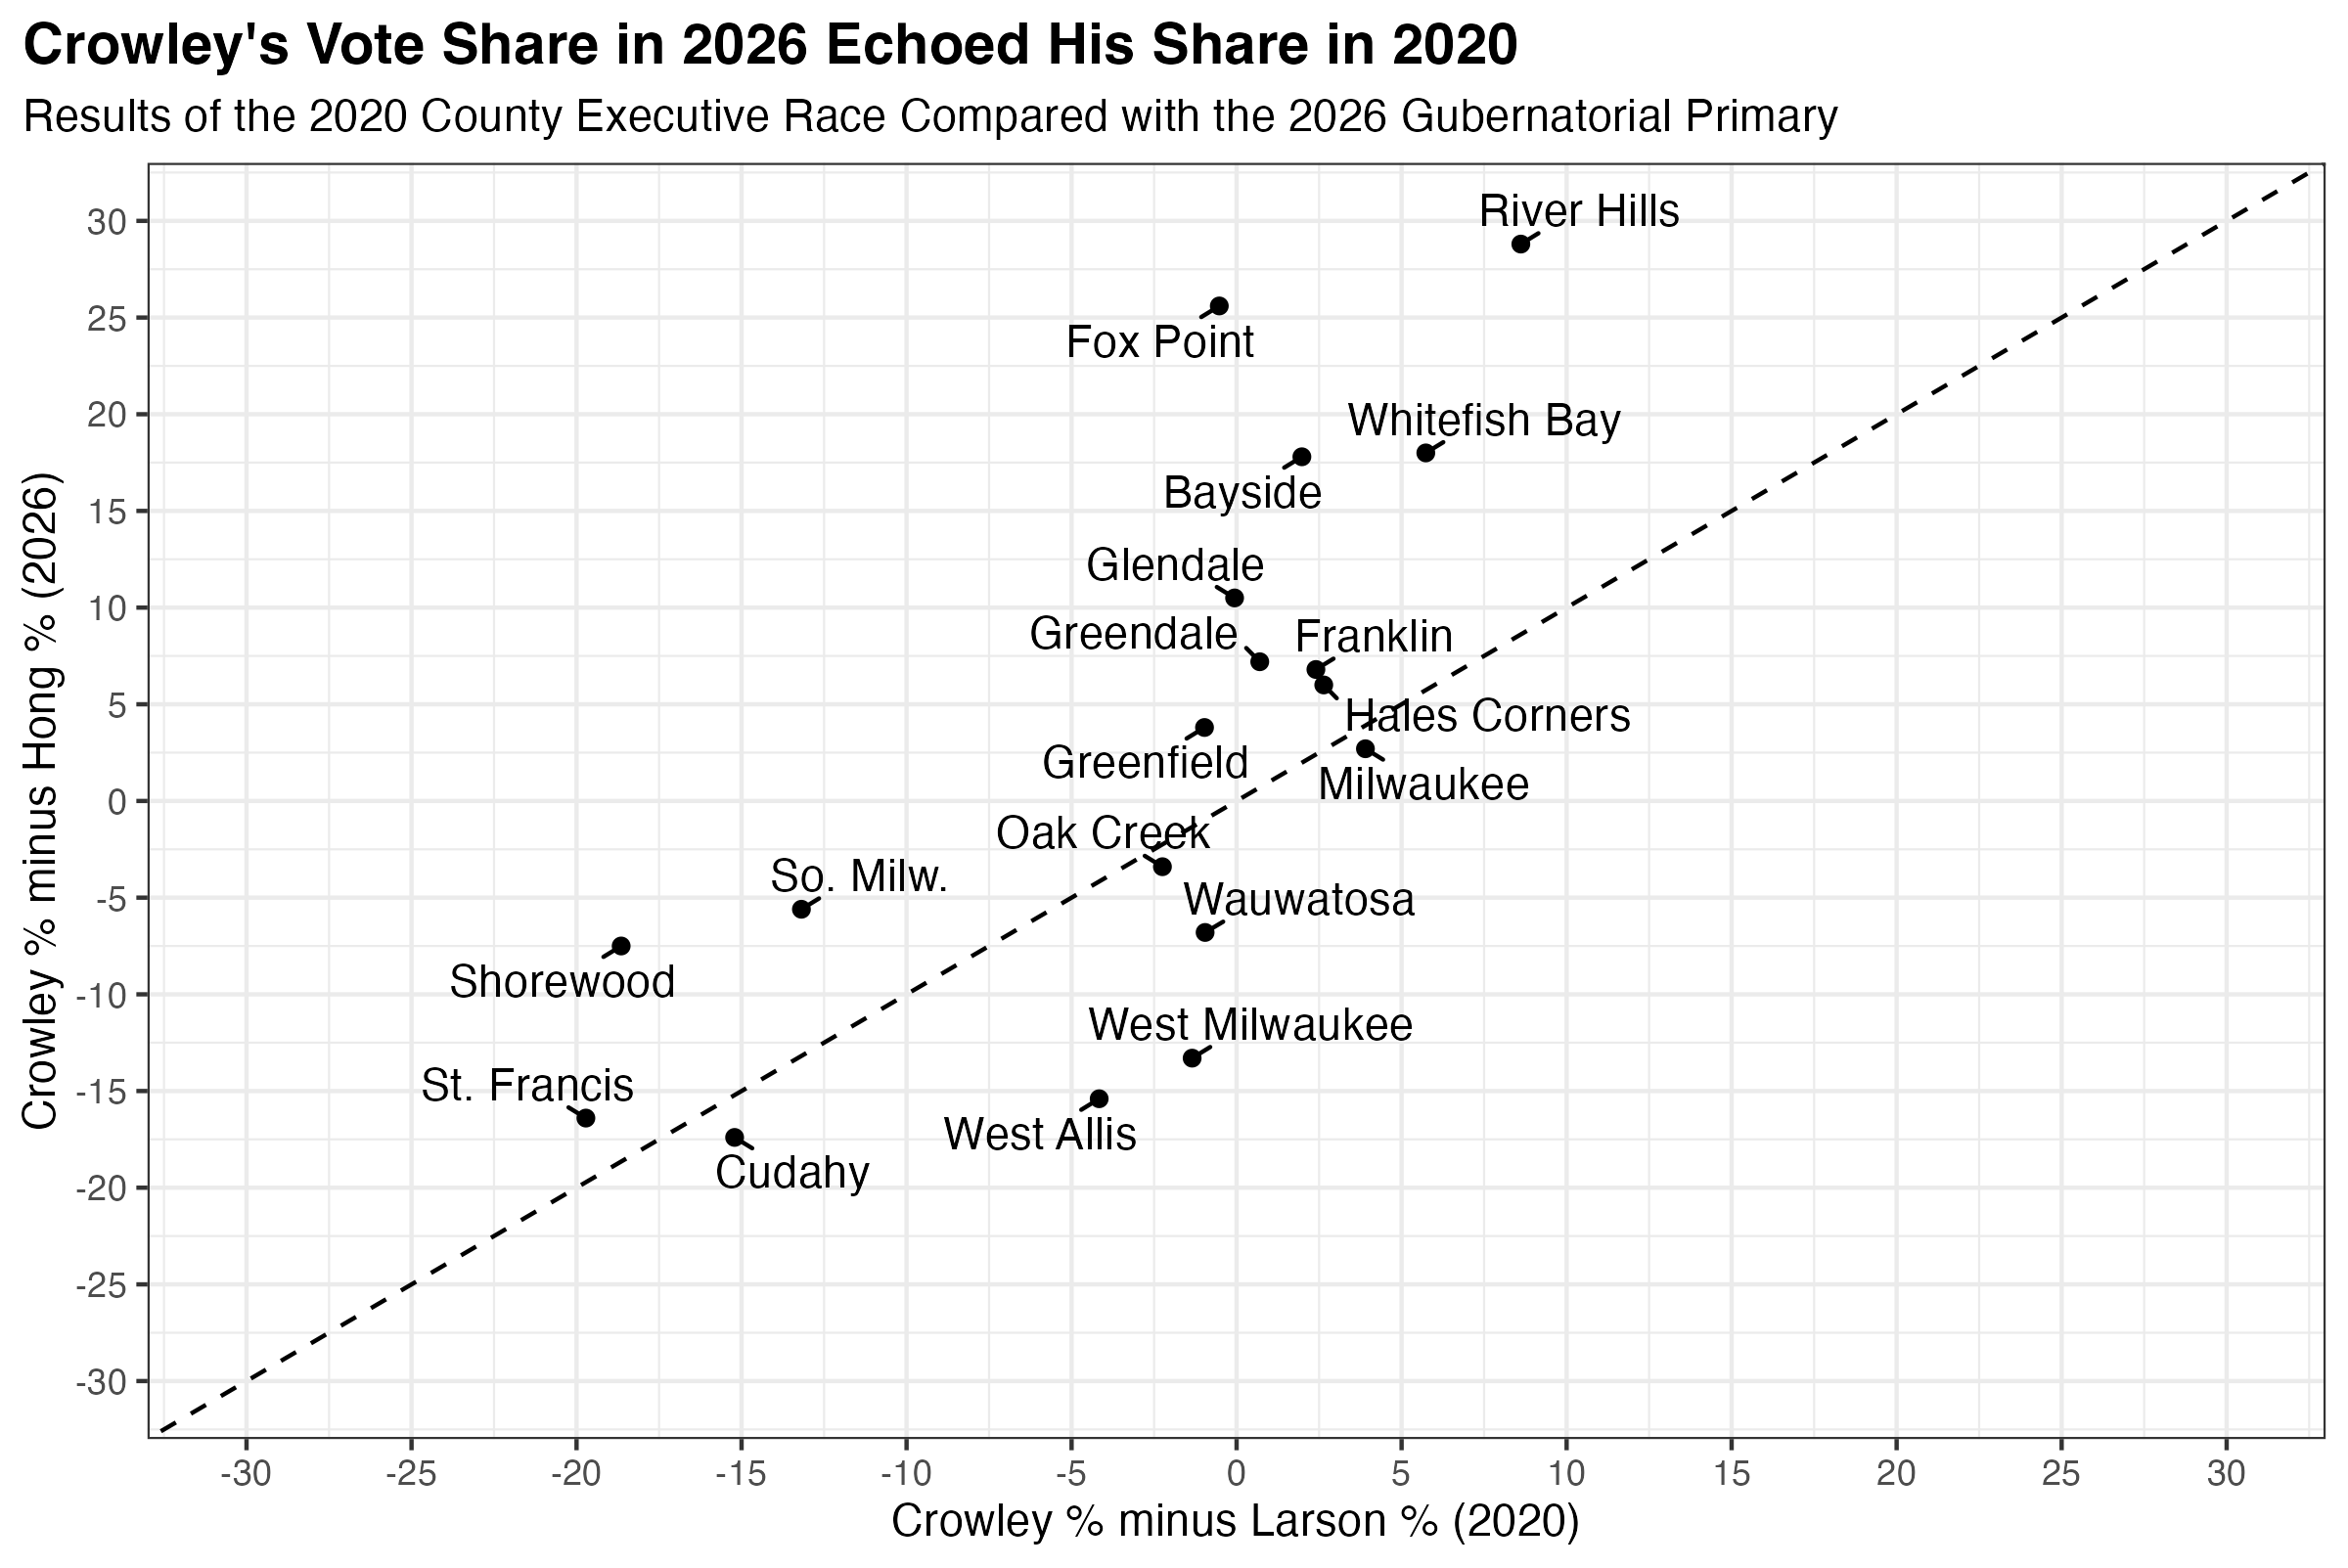
Within the city, Crowley’s significant sources of votes in either election were the majority Black north side along with some of the more conservative, majority white neighborhoods on the city’s western fringe. Hong and Larson won everywhere else, with particular strength in the liberal strongholds between I-43 and Lake Michigan. This progressive strength also extended into adjacent suburbs including St. Francis, Shorewood, Cudahy, and South Milwaukee—all places where Crowley trailed both Hong and Larson.

However, Crowley handily won a different set of suburbs. On the north shore, he carried River Hills, Bayside, and Brown Deer. To the southwest, he won Greenfield, Greendale, Franklin, and Hales Corners. His support grew the most on the north shore between these two elections. For example, he ever-so-slightly lost Fox Point to Larson in 2020, but he defeated Hong in that wealthy suburb by more than 25 points.

In other words, Crowley reliably draws support from a seemingly contradictory set of places. In Milwaukee County, he wins the poorest wards and the richest, the most Black and the most white, the most Democratic and the most Republican.

This coalition has served Crowley well in campaigns against challengers to his left. Now, for the first time in his career, he will need to test his political skills against a Republican opponent.

Bonus map

Wisconsin’s elections are independently administered by each of its 72 counties. This means that there isn’t an official source for statewide ward-level election returns until the state Elections Commission collects and certifies them several weeks after the election. In the meantime, it is my custom to collect and standardize ward results from as many counties as practical. Here is a link to an interactive map containing the ward results I’ve gathered so far for the Democratic primary. Save the link; as I add more counties, the map will automatically display that data.

Continue ReadingDavid Crowley Wins an Upset with a Familiar Coalition Behind Him

Lessons from Wisconsin’s Last Competitive Democratic Primary

On Tuesday, Wisconsin’s Democrats will choose their nominee to replace Governor Evers. Primaries like this one provide a unique glimpse of divisions within a party, but they don’t happen very often. The last time Democrats held a seriously contested statewide primary was actually the 2018 selection of Tony Evers to challenge then-incumbent Republican Governor Scott Walker.1

The 2026 primary features frontrunner Francesca Hong, a democratic socialist, vs. a field of candidates representing other tendencies in the Democratic party. As of this writing, four candidates remain actively campaigning while a further three have dropped out but will nonetheless remain on the ballot.

The field was even larger in 2018, when 10 candidates appeared on the ballot, only two of whom had withdrawn their campaigns ahead of election day. While we wait for the results of the 2026 primary, I thought now would be a good time to revisit the results from eight years ago. What lessons does that election hold for Wisconsin’s Democrats today?

A fractured electorate made Evers’ plurality look dominant

After eight years as governor, Evers is now among the best-known politicians in Wisconsin, but he was far from the obvious choice to many Democratic movers and shakers in 2018. His only previous electoral experience was running five times (losing twice) for state Superintendent of Public Instruction. Still, in this role, he was the most prominent elected Democrat in state government, and he drew endorsements from the state’s two former Democratic senators, Russ Feingold and Herb Kohl.

Most people, 58%, voted for someone other than the winner, Tony Evers. However, the non-Evers voters were so fractured that his 42% of the vote represented a dominant victory over any other individual candidate. No single candidate consolidated non-Evers support.

The second-place candidate, Mahlon Mitchell, had the most support from labor unions. He was endorsed by the state AFL-CIO and SEIU, along with AFSCME, Amalgamated Transit Union, and IUOE locals. In the end, he won 16% of the vote.

Kelda Roys was endorsed by many progressive organizations and celebrities, including EMILY’s List, NARAL, NOW, Bon Iver, and Sarah Silverman. She won 13%.

Nobody else cracked 10%, but four more candidates still received at least 5%, or 1-in-20 votes cast. Kathleen Vinehout, a state senator from rural western Wisconsin, won 8%. Mike McCabe, the former director of the Wisconsin Democracy Campaign, took 7%. Matt Flynn, an attorney from Milwaukee who had served as state Democratic Party chair in the early 1980s, ran a campaign largely distinguished by the strength of his opposition to Walker’s then-recently announced Foxconn deal. He won 6%. Paul Soglin, a fixture of Madison politics who at that point had served as mayor for 21 of the preceding 45 years, won 5%.

Rounding out the field, the two withdrawn candidates Andy Gronik and Dana Wachs nonetheless received about 1% each. This was still more than the last candidate, a little-known attorney from Racine named Josh Pade. His campaign remained active through Election Day, when he won 0.4%.

Results of the 2018 WI Democratic Gubernatorial Primary
votespct
Tony Evers225,08241.8%
Mahlon Mitchell87,92616.3%
Kelda Roys69,08612.8%
Kathleen Vinehout44,1688.2%
Mike McCabe39,8857.4%
Matt Flynn31,5805.9%
Paul Soglin28,1585.2%
Andy Gronik16,6271.2%
Dana Wachs14,2160.8%
Josh Pade1,9080.4%
Scattering2110.0%
Paul Boucher (Write-in)100.0%
1 Withdrew before the election

Evers won (almost) everywhere, while other candidates were popular in only certain kinds of places

Evers won 67 of the state’s 72 counties. Support for the other candidates often followed regional lines. Kathleen Vinehout exhibited this tendency to the greatest degree. Despite finishing in a distant fourth, she actually won a plurality in four counties, all in her rural home region. Mahlon Mitchell, while taking second place, won a plurality in just one county: Milwaukee. Here, as elsewhere in the state, his support was concentrated among Black voters and in traditional union strongholds.

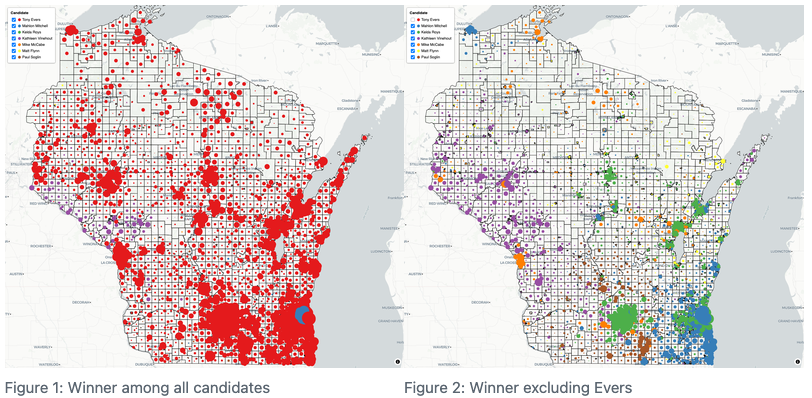
None of the other candidates won a county, but their support was still often regionally defined. To show this, I’ve created a map with layers for each candidate. Click here to access the interactive version. For each reporting unit, the map plots the votes for a given candidate as a circle whose radius corresponds to the number of votes that candidate received. The map allows you to toggle on-and-off layers for each candidate. When multiple candidates are selected, only the winner of a given ward is shown. Click on any ward to see its complete election results for all candidates.

Below are two screenshots, illustrating these patterns.

In the first map, only the winner of each ward is shown. Tony Evers’ support (red) came from nearly everywhere. Notice the small number of purple dots in the west-central part of the state. These are wards won by Kathleen Vinehout. Also notice the dark blue circles emerging from southeastern Wisconsin. These are the wards in Milwaukee carried by Mahlon Mitchell.

The second map shows the results when Evers support is removed. Remember that Evers won only 42% of the vote, so this map actually shows a substantial majority of the votes cast. Here many more patterns are evident.

Vinehout’s territory (purple) grows to include most of western Wisconsin, even stretching all the way into the Madison suburbs. She received scarcely any support in the eastern half of the state, with the interesting exception of Door County’s upper half.

Mitchell drew support (blue) throughout southeastern Wisconsin and the state’s more industrial centers–including Milwaukee and its mostly working-class southern suburbs, Racine, Kenosha, Beloit, Wisconsin Rapids, and Superior. This latter city is noteworthy. In Milwaukee, Mitchell’s support strongly correlated with race. He was, after all, the only African American candidate, and he did best in the majority-Black wards on the north side. But fewer than 2% of Superior’s residents were Black in the 2020 census. While the city overall voted for Evers, Mitchell was the second choice in every single Superior ward, a pattern that does not occur anywhere else in northwestern Wisconsin. The most plausible explanation is that his strong union support made the difference in this city, where port-related heavy industry still plays a large role in the economy.

The most liberal candidate in 2018 was Kelda Roys (green). She drew support from a different set of cities, including most of Madison, Appleton, Stevens Point, Wausau, much of Green Bay, and Milwaukee’s wealthiest neighborhoods and suburbs. In a general election, many of these cities in the Fox Valley and north-central Wisconsin are politically quite purple, but judging by the primary results, the Democrats who do live there are among the more liberal in the state.

Mike McCabe (orange), who ran an outsider-y, populist campaign, was particularly popular in places like La Crosse, Waupaca, Eau Claire, and much of the northwoods. He came in a strong second to Evers in rural northern communities like Minocqua, Park Falls, Ashland, Washburn, and Bayfield.

Despite his long mayoral tenure, Paul Soglin (brown) finished lower than second in all but a handful of Madison wards. However, he showed surprising popularity in many surrounding communities, taking second in places like Janesville, Monroe, and Baraboo. Perhaps many of the residents in these towns were former Madisonians with memories of Soglin’s heyday.

Evers’ support was spread across most demographic groups

To better understand the sources of support for each candidate, I allocated the election results into census tracts and used ecological inference to estimate the share of major demographic groups supporting the top candidates. These are just estimates, and there is a fair degree of uncertainty around them. (An important source of this uncertainty is that the model uses statistics for the citizen voting age population in each tract, because we don’t know the demographics of the actual Democratic primary voters themselves.)

For the most part, Evers drew relatively even levels of support across these different categories. I estimate that he won 47% of the vote among those with no more than a high school degree–not much different than his 42% among graduate degree holders. Likewise, he drew 39% from those with household incomes below $50,000 and 40% from those of $100,000 or more.

There was a difference by age. Evers won an estimated 34% of the vote among those under 30. He did much better, 49%, among voters ages 65 and up. But by far the biggest difference in the table is along racial lines. I estimate that Evers received 44% from white voters and 37% from Hispanic voters, but only 8% from Black voters in the primary. Instead, Black voters supported Mahlon Mitchell by 81%. Mitchell, I estimate, was supported by 11% of white and 29% of Hispanic voters.

As one might expect, Kelda Roys (the most progressive candidate in the race) drew her strongest support from the most educated voters and was weakest with the least educated. She won an estimated 21% of votes cast by those with a graduate degree, compared to 7% among those with no more than a high school diploma. In contrast, Roys’ supporters showed little variation by age.

Estimated support for Candidates in the 2018 WI Democratic Primary for Governor
Among Selected Demographic Groups
EversMitchellRoysVinehout
race
White44%11%14%9%
Black8%81%2%1%
Hispanic37%29%10%3%
education
High school or less47%20%7%7%
Some college37%17%12%9%
Bachelor’s degree40%13%18%9%
Graduate degree42%10%21%8%
income
Under $50k39%22%10%8%
$50k to $99k46%16%12%8%
$100k plus40%10%17%10%
age
18-2934%21%14%7%
30-4445%17%12%7%
45-6439%16%13%10%
65+49%9%12%9%
These estimates were calculated by allocating reporting unit election totals to census tracts, and then estimating vote shares using ecological inference as developed by Gary King. The model is the multinomial-Dirichlet RxC estimator of Rosen, Jiang, King, and Tanner (2001). Analysis by John Johnson (Marquette Law School Lubar Center).

Lessons for 2026

What lessons for the 2026 primary might we apply from this data?

Lesson 1: Don’t be surprised when progressive Democrats campaign Up North. It’s not just for the photo ops. In a primary, cities like Wausau and Stevens Point can be meaningful sources of support for the most liberal candidates.

Lesson 2: Regional candidates probably can’t win a primary. David Crowley’s campaign so far looks similar to Mahlon Mitchell’s in 2018. By itself, strong support from unions and Black voters is probably only good enough for second place.

Lesson 3: Winning the primary by a plurality of the vote is not necessarily a sign of weakness to come in the general election. Evers only got 42%, meaning most people wanted somebody else. He still won in November.

Lesson 4: Whoever wins the 2026 Democratic primary will need to unify a much more fractured party than Evers faced in 2018. His campaign won the 2018 primary by appealing to pluralities of nearly every demographic group. Differences in support by age played only a small role in 2018. This looks to be much different in 2026. The final Marquette Law Poll found that two-thirds of voters under 30 supported the frontrunner Francesca Hong, compared to just 14% of those 60 and up.

Footnotes

  1. I’m not counting the 2020 presidential primary, during which Bernie Sanders’ campaign was still technically operational. However, by Wisconsin’s primary, it was already clear that Biden would be the nominee, and Sanders suspended his campaign the following morning.↩︎
Continue ReadingLessons from Wisconsin’s Last Competitive Democratic Primary