A Closer Look at the Campus Vote in Wisconsin
OnOne of the clearest contributors to Trump’s 2024 presidential victory was his newfound support among young voters. Estimates vary, but all agree that, when considered by age, his support grew the most with voters under 30. According to Pew, Trump’s support grew by 4 percentage points among these voters; Catalist put his improvement at 6 points. In Wisconsin, I’ve calculated that Trump’s vote share grew by 3 percentage points in the youngest fifth of the state, while it grew just a single point in every older quintile.

College campus wards offer a useful way to measure a particular slice of the youth vote—students who’ve just entered the electorate. You might expect that Trump’s improvement with young voters was limited to young people who don’t go to college, given the way educational polarization works in the rest of the electorate. But this isn’t what the data show. Trump saw some particularly large gains on certain Wisconsin college campuses.

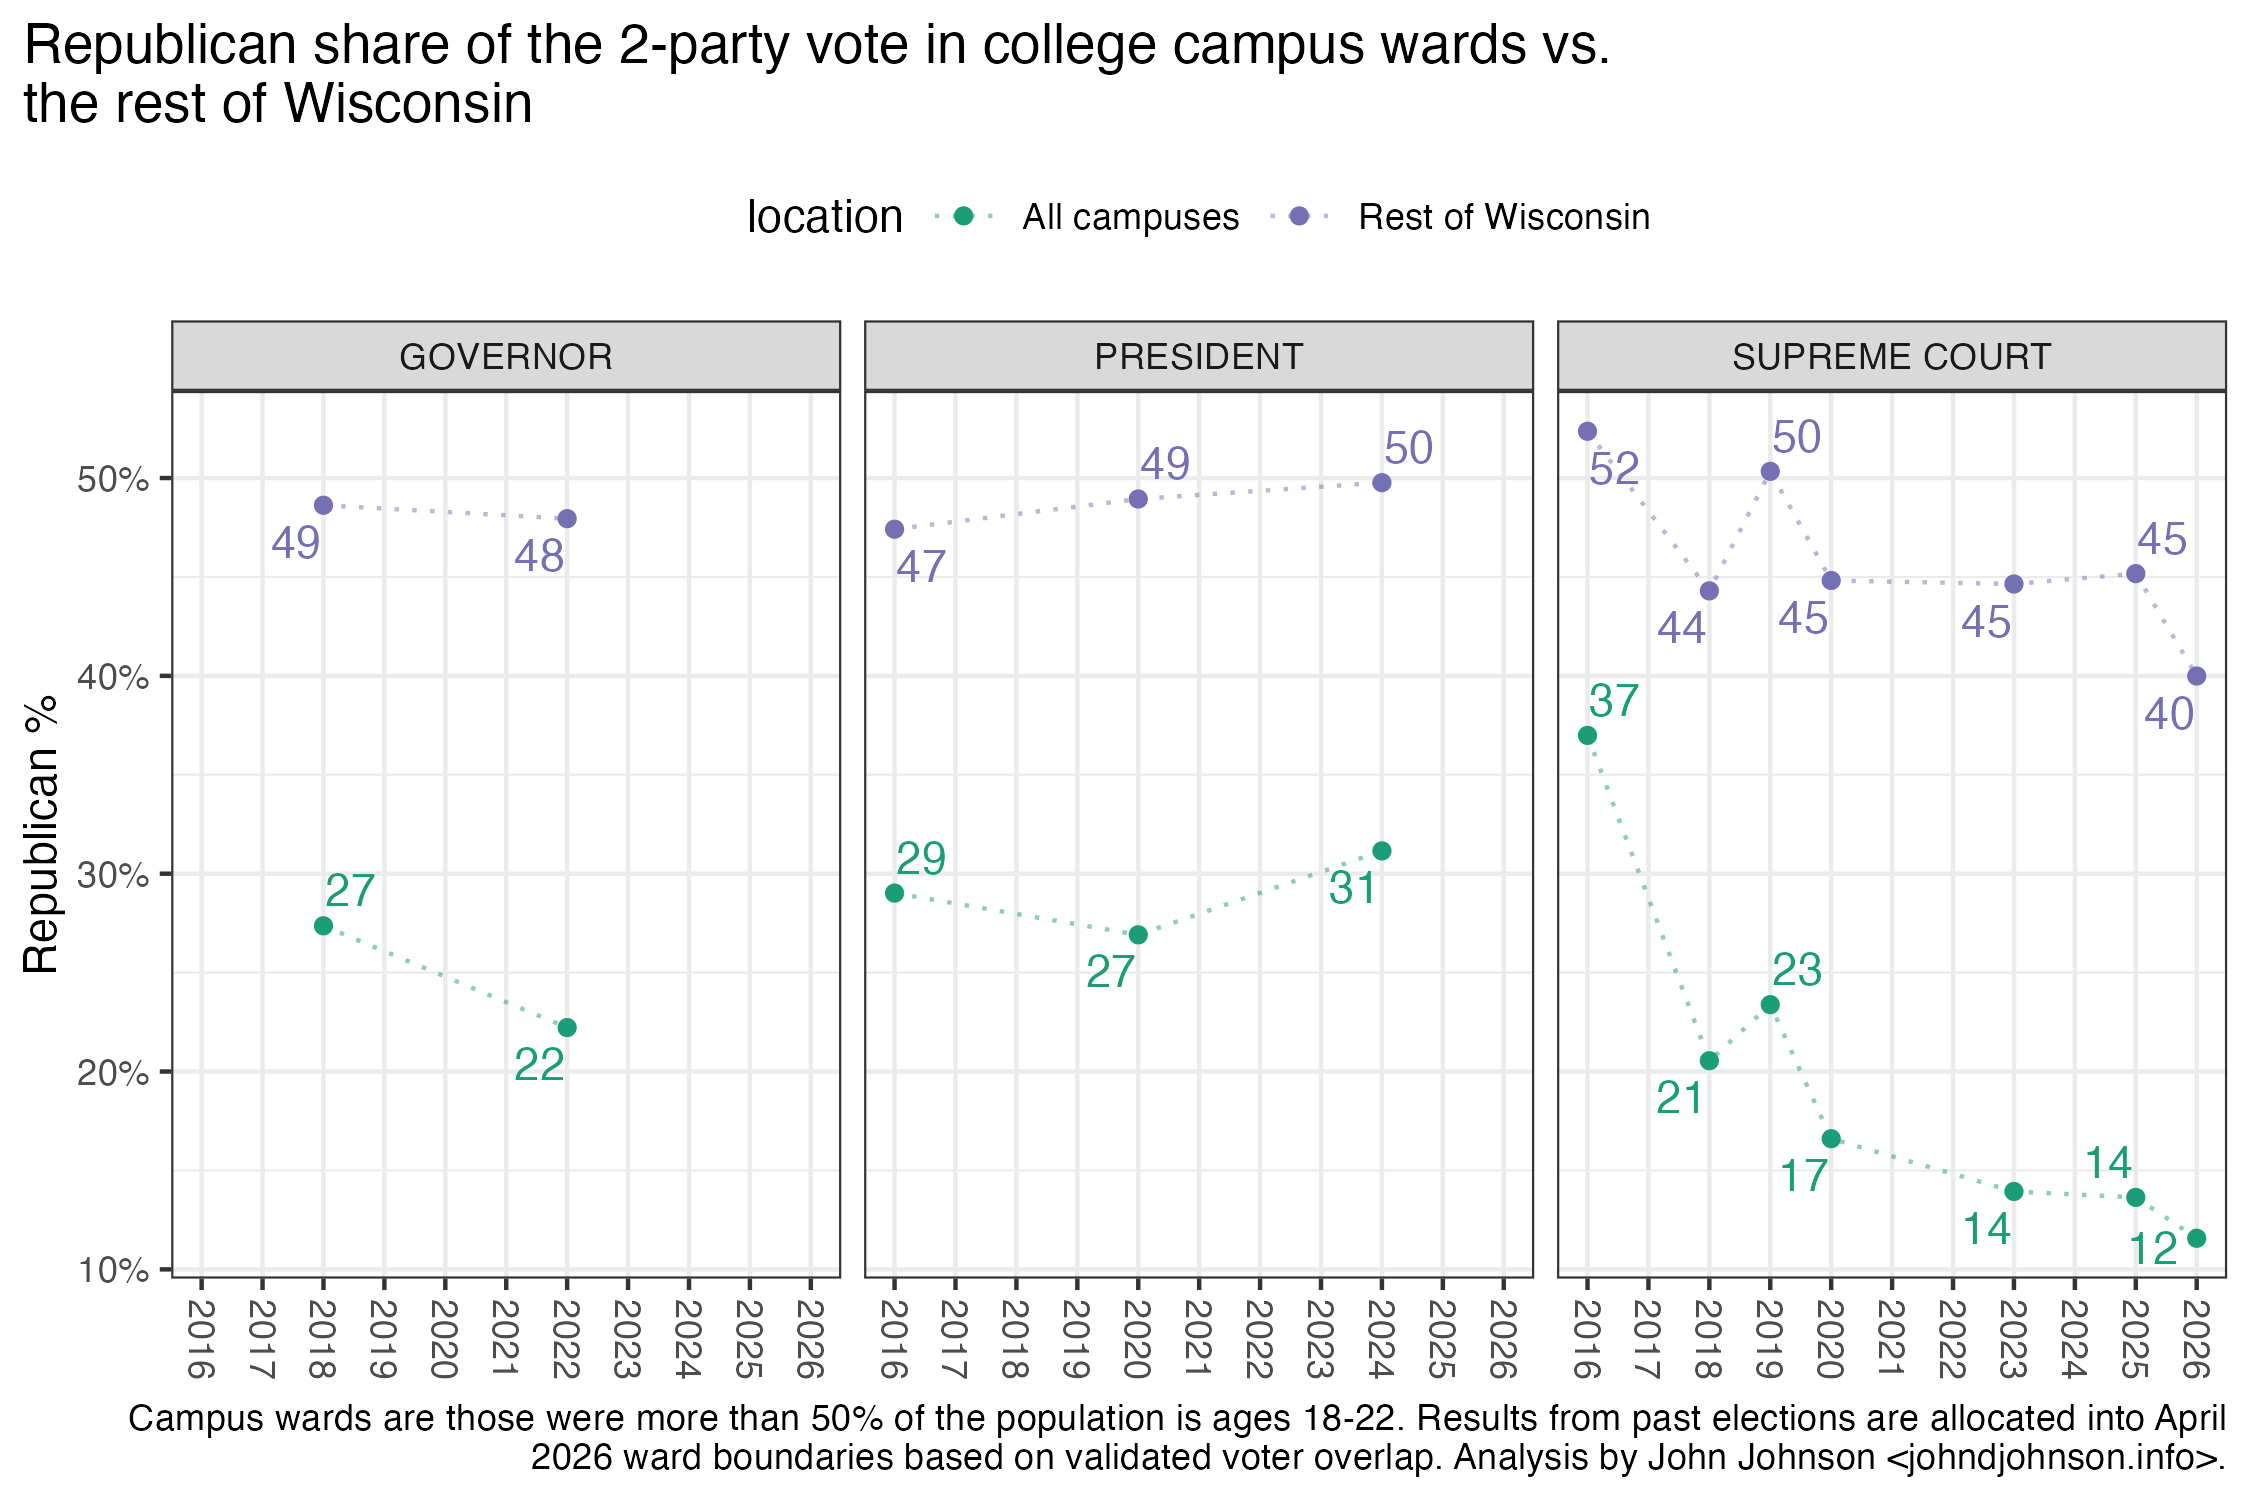
However, across these campuses, Republican performance has cratered since Trump’s 2024 election. In April 2025, the Republican-endorsed Supreme Court candidate Brad Schimel received 13.6% in the same wards that gave Trump 31.2% earlier in the same school year. This was the lowest share of any conservative candidate for President, Governor, or State Supreme Court Justice since at least 2016. Then, in 2026, the Republican endorsee Maria Lazar set a new record low in college campus vote share for a conservative candidate, with 11.6%.

Turnout fell among college voters in these elections. The campus wards made up 0.91% of the electorate in November 2024, dipping to 0.78% in April 2025 and 0.55% in April 2026. This suggests two plausible interpretations of why conservative support fell so much in those elections. One is that many college voters changed their minds and voted for a liberal court candidate after casting a ballot for Trump in 2024.

The other possibility is that Trump’s college supporters simply didn’t turn out for April elections in the same numbers as their liberal peers. Over the past 10 years, high-turnout elections have resulted in better Republican performances in campus wards, both overall and relative to the rest of the state. Republican reliance on low-propensity voters is notorious, but it’s usually attributed to their strength with less-educated citizens who vote less frequently. The patterns on Wisconsin’s college campuses suggest that, even among currently enrolled college students, those with Republican leanings are just less reliable voters than those with Democratic leanings.
The Most and Least Liberal Campuses

The campuses themselves vary a lot in their political disposition. Some match the stereotype of a leafy left-wing enclave, but others are actually proportionally home to more Republican voters than the rest of their host city.

For this analysis, I define campus wards as those where more than half the population was ages 18-22 in the 2020 census.[i] This includes wards corresponding to 12 universities and one college. Three are private and the rest are members of the UW System. Altogether these wards contain about 1.1% of the state’s total population. Because ward boundaries can change over time, I reallocated election results from old ward boundaries into the current ones based on validated voter records.

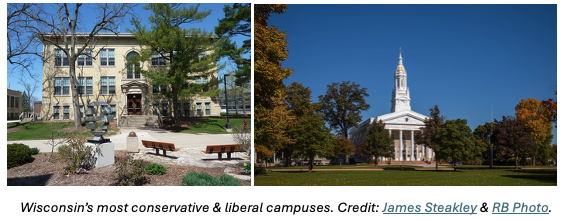
Taking the average of the past 12 elections for President, Governor, and State Supreme Court Justice, the most liberal campuses are Lawrence University, UW-Madison, and UW-Milwaukee. Trump won between 12% and 22% in these campuses’ wards in 2024. Lazar won 3%-8% in April 2026.

On average, the most conservative campuses are UW-Platteville, UW-Whitewater, and UW-Green Bay. Here, Trump won 39%-47% in 2024 and Lazar 13%-22% in April 2026.

Trump did especially well across many of these campuses, winning 50% of the vote in the wards around UW-La Crosse and more than 40% in the UW campuses at Oshkosh, River Falls, Whitewater, and Platteville.
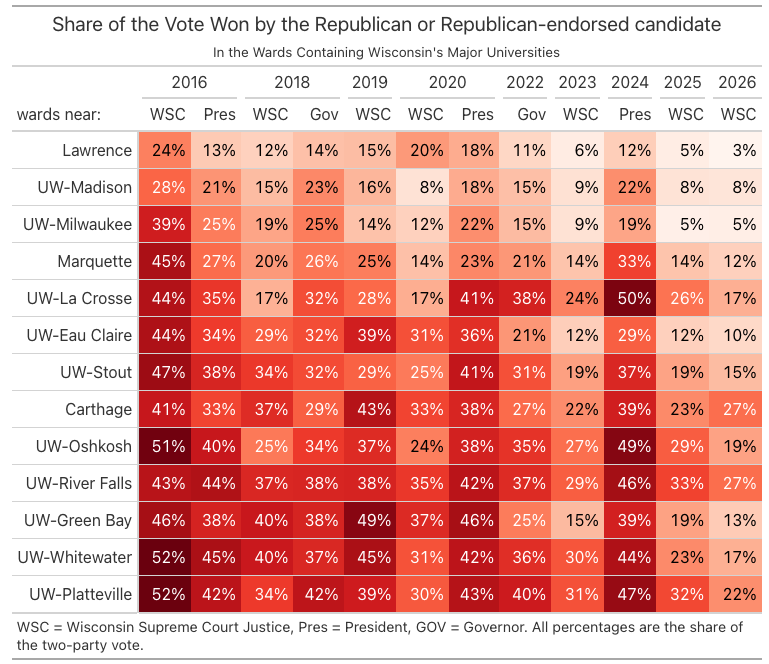
Several campuses—even some very liberal ones—are home to noticeably more conservatives than the rest of their home municipalities. This shouldn’t be surprising. Many schools draw a wide mix of students from across the state, and those students reflect—at least to some degree—the political diversity of their homes.

A good example of this is the state’s flagship university, UW-Madison. Among conservatives, Madison is a bit of a punchline. Lee Dreyfus called it “30 square miles surrounded by reality” in his 1978 gubernatorial campaign.

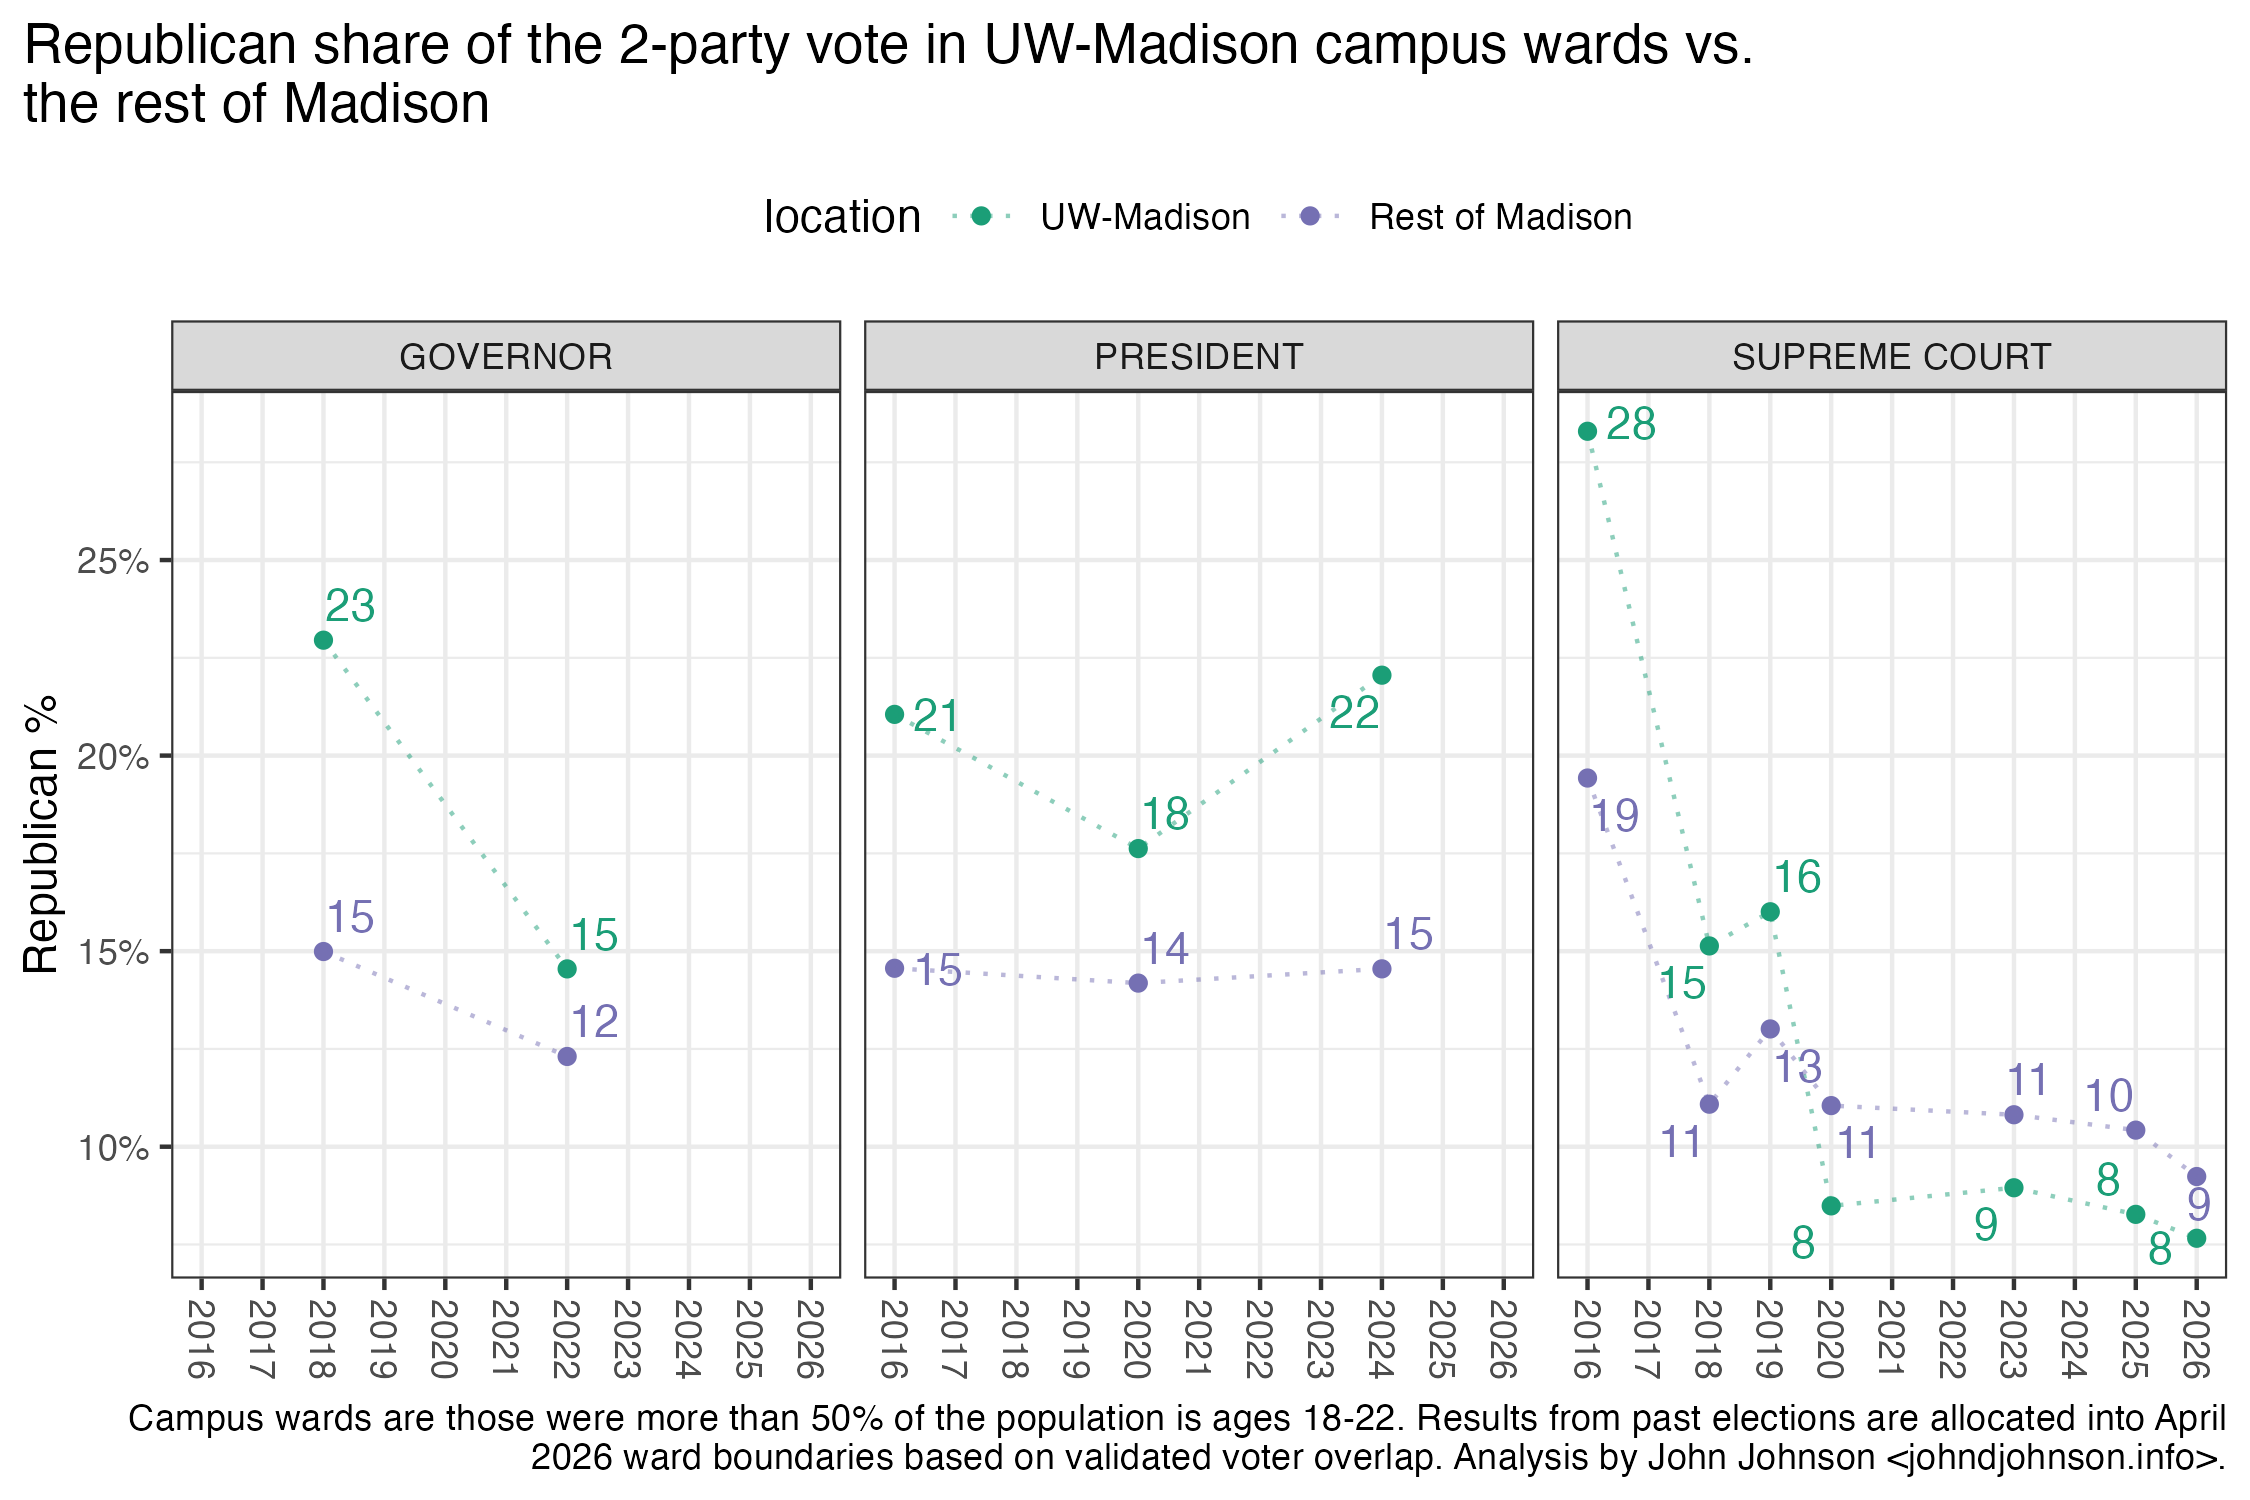
In UW-Madison’s campus wards, Trump received 21% of the vote in 2016, 18% in 2020, and 22% in 2024. But in the rest of the City of Madison, Trump received 15%, 14%, and 15%, respectively. There are wards on the east side of Madison’s isthmus where Trump received fewer than 1 in 20 votes in 2024. But across UW-Madison’s student-occupied wards, more than 1 in 5 voted for Trump.

This solid Trump-voting minority on UW-Madison’s campus has done conservatives little good during April Supreme Court elections. Since 2020, Republican-endorsed Justice candidates have never gotten out of the single digits in the campus wards, actually lagging their performance in the rest of the city.
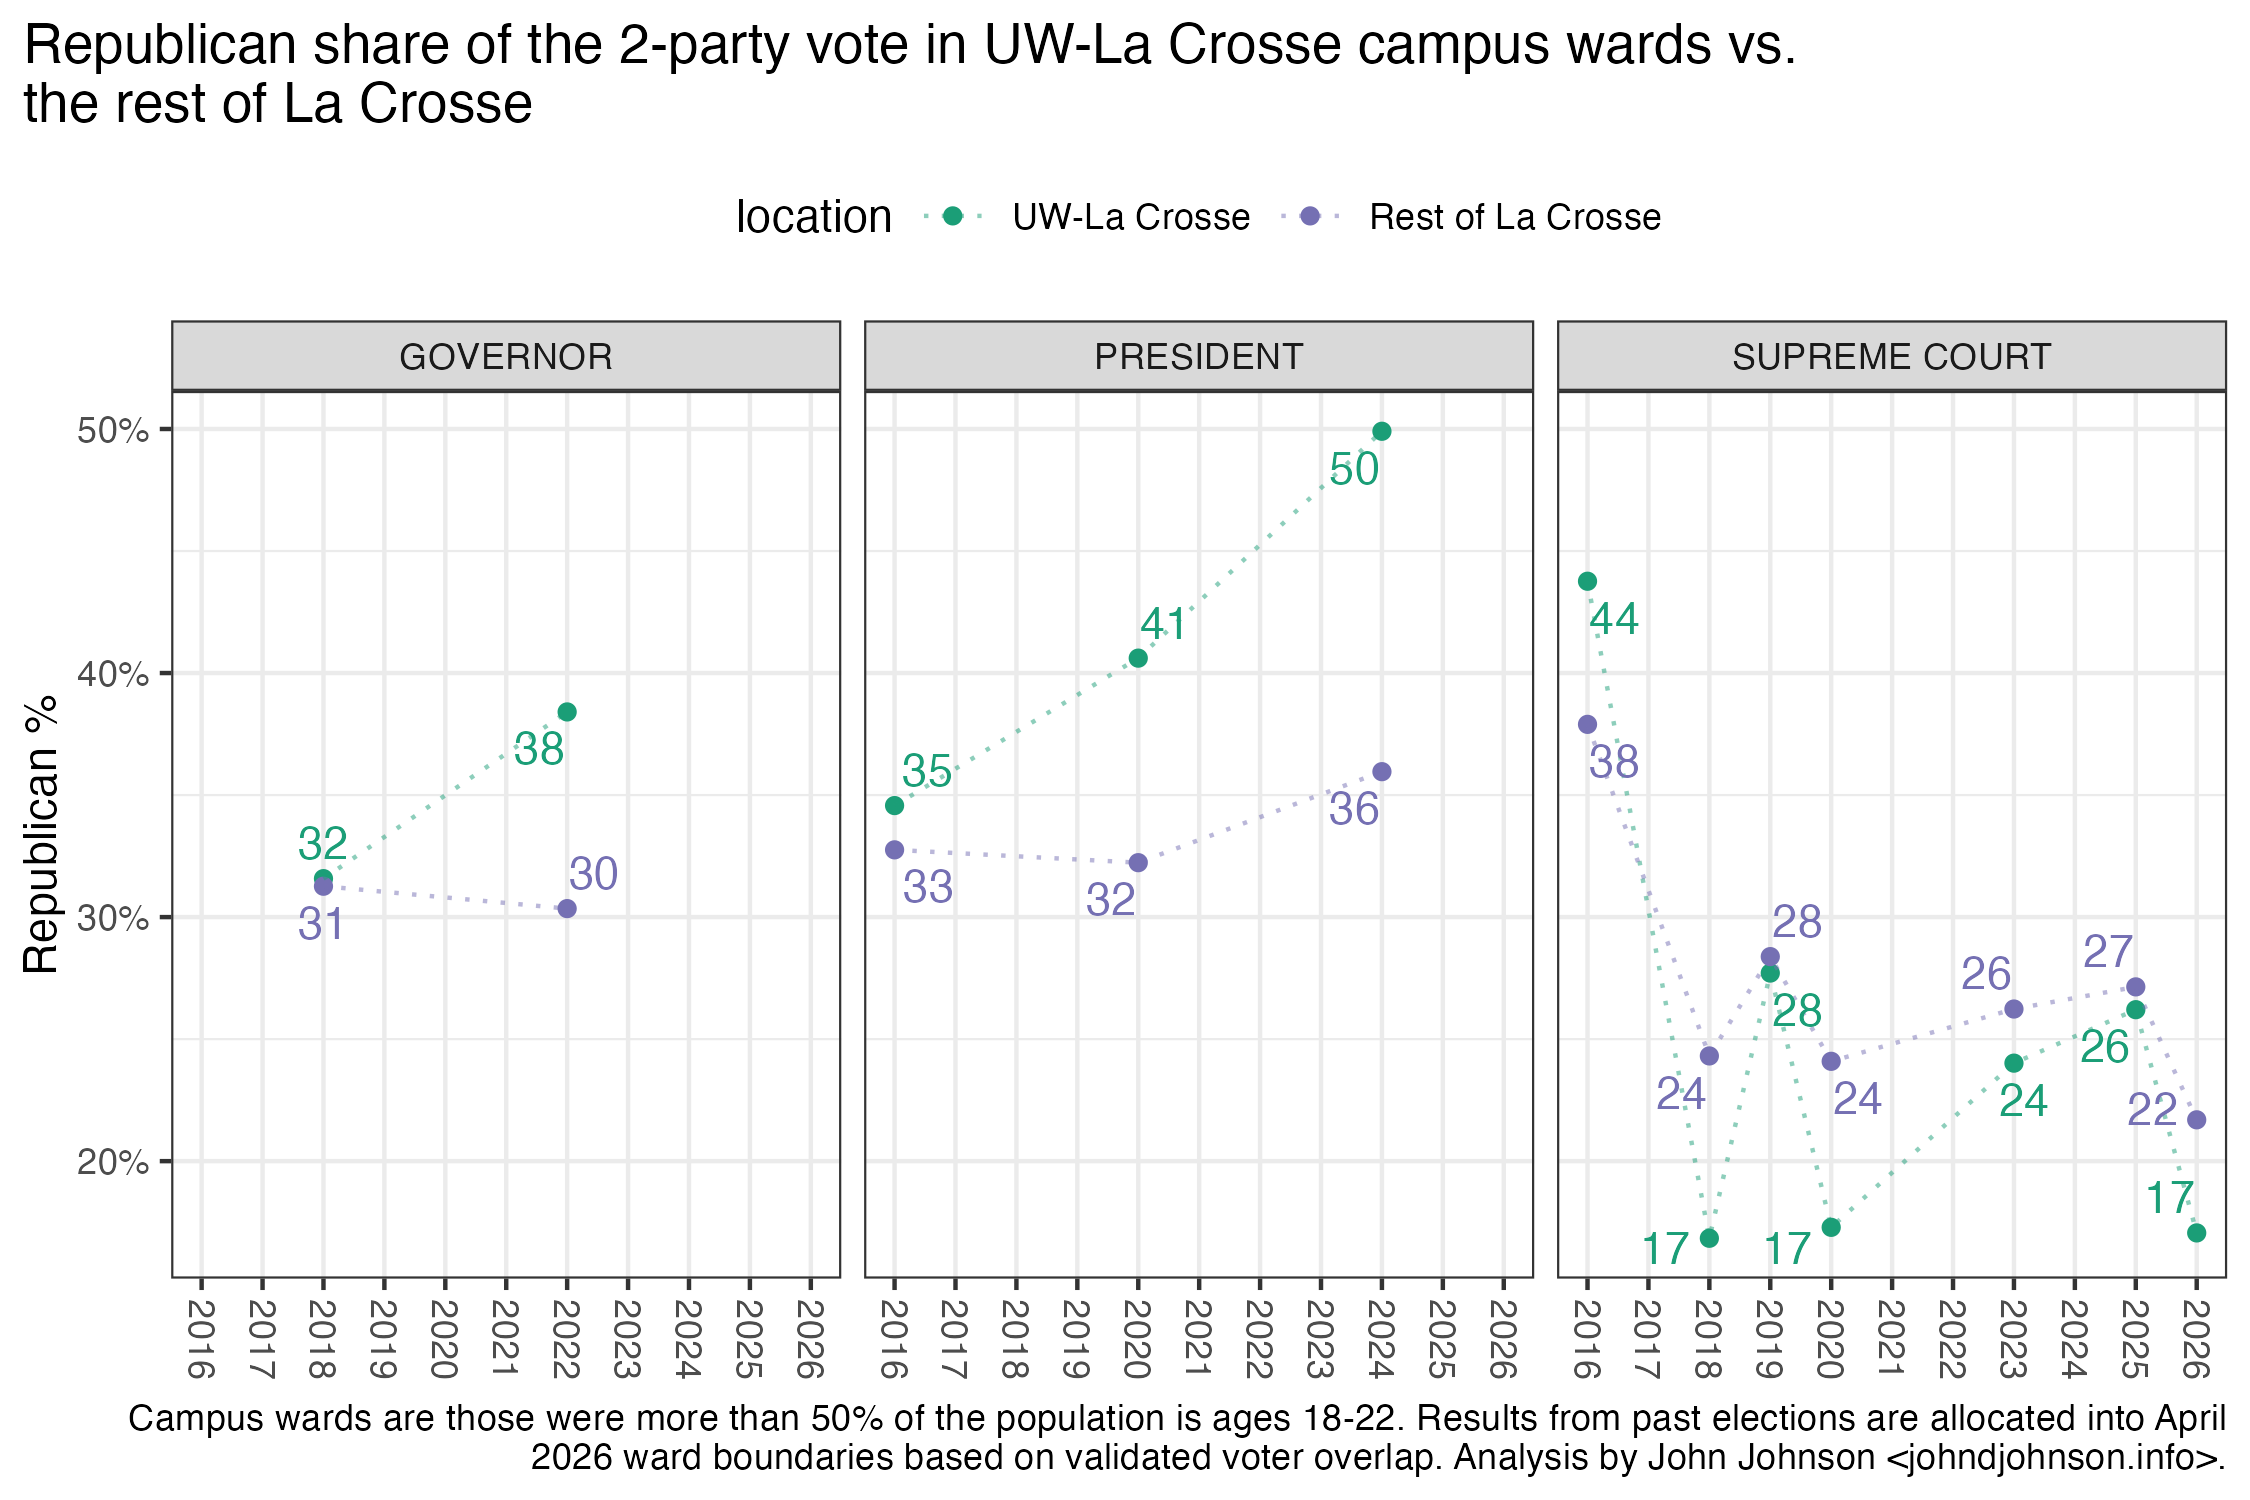
UW-La Crosse also stands out as a place with a noticeable (and growing) town-gown political divide. In La Crosse, the campus wards have grown much more conservative—giving Trump 35% in 2016, 41% in 2020, and 50% in 2024. These wards have always been more conservative than the rest of the city (at least during presidential elections), but the gap has grown from 2 percentage points in 2016 to 14 in 2024.
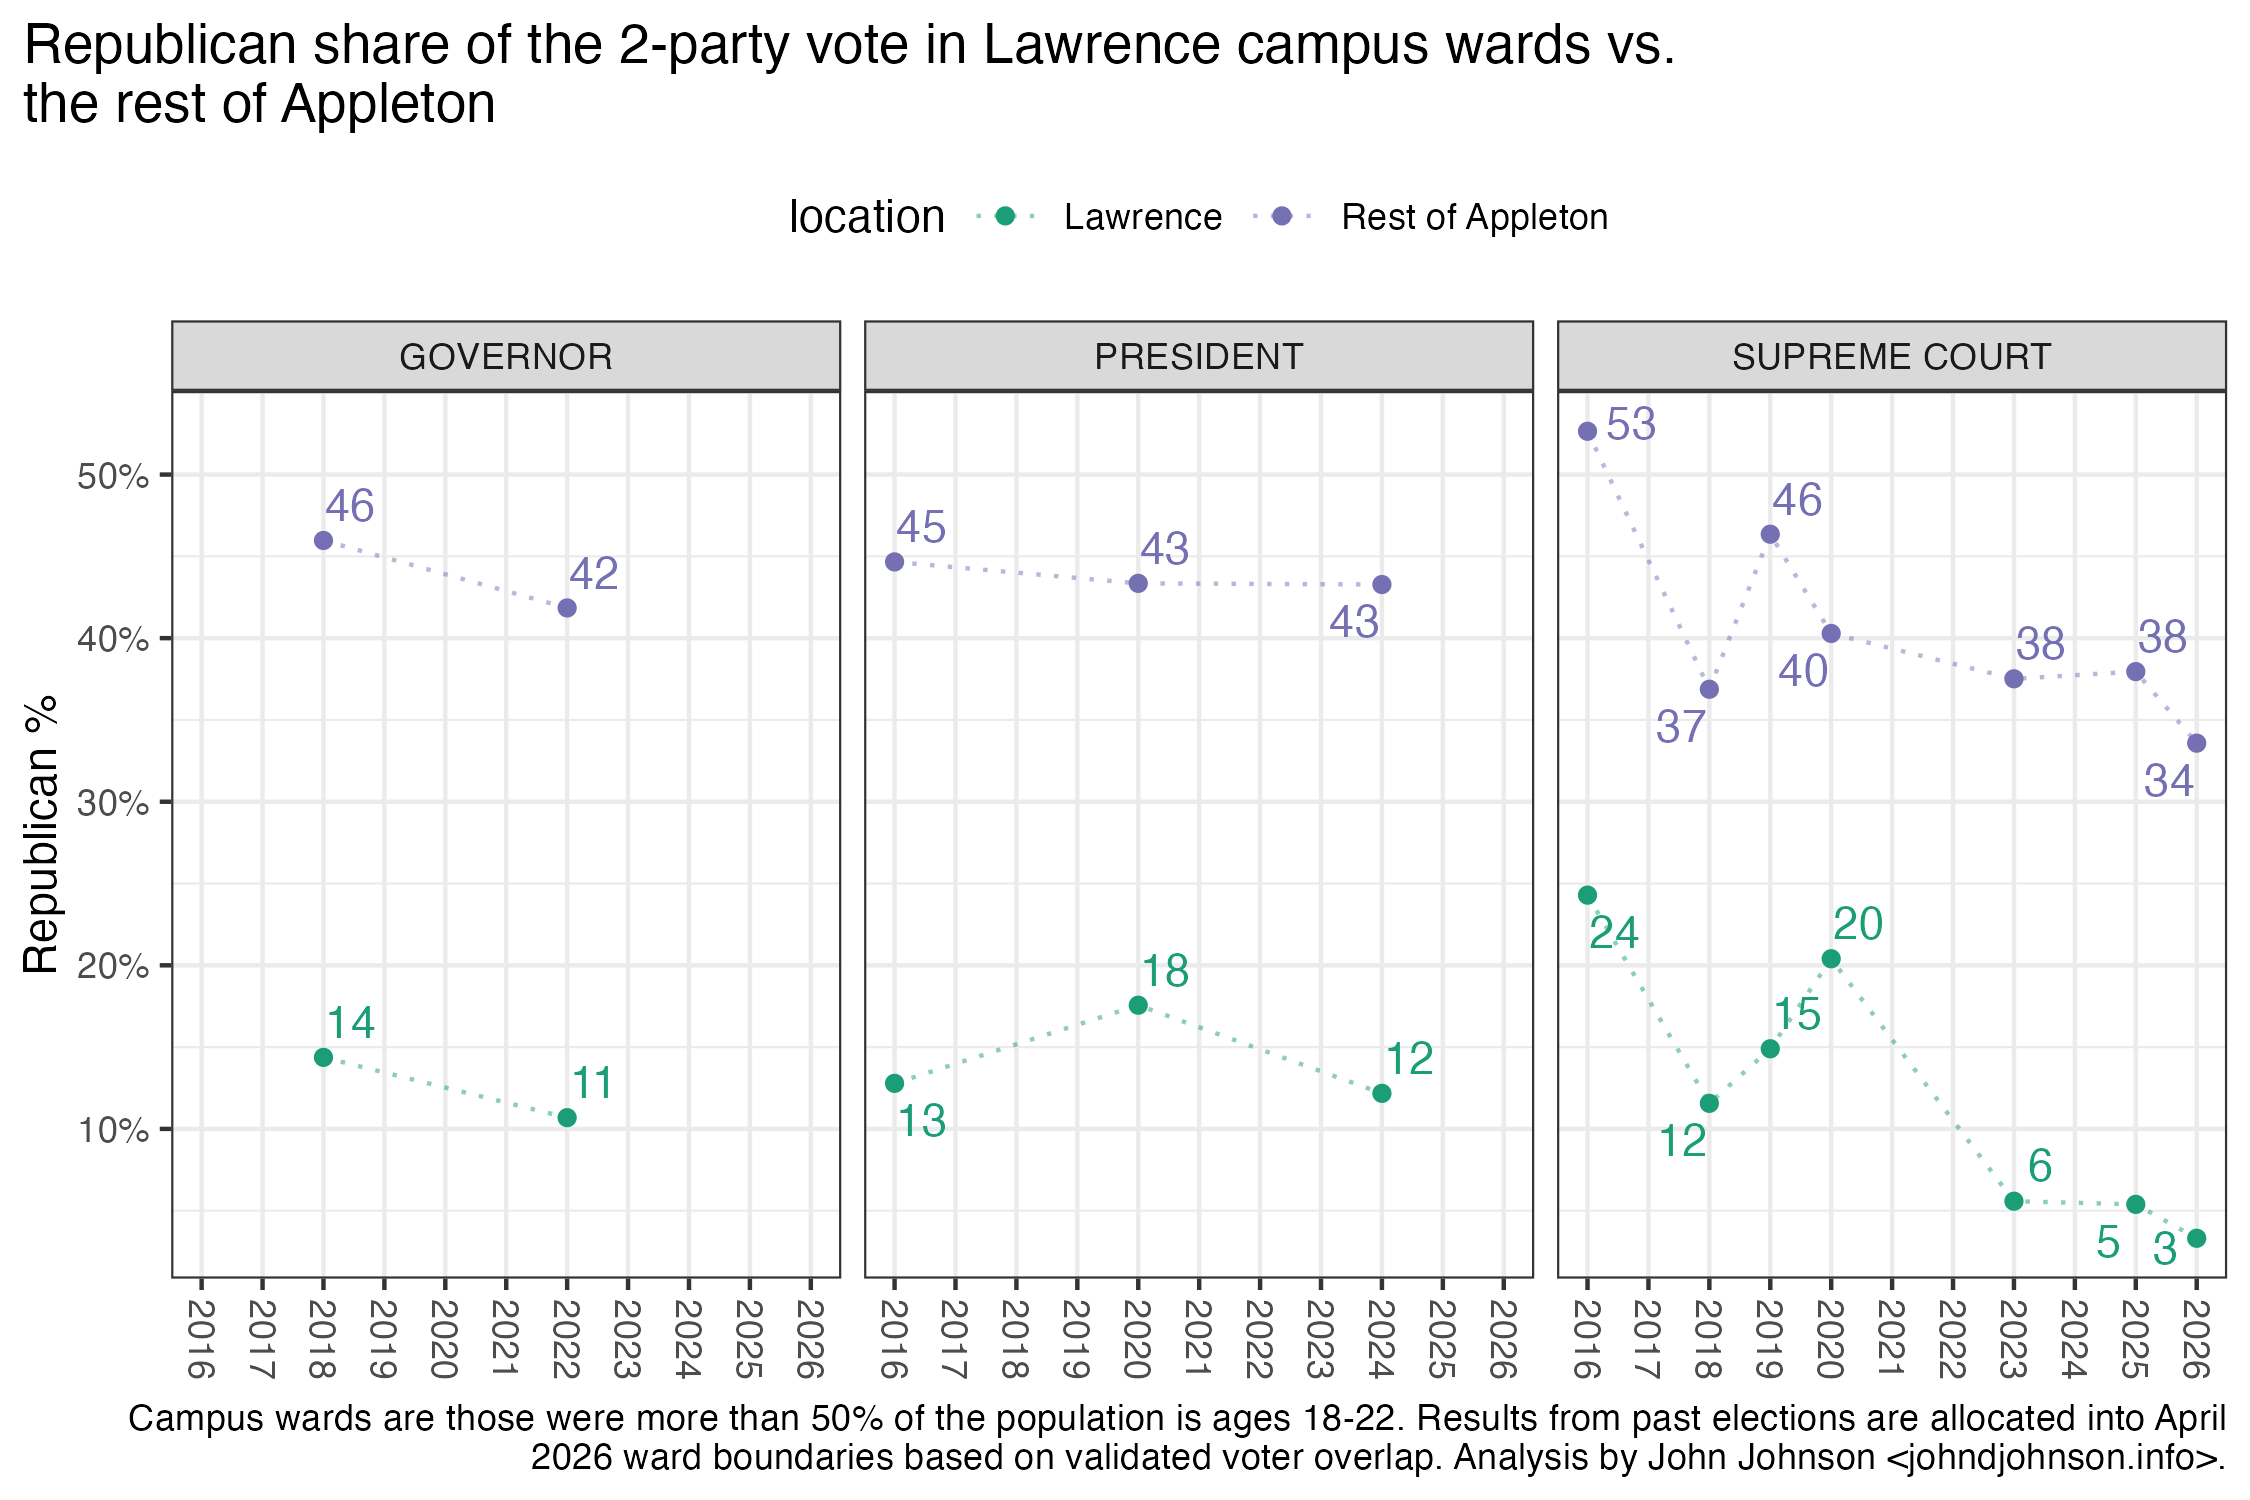
The town-gown divide runs in the opposite direction in Appleton, home to Lawrence University, a private liberal arts school and the state’s most Democratic campus. Here, Republican voters are less than half as common as in the rest of the city.
Milwaukee is home to two campuses with somewhat different political personalities.

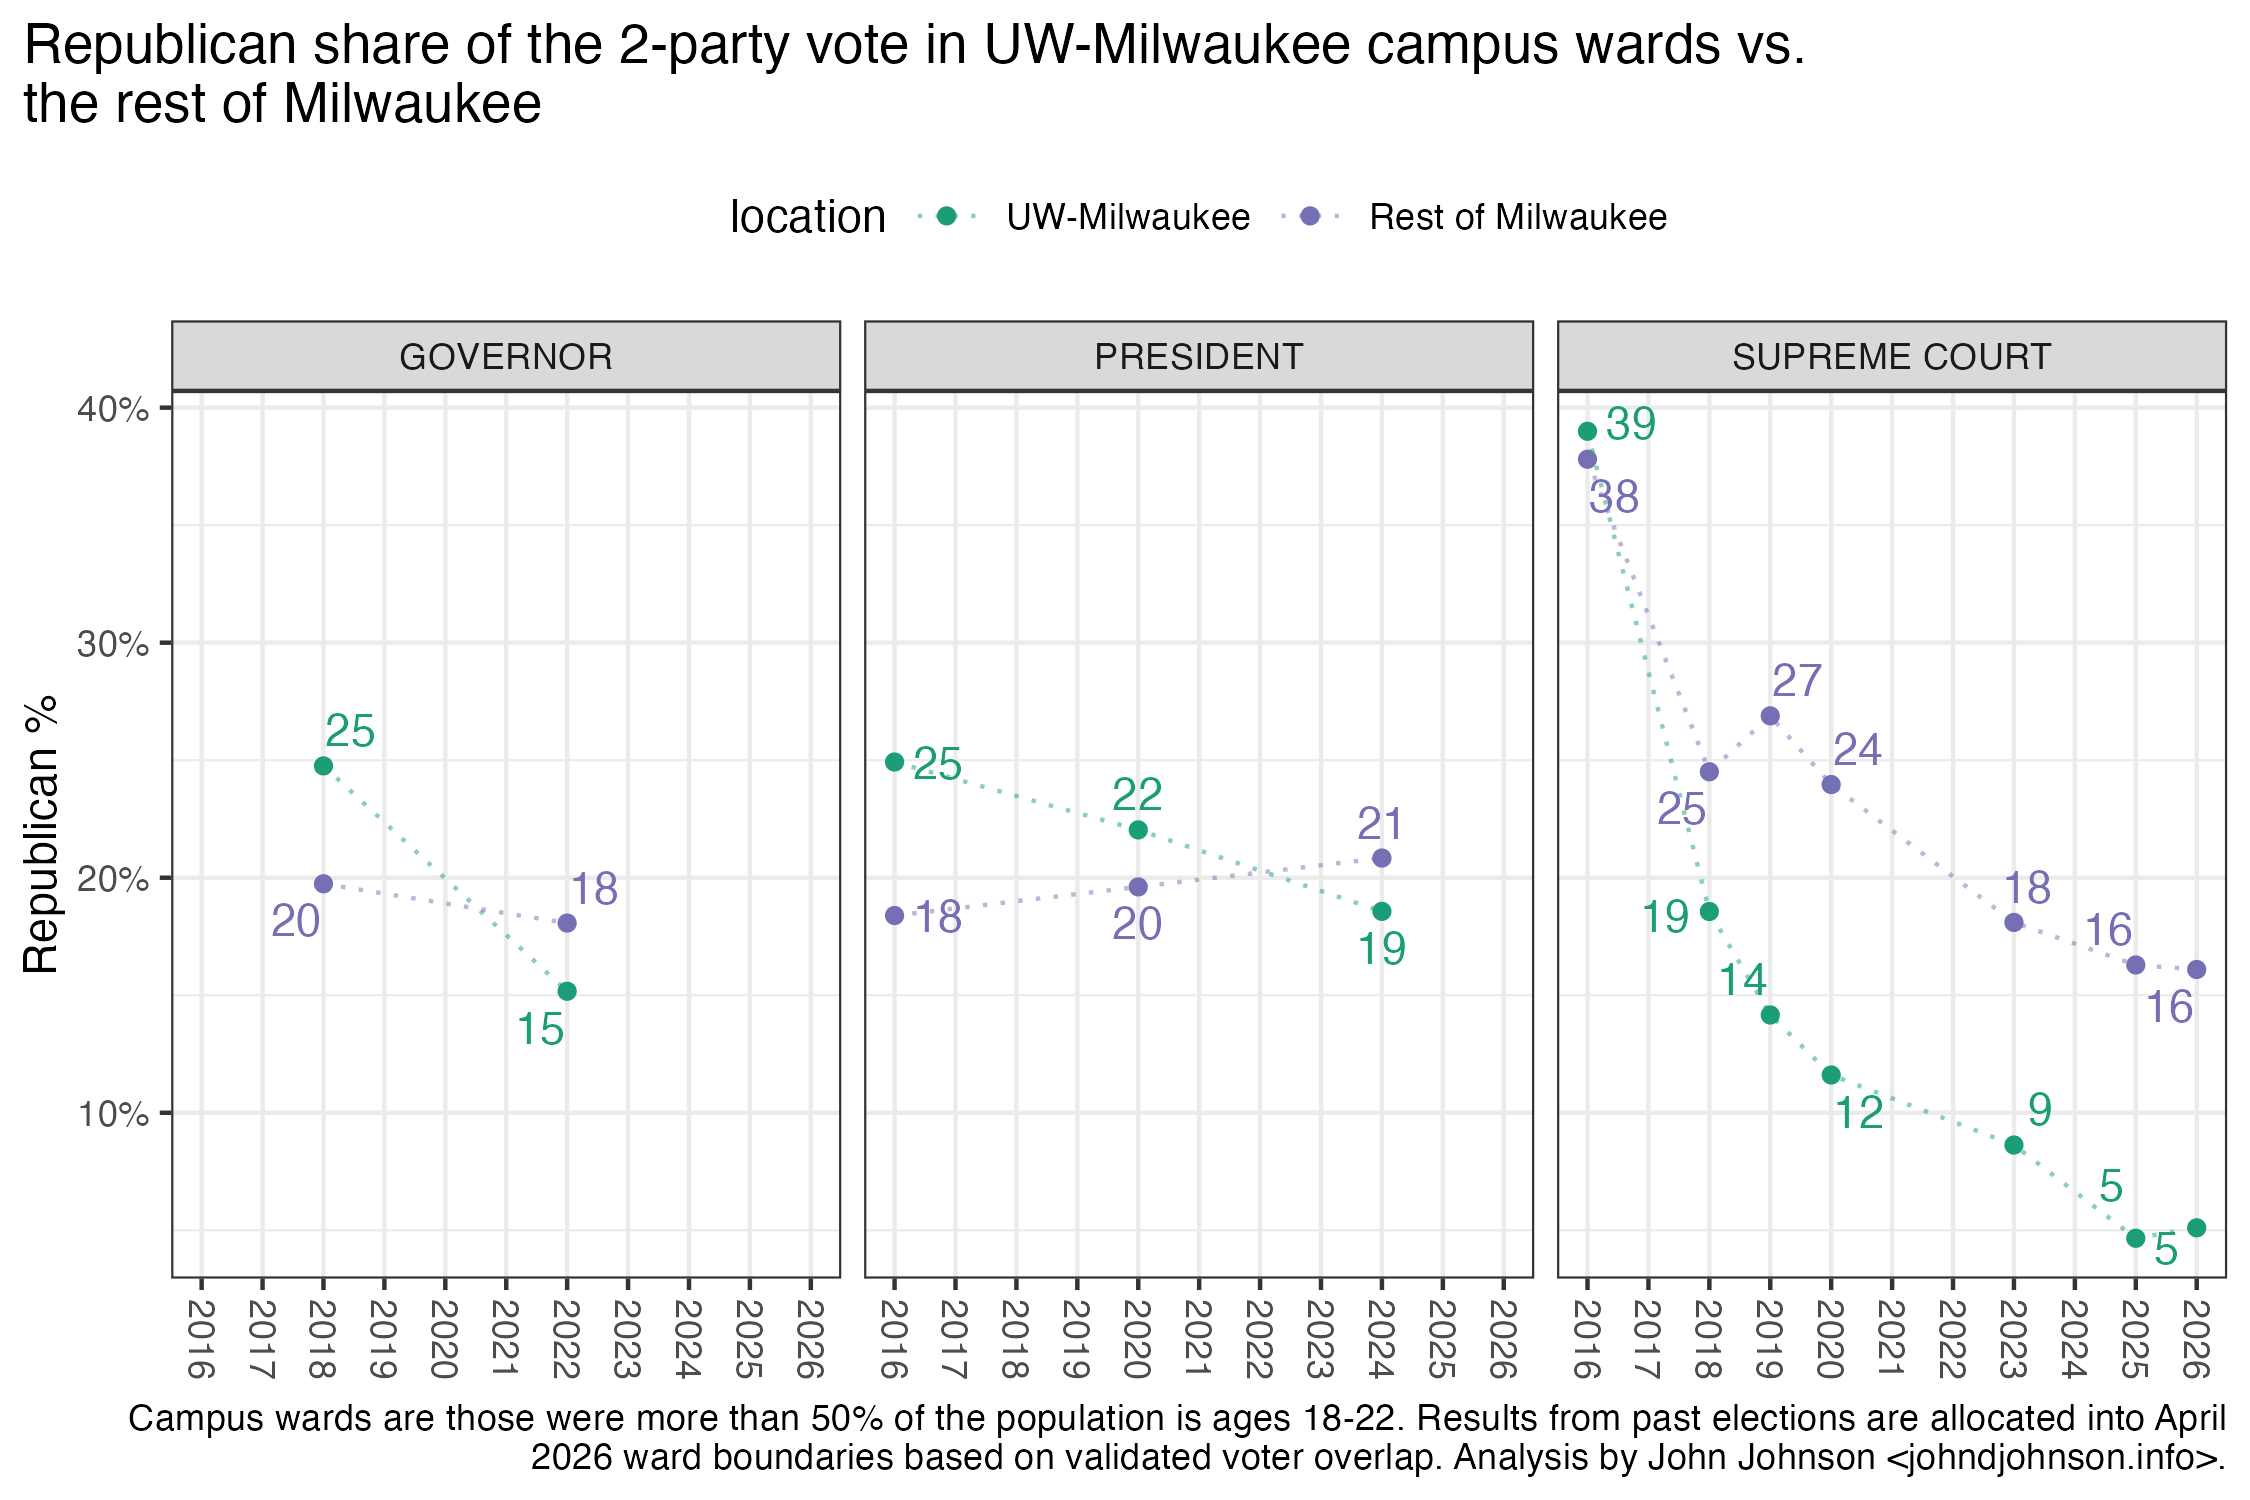
Voters in the UW-Milwaukee campus wards have grown much more Democratic over the past decade, and they are now less Republican than the city as a whole. Trump won 25% in these wards in 2016, dropping to 22% in 2020 and 19% in 2024. Meanwhile, Trump support in the rest of the city grew from 18% to 20% to 21% across his three campaigns.
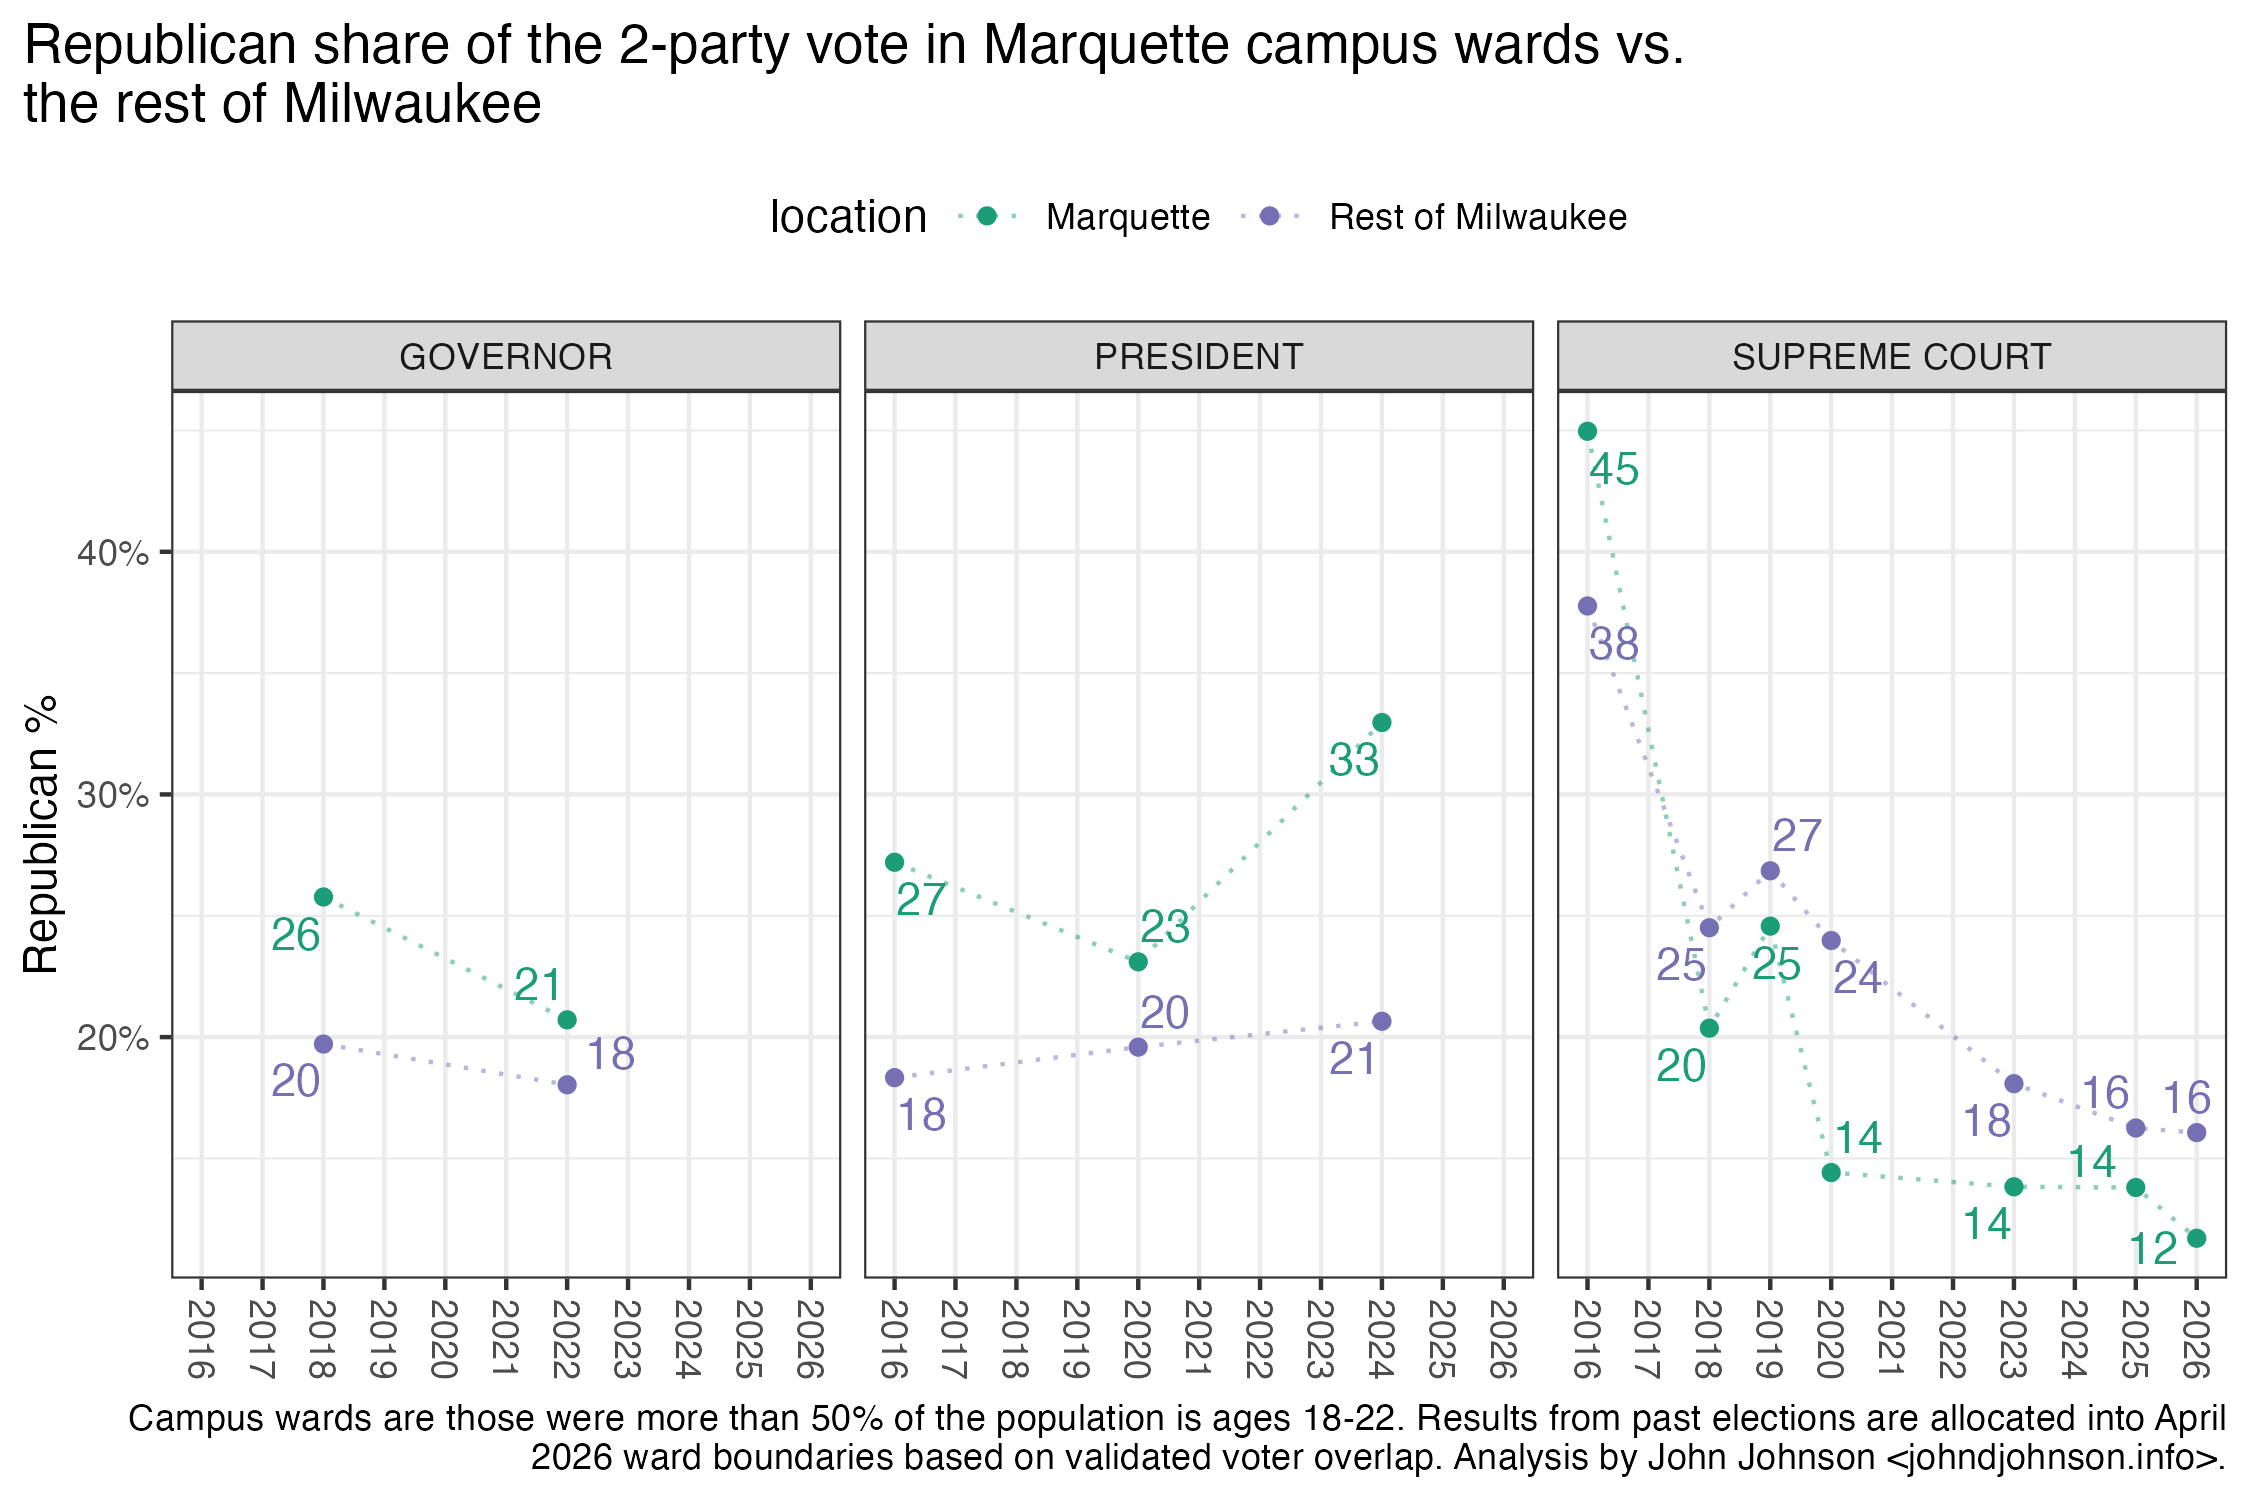
Apart from April elections, voters in the Marquette campus wards have consistently voted more conservatively than voters in the rest of Milwaukee. In 2024, this gap surged. Trump won 27% in the Marquette wards in 2016, 23% in 2020, and 33% in 2024.
Implications for November 2026

The basic dynamic in Wisconsin politics is that, while there are more Republicans than Democrats, Democrats dominate among the most reliable voters and Republicans depend on turning out people who only sometimes show up in November. This latter group apparently includes a large cohort of conservative-leaning but politically unengaged college students. To the extent that the past few elections hold any lessons, they might be this: potential conservative voters exist in meaningful numbers on Wisconsin’s college campuses, but Republicans face an uphill battle turning them out.


[i] The census is officially conducted on April 1. By that date in 2020 many college students had been sent home in response to the COVID-19 pandemic. However, the Census Bureau went to considerable effort to count these students where they would’ve been under normal circumstances.
Continue ReadingA Closer Look at the Campus Vote in Wisconsin

Democrats Benefit From Low Voter Turnout

Wisconsin votes a lot. I mean that in two ways: voter turnout is often high and opportunities to vote arrive frequently. In 2024, the state’s voter turnout was the highest in the nation (76.66% of eligible voters). And statewide elections occur almost every year, often more than once. The total number of voters participating in these contests routinely varies by millions, with inescapable consequences for the parties. With maximum turnout, Republicans enjoy a slight edge, but Democrats have opened a seemingly insurmountable advantage in lower-turnout contests.

For the purposes of this analysis, I’m interested in statewide elections when Democrats, or Democratic-endorsed nonpartisan candidates, ran against Republicans, or their endorsees. This includes November general elections, April elections for State Supreme Court Justice or State Superintendent, and February primaries for those same offices. Unlike in partisan primaries, when Democrats and Republicans vote in separate contests, nonpartisan Wisconsin primaries occur only when at least three candidates are on the ballot, and the top two vote-getters both advance to the April general.

These days, the nonpartisan status of statewide April (and February) elections is just a formality. The parties endorse and fund their preferred candidates, and the voters are well aware of even these unofficial candidate affiliations. The correlation between the vote for Wisconsin Supreme Court Justice and the previous presidential election grew from 0.002 in 1978 to 0.99 by 2025.

Since 2020, there have been 11 statewide elections pitting Democrats against Republicans, counting formally nonpartisan races in which the party affiliation of the candidates was clear.

Those elections ranged in turnout from 3.4 million in the November 2024 presidential election to 326 thousand during the February 2021 primary for State Superintendent.

At the Marquette Law School Poll, we draw most of each sample from the list of registered voters in the state, so for those voters, we can see their actual voting history—not who they voted for but if they voted in each election. I identified everyone we’ve interviewed who remained registered to vote in Wisconsin throughout this entire period, 2020–2026. This includes about 78% of current registered voters in the state and 8,275 respondents to our polls.

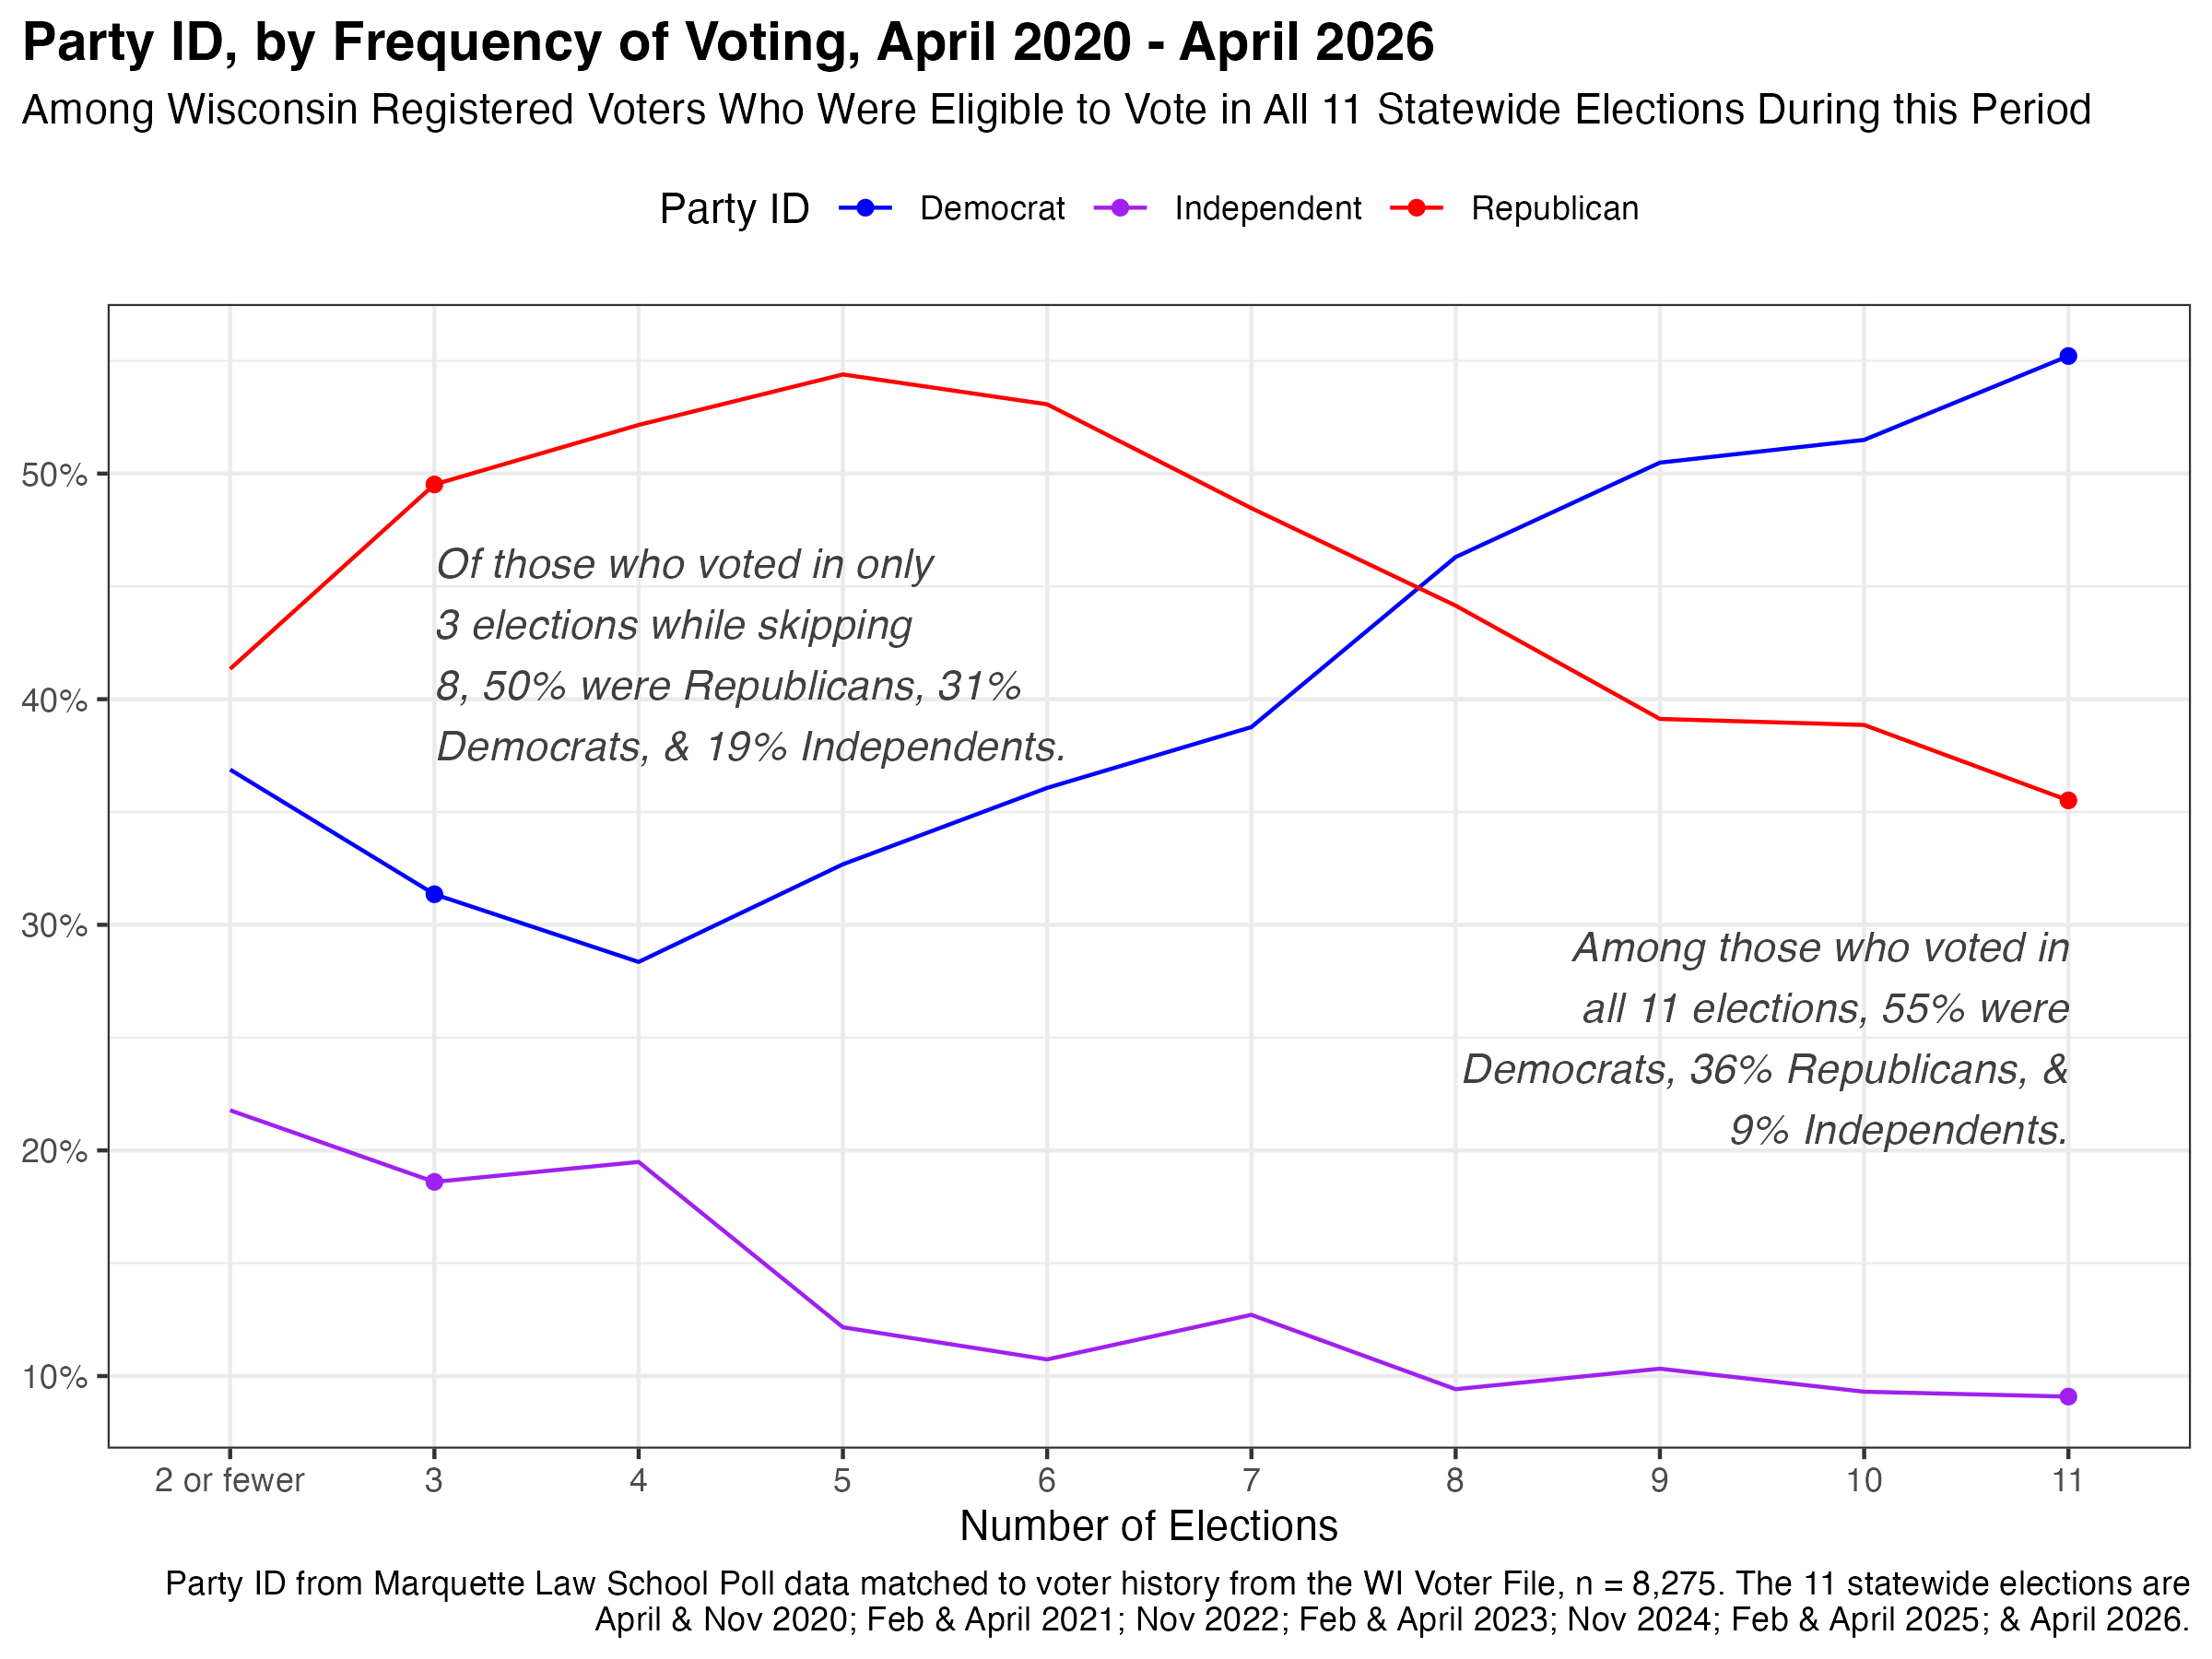
I used those respondents to measure the party split among voters at every level of engagement, shown in the graph below.

Line graph showing party ID by frequency of voting

Republicans enjoy a strong advantage in party ID among those who voted in 7 or fewer of the 11 elections for which they were registered. For instance, about 10% of registered voters voted in only 3 elections, most commonly the three November contests during this period. Among these 3-time voters, our poll finds that 50% identify as Republican, 31% Democratic, and 19% Independent.

Democrats have the advantage with those who voted in 8 or more elections, and the advantage grows steadily with frequency of voting. About 5% of these registered voters had a 100% participation rate; among them, 55% were Democrats, 36% Republicans, and just 9% Independents.

Independents are far less likely to vote frequently. These are “pure” Independents who deny leaning toward either party. Among registered voters who vote the least, more than a fifth are pure Independents. That is more than twice the rate of Independents among high frequency voters.

This means that, as the electorate shrinks, it also becomes more predictable and more ideologically extreme. Among those who voted in two or fewer elections—prototypically, someone who only votes for president, if that—45% describe themselves as moderate, 8% very conservative, and 8% very liberal. Contrast that with the ideology of those who voted all 11 times. Just 20% describe themselves as moderate, 15% very conservative, and 26% very liberal.

In other words, during a high-turnout presidential election, the last voters to be convinced to vote often reject both parties along with the terms “liberal” and “conservative.” A successful politician must appeal to these voters to win in Wisconsin. However, in a low-turnout April election, about 90% of the participants identify with one of the parties and few see themselves as “moderate.” Candidates in these elections play to their respective bases because there is little audience for doing anything else.

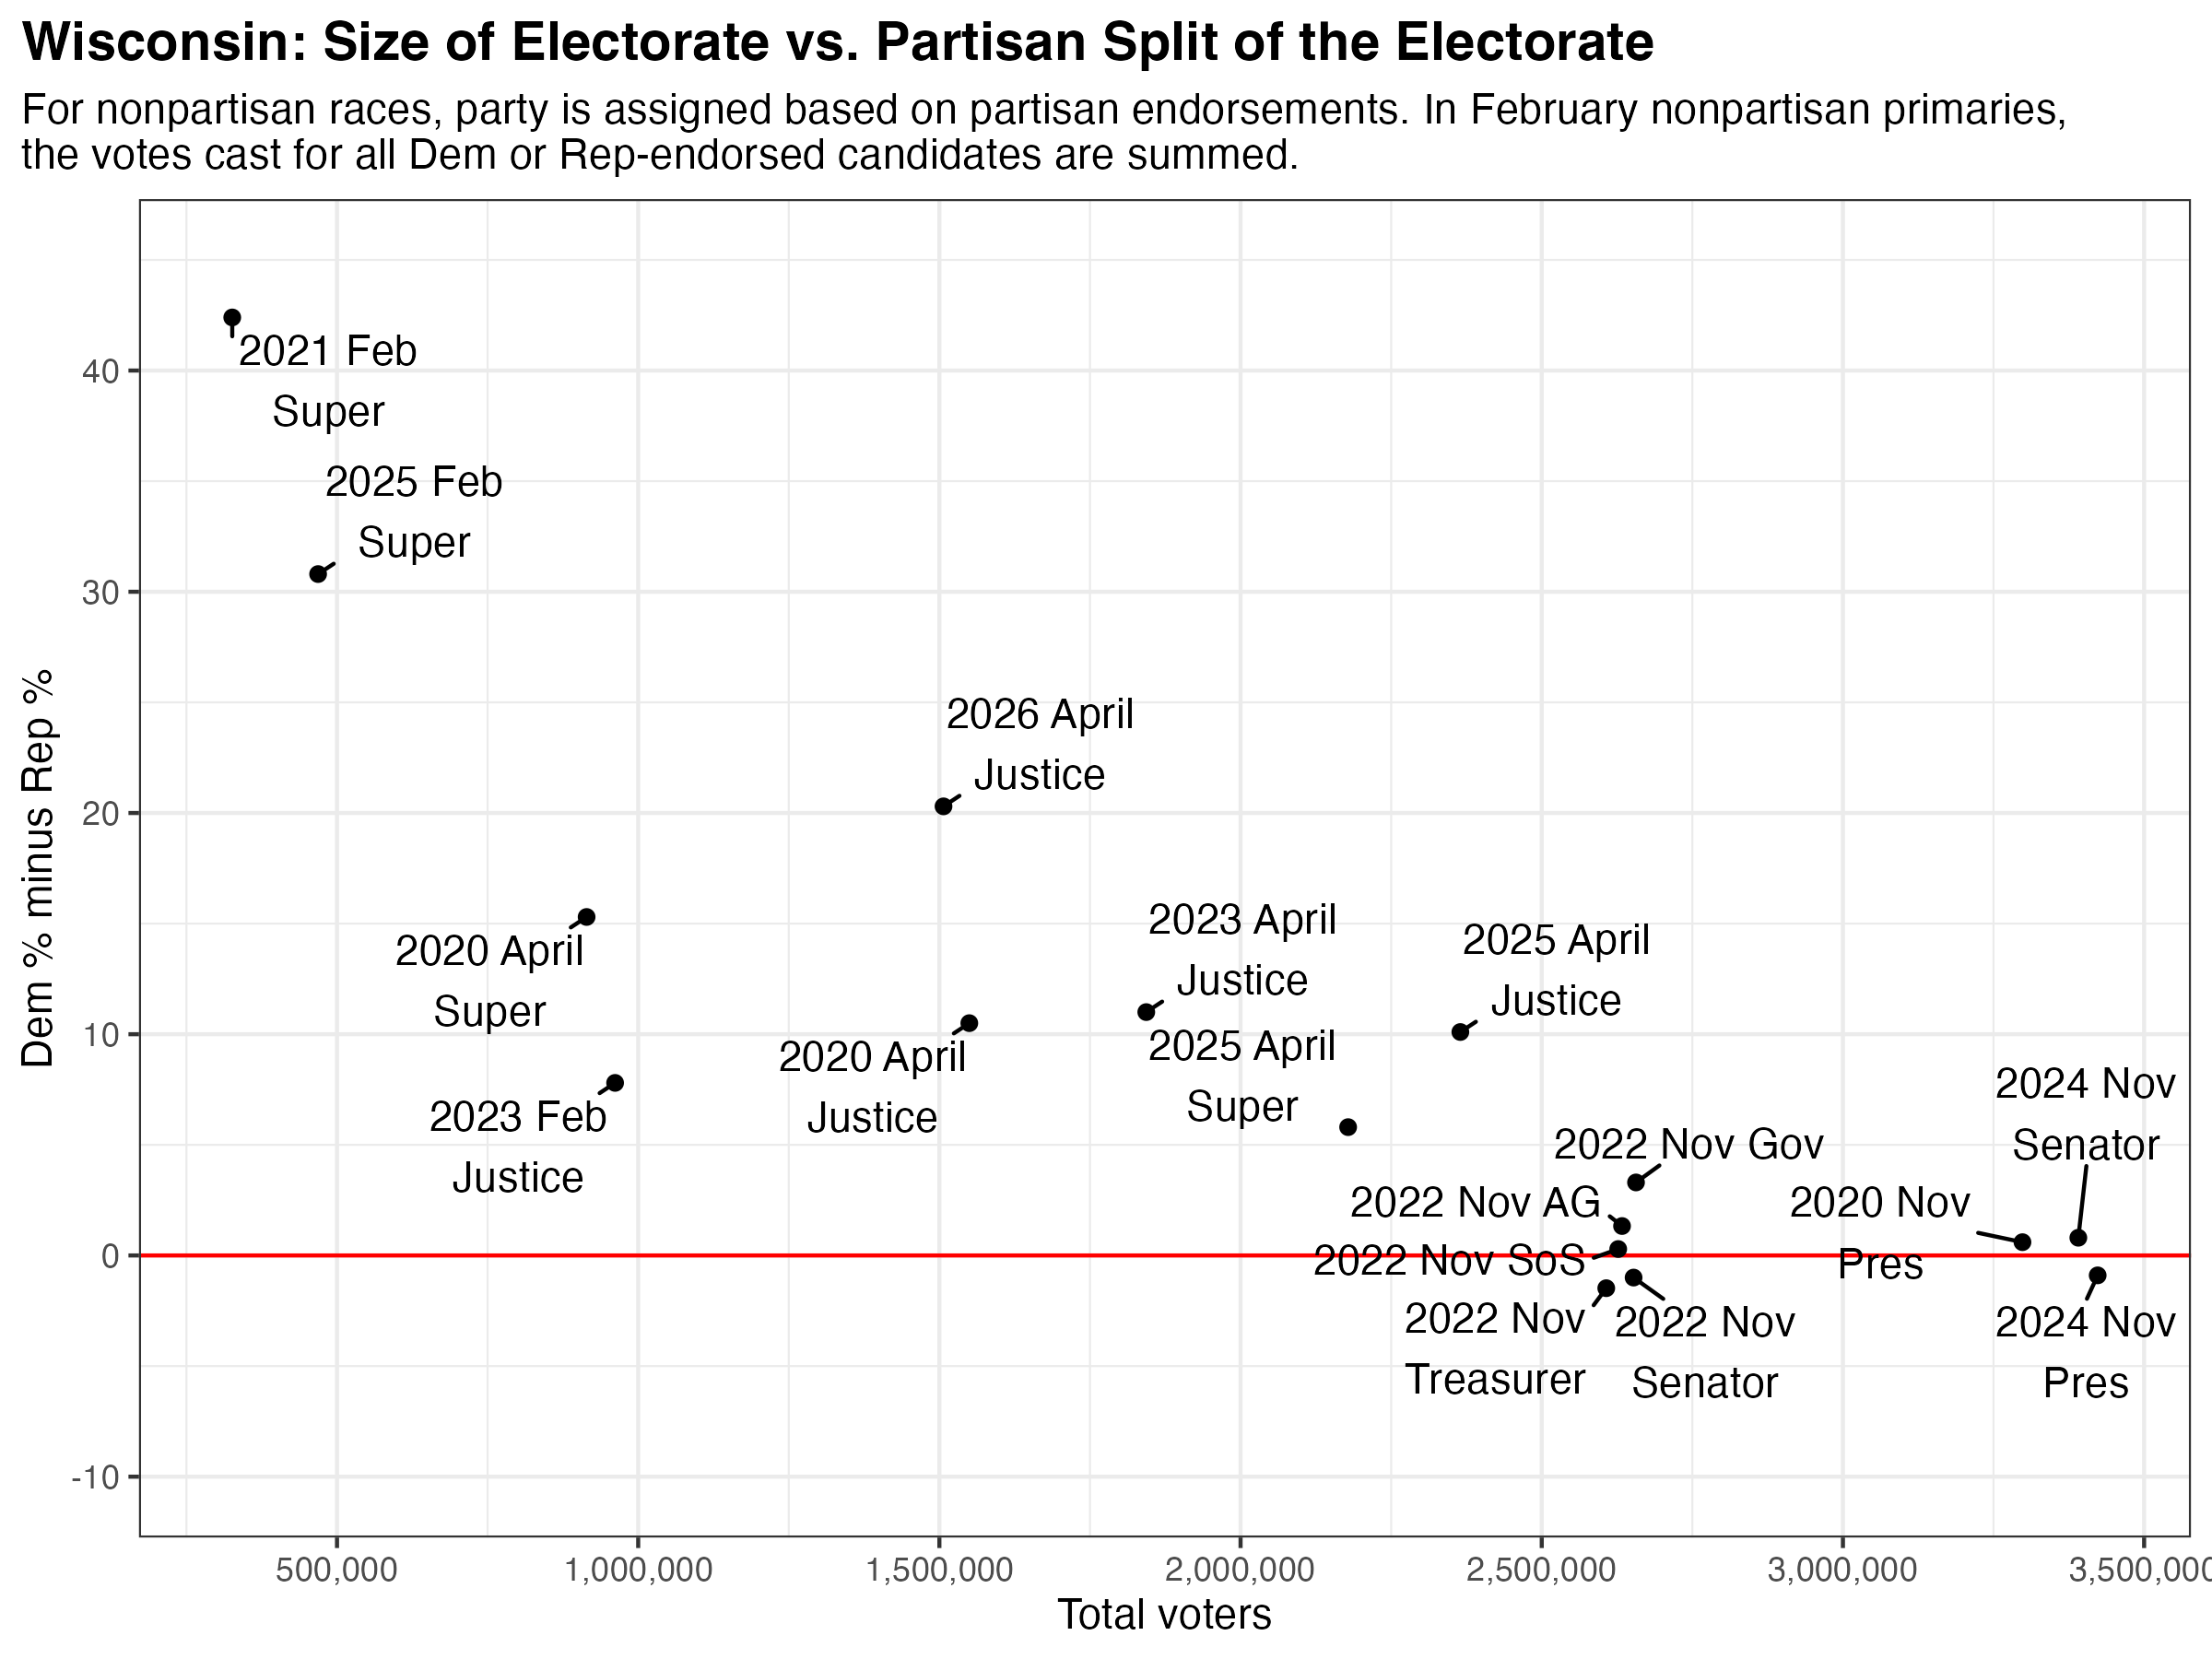
Of course, knowing turnout alone can only tell you so much. The qualities of the candidates, the national environment, and other dynamics of the race play a role. But the importance of turnout to shaping the outcome can’t be denied. There were 17 individual contests in the 11 statewide elections from 2020 through April 2026. Here are the results of each of those, compared with the total number of voters in each.

Scatterplot showing election result margin by size of electorate

Overall, Republican vote share increases with the size of the electorate. It’s no coincidence that Donald Trump’s 2024 victory coincided with record-breaking turnout in the state.

In general, Republicans remain quite competitive whenever turnout is above 2.5 million. They also won the State Treasurer and U.S. Senator races in 2022. However, no Republican or Republican-endorsed candidate has come within 5 points of victory this decade in a race with turnout below 2.5 million.

Things are particularly dire for Republicans in State Superintendent primaries, when voter turnout can fall below half a million. In 2021 and 2025, multiple Democratic-aligned candidates ran, receiving about two-thirds of the vote combined. Although the single Republican-endorsed candidate in those races still managed to advance to the general election, it’s conceivable that a future February primary could result in two Democratic-aligned State Superintendent candidates advancing to the general.

Given the way that low turnout now works to the benefit of Democrats while Republicans need high turnout to win, it may appear surprising that Democrats remain the party promoting voting access while Republicans pursue efforts that would shrink the electorate. It can seem as if each party is accidentally working to make things better for the other. A few long-standing political beliefs contribute. Many Democrats believe that higher turnout is normatively good, and the Obama-era mindset that “When everyone votes, we win” is still common. Likewise, I suspect many Republicans still believe, despite evidence to the contrary, that the marginal voter is more likely to vote for a Democrat than a Republican.

Continue ReadingDemocrats Benefit From Low Voter Turnout

Young Registered Voters are Far More Likely to Lack Age Data in L2’s Wisconsin Voter File

G. Elliot Morris argues that the polls in Wisconsin underestimated David Crowley’s support in the 2026 Democratic primary because they included too many young voters (who mostly supported Francesca Hong) and too few older voters (who mostly supported Crowley). Using the L2 voter file, he estimates that just 2-3% of a typical partisan primary’s electorate is composed of voters under 30. This analysis is incorrect because the L2 voter file is missing age data for nearly all of the youngest voters, while it includes age data for almost every older voter. Consequently, any estimate of voter participation relying on unaltered L2 age data vastly understates voting participation among young people, specifically.

Morris writes:

I pulled two different pictures of the Wisconsin electorate from the L2 voter file. One universe consisted of of Democrats and nonpartisans who have voted in at least 11% of the even-year primaries they were eligible for. The other was built by taking the L2 list of active voters who cast a ballot in at least one Democratic primary since 2016. The two universes agree with each other almost exactly, which should give us some confidence in the targets being used. Among voters with a known age, both say the primary electorate is about 52-53% seniors and 2-3% under 30.

“Among voters with a known age…” is the key bit. Morris’ analysis would be correct if the missing age data was evenly distributed throughout the population. However, in Wisconsin, it is overwhelmingly concentrated among the young.

The reason for this is simple. Even though Wisconsin collects each voter’s birthday when he or she registers to vote, the state Elections Commission does not sell this information. Wisconsin’s actual public voter file–the one sold by the state–includes scarcely any information about each voter. Here is the list of data elements. Besides election participation records, it includes each voter’s name, address, and contact information. It does not include the voter’s age.

Instead, date of birth is one of the many voter attributes L2 acquires from commercial sources and adds to the Wisconsin voter file before selling it. The older a voter is (and the longer they’ve been registered), the more opportunities L2 has to determine that voter’s birthday. Mechanically, the coverage of the age variable increases with the age of the registrants.

Although the Wisconsin Elections Commission does not sell access to each registrant’s birth date, the WEC does publish a monthly file summarizing the registered voter population by five age ranges. Using that file, we can compare the number of actual registered voters in each age range with the number in L2’s most recent Wisconsin file.

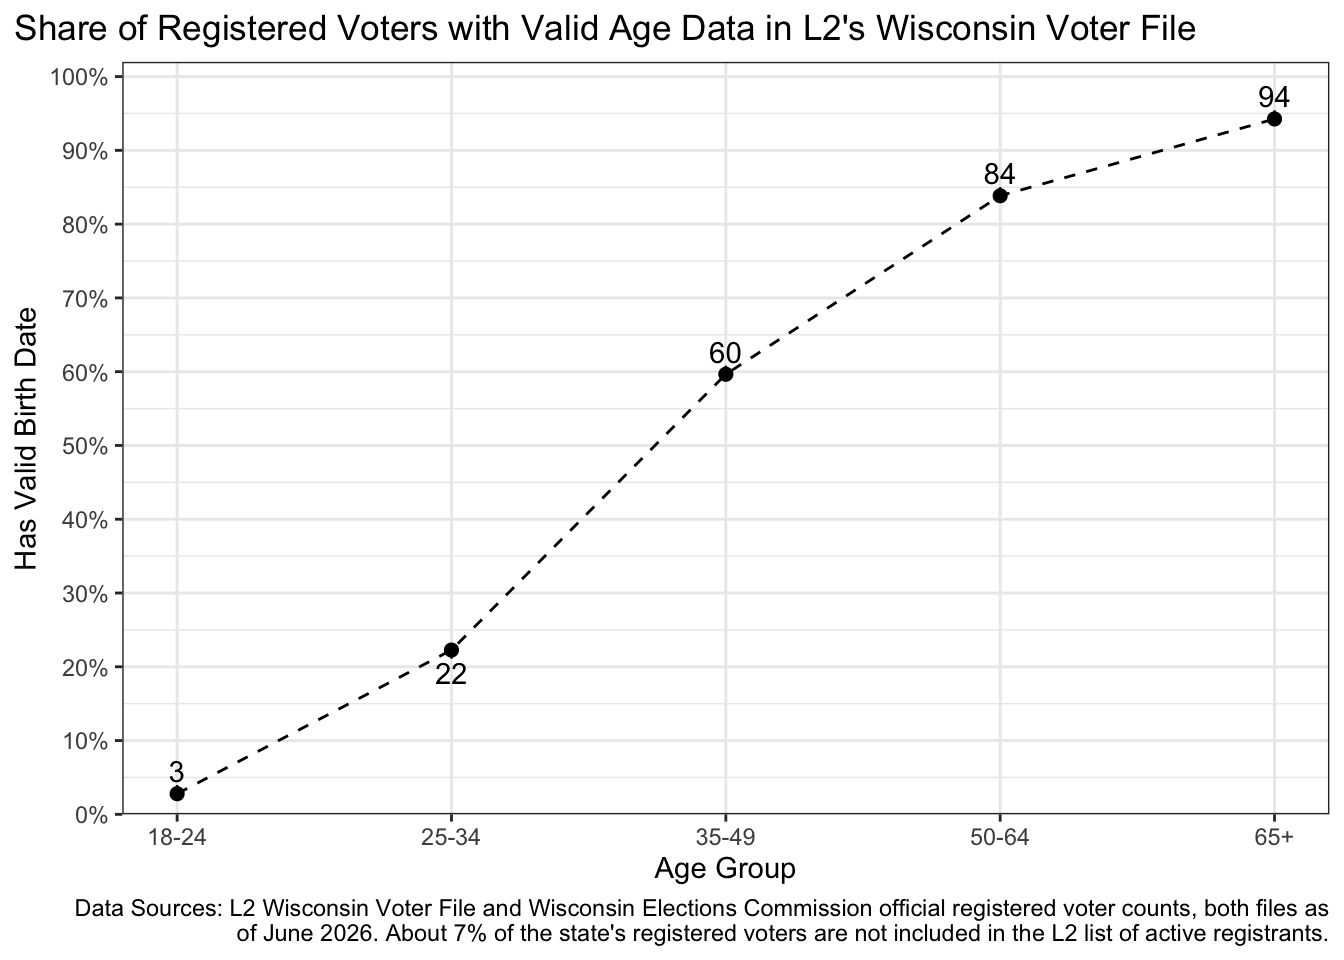
The L2 file only contains birth dates, and thus ages, for 3% of registrants under the age of 25. This grows to 22% among those ages 25-34, and rises steadily thereafter, reaching 94% among voters 65 and up.1

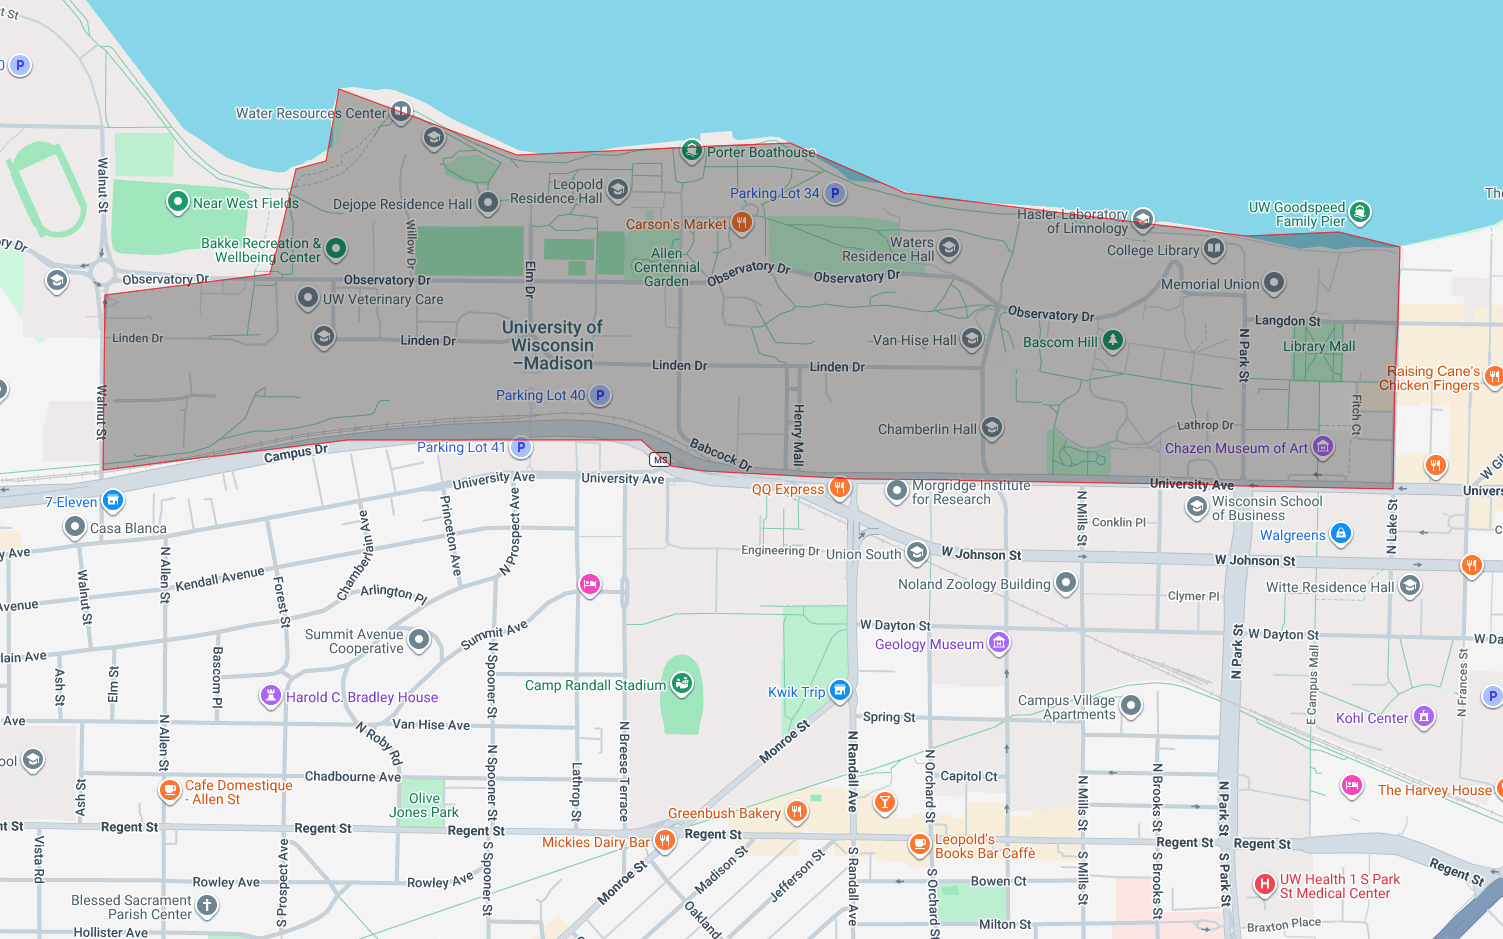
Excluding voters with missing ages means ignoring the youngest areas of the state. To illustrate: tract #001102 is roughly coeterminous with UW Madison’s campus. Here, the median age is 19 and 99.4% of registration records lack a birth date.

UW Madison: 99.4% of registered voters in this tract lack an age record in L2’s data

When Morris uses the L2 file to calculate that the typical primary electorate is 2-3% voters under 30, this just reflects the large amount of missing data among young registrants. Among voters with a valid age in the L2 file, just 5% are under the age of 35. Actually, 22.5% of registered voters are this young, according to the official statistics from the WEC.

Comparison of Wisconsin Registered Voter Records by Age Group
both data sources as of June 2026
Official WECL2 Voter File
CountPct.CountPct.Valid Pct.
18-24316,7658.8%8,8540.3%0.4%
25-34492,52513.7%109,6713.3%4.6%
35-49819,51722.7%488,85314.7%20.5%
50-64869,38024.1%728,94721.9%30.6%
65+1,107,12530.7%1,043,54431.3%43.8%
Missing——955,88428.7%—

A better way to measure voter participation

So far, I’ve only been examining voter registration, not election participation, because the WEC does not publish official statistics breaking down each electorate by age. Fortunately, there is another reliable source we can use to measure young people as a share of the electorate.

After every November election, the Census Bureau fields the November Voting and Registration Supplement to its regular Current Population Survey (CPS). This survey is routinely used by pollsters to develop target weights, and it quite closely matches the official statistics published by the WEC.

To demonstrate, the table below shows statistics from the 2024 presidential election in Wisconsin. I compare the actual age breakdown of registered voters from WEC with the results of the CPS November Supplement and registered voter age counts from the L2 file.

Following the 2024 presidential election, 10.2% of Wisconsin’s registered voters were between the ages of 18 and 24. But because L2 had been unable to match birthdays for these relatively new registrants, the file showed that only 0.6% of all registered voters (and 0.8% of those with a valid age) were under the age of 25. In raw numbers, there were 18 times more registrants under 25 in reality than in the L2 file.

The L2 file also lacked birth dates for many registrants ages 25-34. In L2’s data, these comprised 5.8% of registered voters with valid age records, but in reality they made up 14.8%. Meanwhile, the L2 file includes a birth date for almost every older registrant, so when calculated as a proportion of voters with a valid age (as Morris did) they appear grossly overrepresented.

By contrast, the Current Population Survey appears quite accurate. It estimated that adults under 25 made up 9.3% of registered voters in November 2024 compared with the WEC count of 10.2%.

Wisconsin: Measures of Late 2024 Voter Registration by Age
Official WEC Count1L2 Voter File2Current Pop. Survey3
CountPct.CountPct.Valid pct.CountPct.
18-24395,02710.2%21,8470.6%0.8%390,7589.3%
25-34576,16214.8%152,0754.1%5.8%670,96716.0%
35-49879,18022.6%566,83515.3%21.6%1,024,72124.5%
50-64945,70424.4%814,64422.0%31.0%1,039,14124.8%
65+1,087,41328.0%1,074,58929.0%40.9%1,060,89325.3%
Missing——1,071,50528.9%———
1 Data from the Wisconsin Elections Commission as of December 1, 2024.
2 Data from the Wisconsin L2 file downloaded in early 2025.
3 Data from the November 2024 Voter Supplement, retrieved from IPUMS CPS.

Having verified that the CPS November Supplement accurately captures the age breakdown of Wisconsin’s registered voters, I will now use it to calculate voter participation by age. These statistics are self-reported and subject to normal sampling error, but I tend to trust them, given how closely their age breakdown matches the real WEC stats.

In this table, I adopt the 18-29 year-old age category used by Morris instead of the age bins used by the WEC.

Eighteen-to-twenty-nine-year-olds made up 20% of the adult population in 2024. They accounted for 14% of voters in the November election, according to the CPS. But in the L2 data, voters under 30 were only 3% of voters with a known age. The reason for this is obvious. The L2 file following the 2024 election lacked age data for 938,000 voters, and this included the vast majority of the youngest voters in the state, for whom L2 had so far been unable to add a birth date.

Wisconsin: Measures of Nov. 2024 Voter Participation by Age
Number/share of voters according to the…
Total Population1Current Pop. Survey2L2 Voter File3
popPct.CountPct.CountPct.Valid pct.
18-29921,52120%435,37314%68,3272%3%
30-39759,13116%496,47616%209,7026%9%
40-49714,65715%506,56316%396,19112%16%
50-59706,83415%637,57220%464,98514%19%
60-69800,59917%495,95115%610,67918%25%
70-79545,13012%439,12214%474,92614%19%
80+272,5366%190,0286%231,8387%9%
Missing————937,81928%—
1 Data from the Population Estimates Program July 1, 2024 single-year-of-age dataset.
2 Data from the November 2024 Voter Supplement, retrieved from IPUMS CPS.
3 Data from the Wisconsin L2 file downloaded in early 2025.

Crowley’s performance

David Crowley remained out of the governor’s race until July 18th. On July 17th, his support was presumably virtually 0%.2 By election day on August 11th, his support had reached 40% to Hong’s 39%. The last Marquette Law School Poll was fielded July 22-27. At that time, we found his support was 7% to Hong’s 38%. Plausibly, the Marquette poll underestimated Crowley’s support a week after he reentered the race, but I judge it at least equally plausible that most of Crowley’s gains came in the final two weeks of the campaign.

Whatever the case, a far less likely explanation of Crowley’s success is that the August primary electorate included only 2-3% voters under age 30. That conclusion relies on misunderstanding Wisconsin’s voter file. The version of the file sold by the state does not include age information for any registrant, and the most common commercially available form of the file only reliably adds birth dates for older voters.

Footnotes

  1. As of this writing, the most recent L2 file includes state data from June 6, 2026. Comparing that file to contemporaneous data from the WEC shows that about 7% of the state’s registered voters are not included in the L2 list of active registrants at all. These could be individuals who are redacted from the purchaseable voter file due to safety concerns.↩︎
  2. It’s true that candidates who’ve dropped out of a race but remain on the ballot receive some of the vote. But most of this can be attributed to early voters casting ballots before a candidate withdraws. In the City of Milwaukee, where I know the composition of election day vs. early voters, Mandela Barnes (who dropped out on July 30th) received 10.4% among early voters but just 0.9% of election day ballots.↩︎
Continue ReadingYoung Registered Voters are Far More Likely to Lack Age Data in L2’s Wisconsin Voter File