Yesterday, Democrats ran the table in Wisconsin. They won every statewide race–Governor (+8), Attorney General (+9), Secretary of State (+5), and Treasurer (+4). They flipped both competitive Congressional seats. Rebecca Cooke took down incumbent Derrick Van Orden by a 7-point margin. Mitchell Berman defeated Bryan Steil by 4 points.
I was especially interested in the state legislative races where, for the first time in 16 years, control of both chambers was truly up for grabs. Back in July, I gave myself the task of rating the battleground districts in each chamber. I came up with 14 districts–5 in the senate and 9 in the assembly–which I thought would determine the outcome. Democrats won 13 of them.
In the State Senate, the 17 odd-numbered districts held elections. Democrats needed to flip 2 of them for a majority. They flipped 3–two in the Milwaukee suburbs and one in the Driftless Area. They will have 18 seats to Republicans’ 15 in the next session.
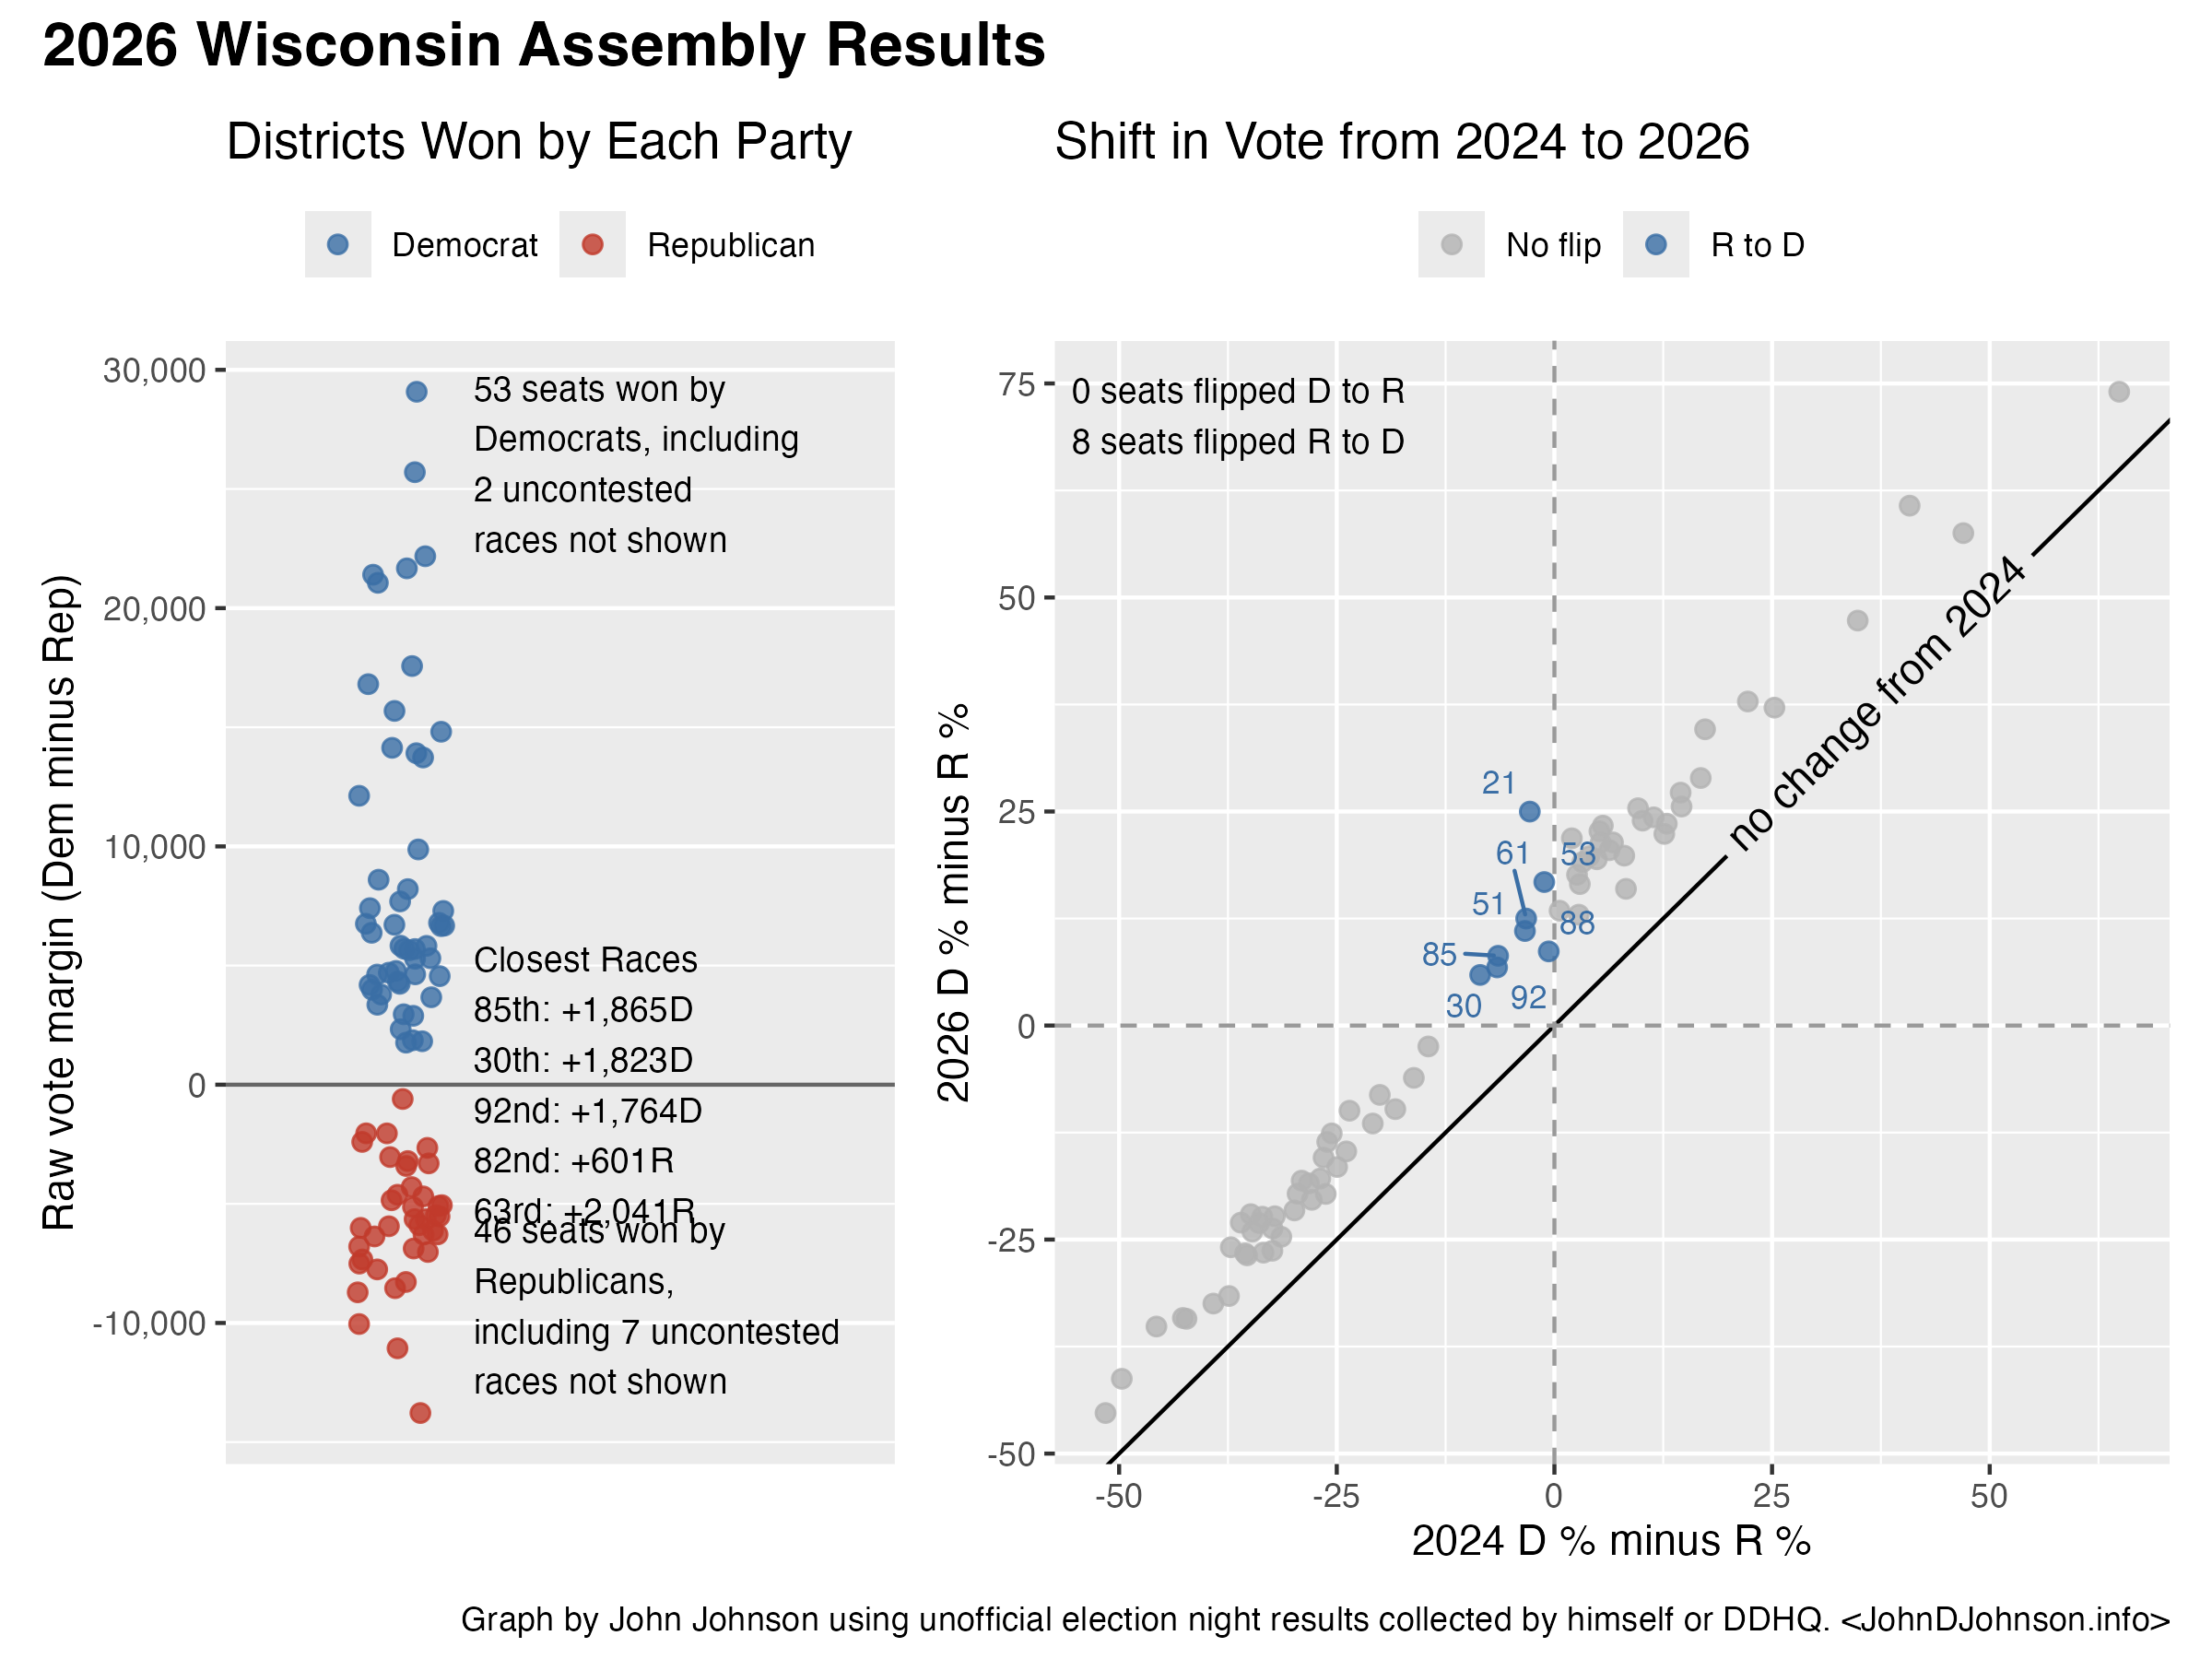
In the State Assembly, Democrats needed 5 flips to win the chamber. Instead, they flipped 8 seats, for a total of 53. The locations of these districts indicate the great reach of this blue wave. Two are in the Milwaukee suburbs, two in the Fox Valley, one in the rural Driftless Are, and three are in the tier of small cities running across the northern half of the state.
It was these last three races that surprised me the most. All of the other seats Democrats flipped were actually places where Kamala Harris won the vote en route to losing the state in 2024. But the three northern districts were Trump seats featuring Republican incumbents. It didn’t end up mattering. In River Falls, along the border with Minnesota, Kevin Knoke defeated Shannon Zimmerman by 7 points, this in a seat that Zimmerman won by 8.5 points two years ago. In Menomonie, near Eau Claire, Jeremiah Frederickson defeated Clint Moses by 7 points, after Moses won in 2024 by 7 points. And in Wausau, John Kroll defeated the incumbent Republican Patrick Snyder by 8 points. Snyder had won the seat by 6 points in 2024.
This was a uniform swing election. Every contested assembly seat saw Democrats improve their margin relative to 2024. The biggest swing came in the 21st district in the Milwaukee County suburbs. Here the Democrat, Oak Creek mayor Daniel Bukiewicz won the seat left open by longtime Republican incumbent Jessie Rodriguez’s retirement by 25 points.
Assembly Democrats Relative to Crowley
Thanks to the 2024 redistricting, the state’s legislative districts closely match the political division of the state itself. The 2024 election returned a split result in Wisconsin, as the state voted for Donald Trump and simultaneously reelected incumbent Democratic Senator Tammy Baldwin. The state’s new assembly districts captured this split, with each candidate converting their respective narrow statewide victories into a majority of the vote in 50 of the state’s 99 districts.
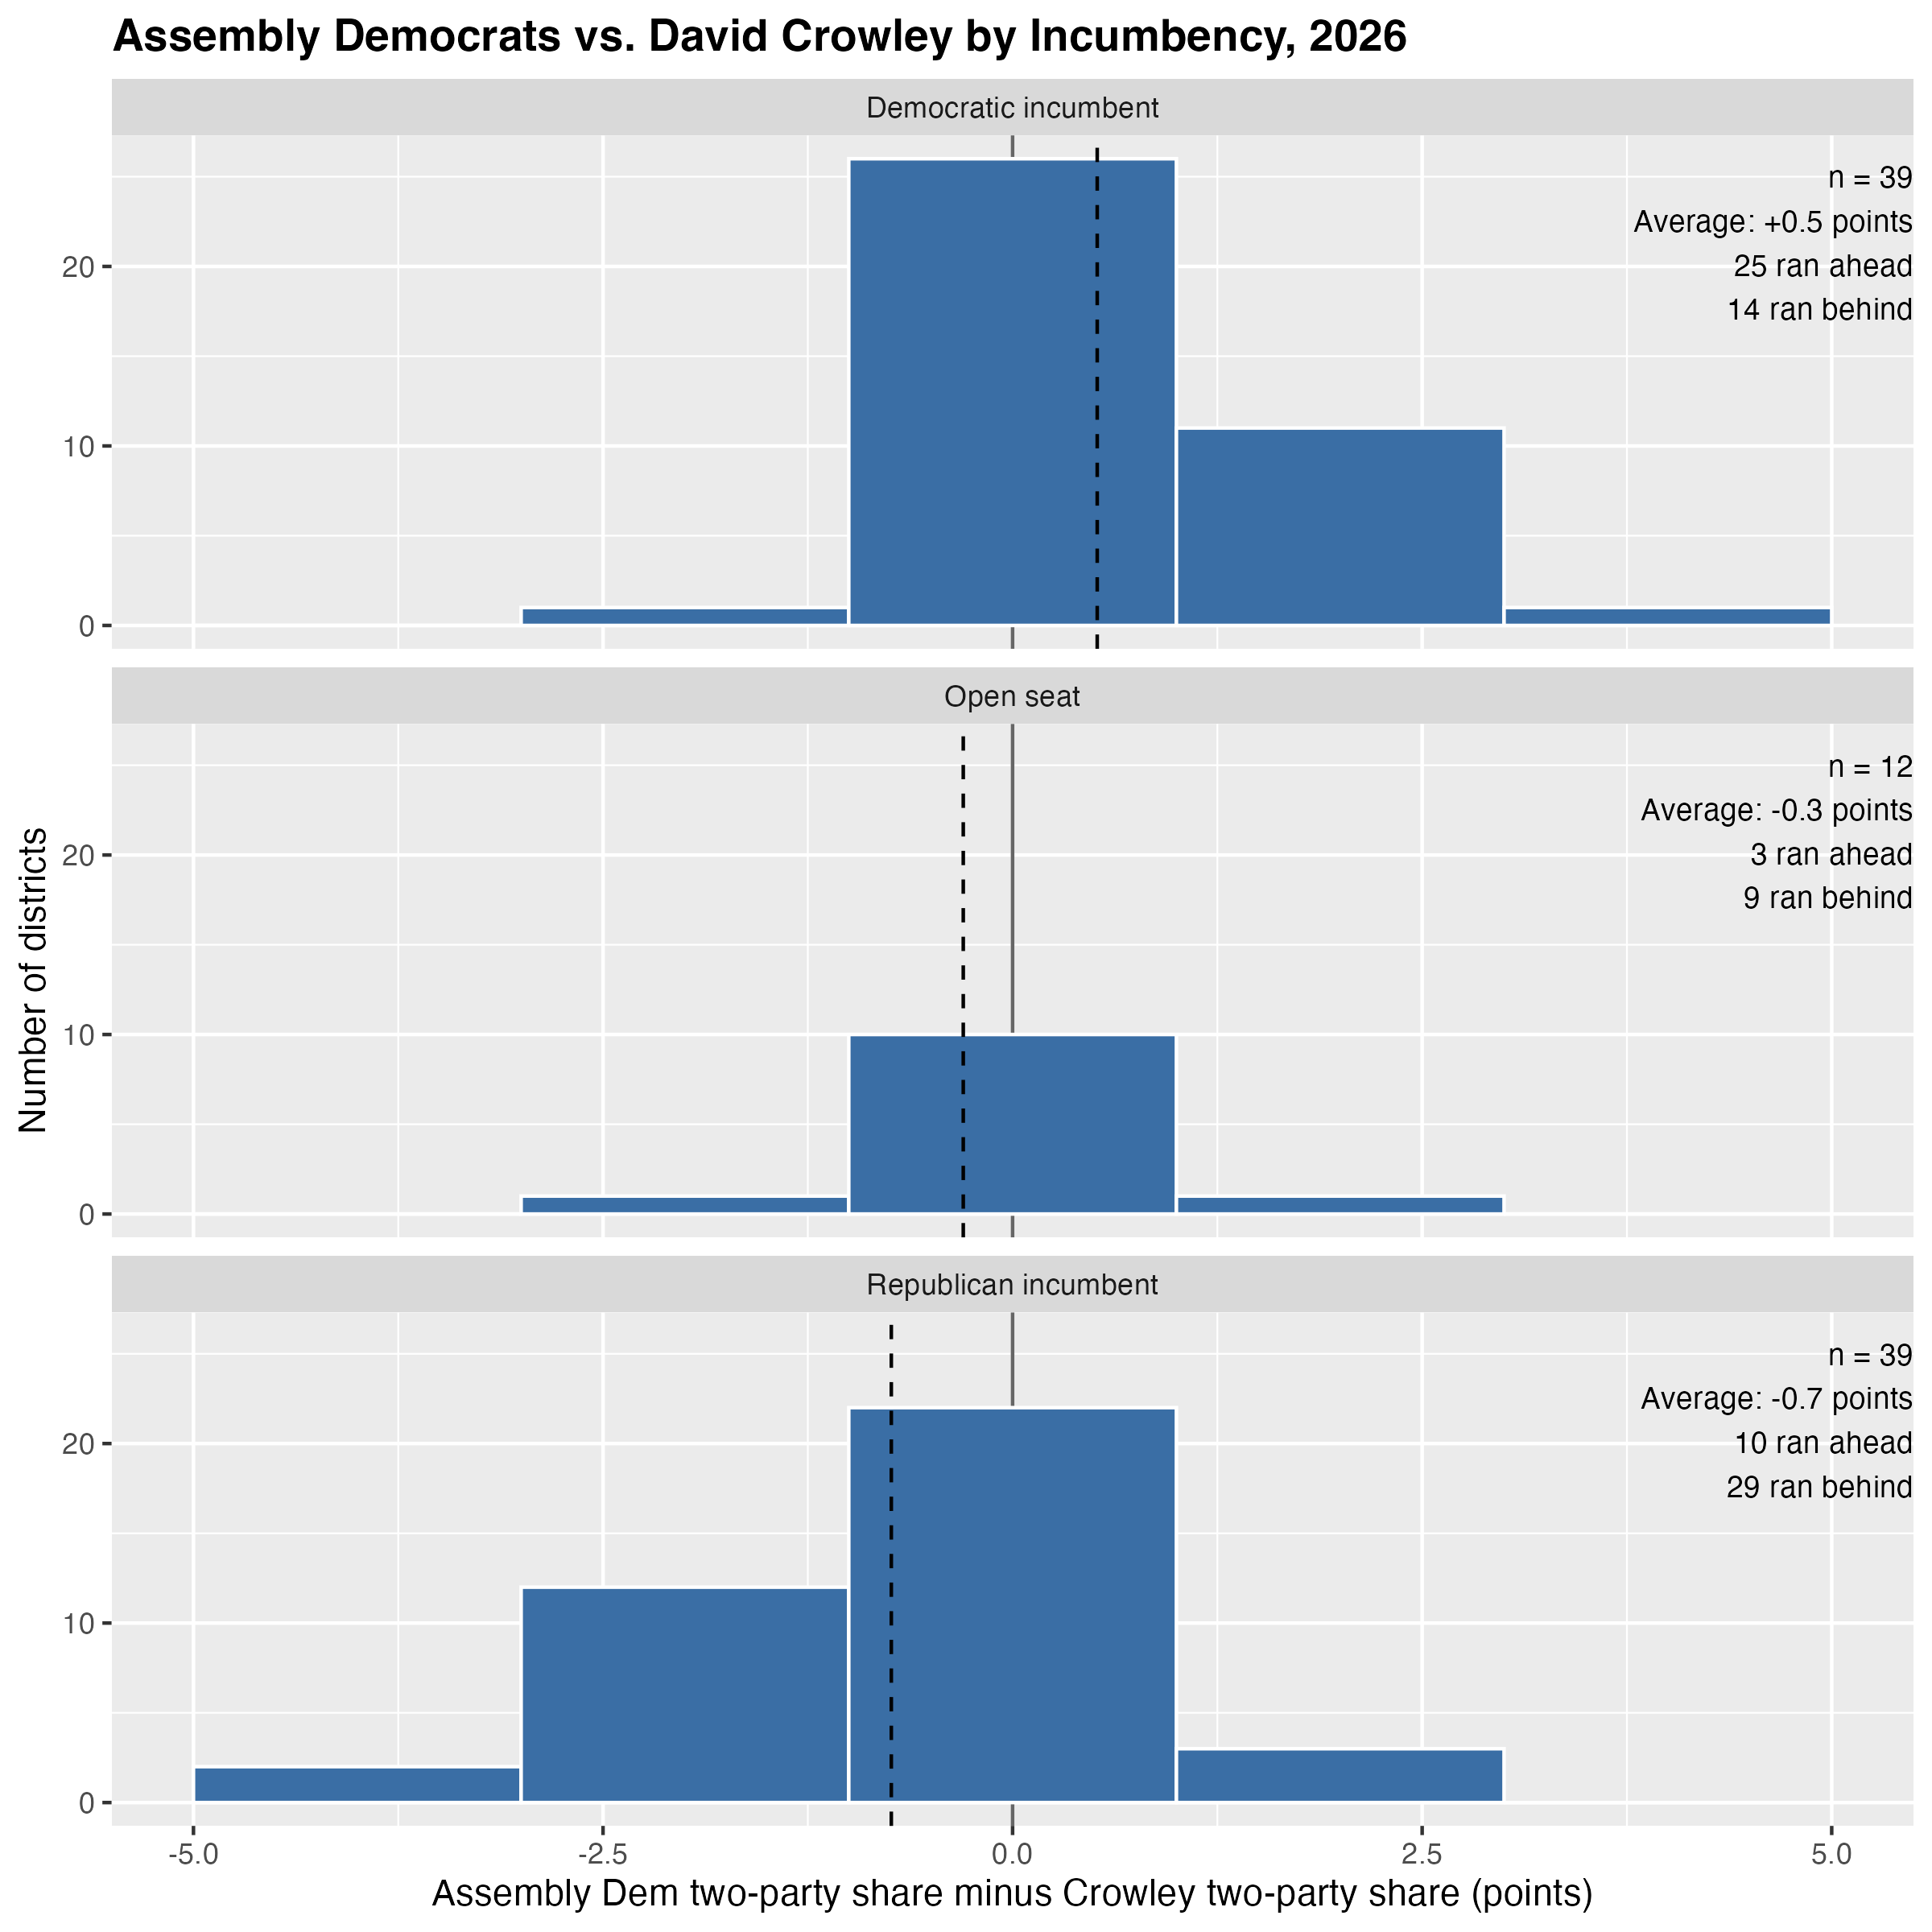
In 2024, actual Democratic candidates only won 45 Assembly seats, meaning they significantly trailed both Tammy Baldwin and Kamala Harris. This time, 38 assembly Democratic candidates ran ahead of Crowley and 52 won less of the vote than he did.
Most incumbent Democrats did better than Crowley; although, 14 of them were still a bit less popular than him. Democrats running in open races or against Republican incumbents tended to be less popular than Crowley.
This time, the blue wave was large enough that small amounts of incumbency advantage were no longer sufficient to save Republicans in marginal seats.
Crowley Performance by Assembly
The rest of this article uses Wisconsin’s 99 assembly districts as a lens through which to understand the gubernatorial election results. It’s more common to do this using the state’s 72 counties, but assembly districts have several advantages for this purpose. There are more of them, so they offer more detail. They are, by definition, about the same size, each holding about 1% of the state’s total population. With caveats, assembly districts tend to follow locally meaningful boundaries. They combine sparsely populated counties into coherent regions. They divide large cities along recognizable neighborhood lines.
Conveniently for elections analysis purposes, the Census Bureau publishes demographic statistics for state legislative districts. For every Assembly district, we know the income, education, race, and age of the citizen, voting age population who lives there.
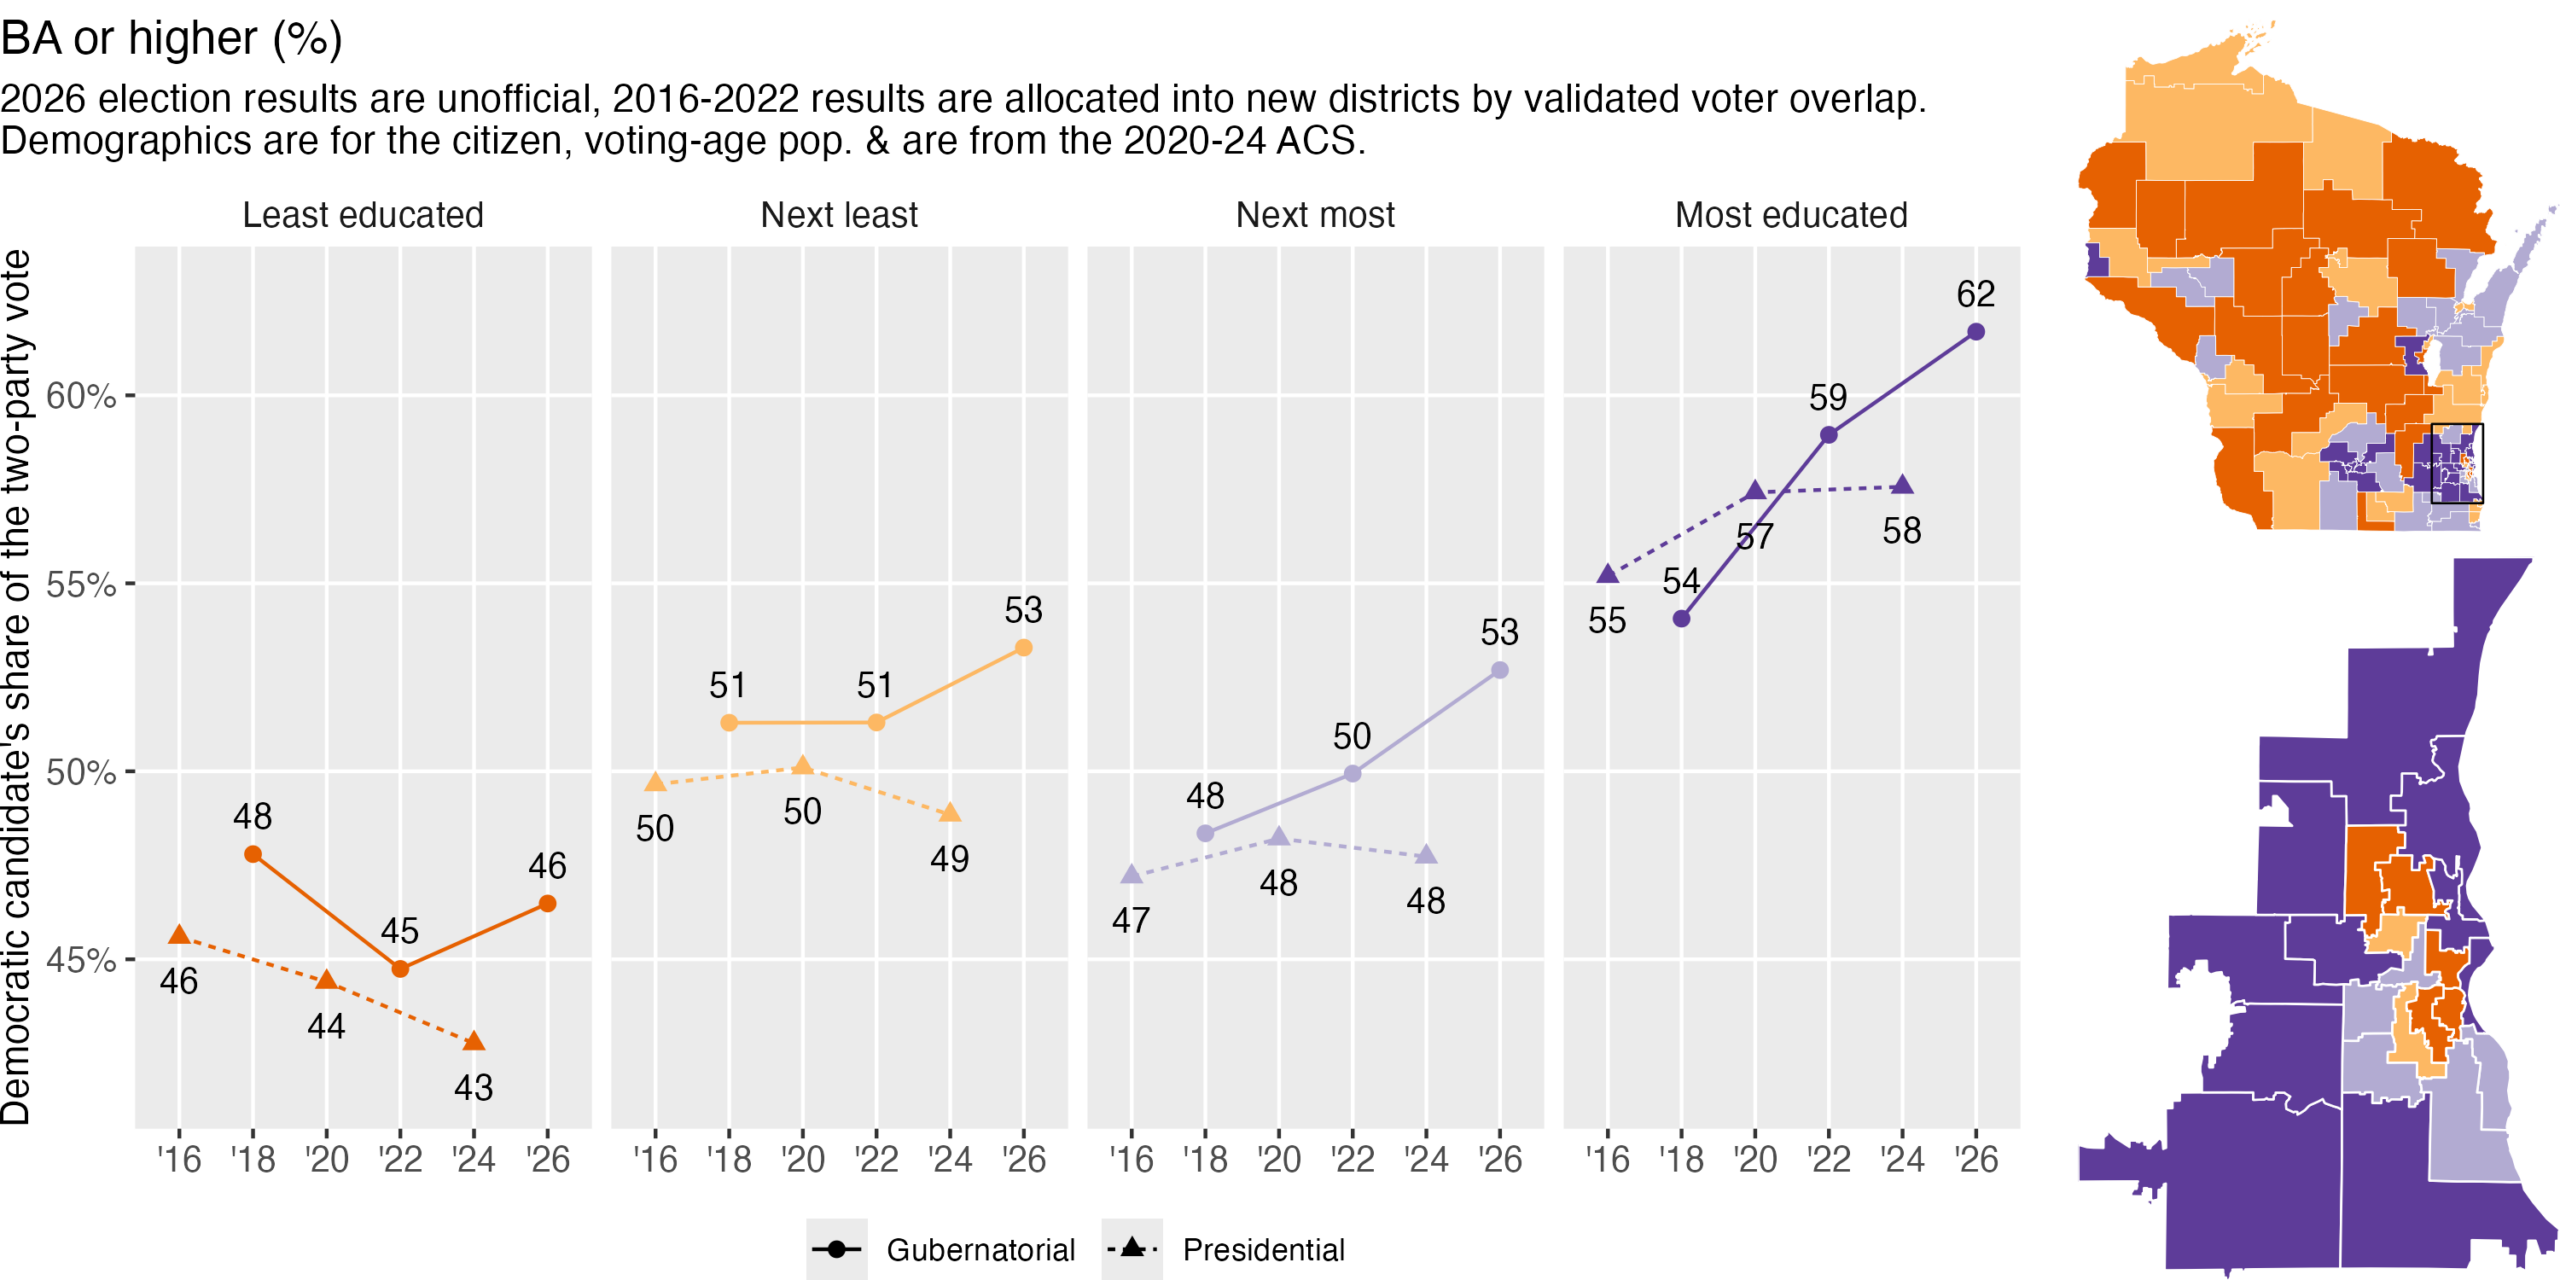
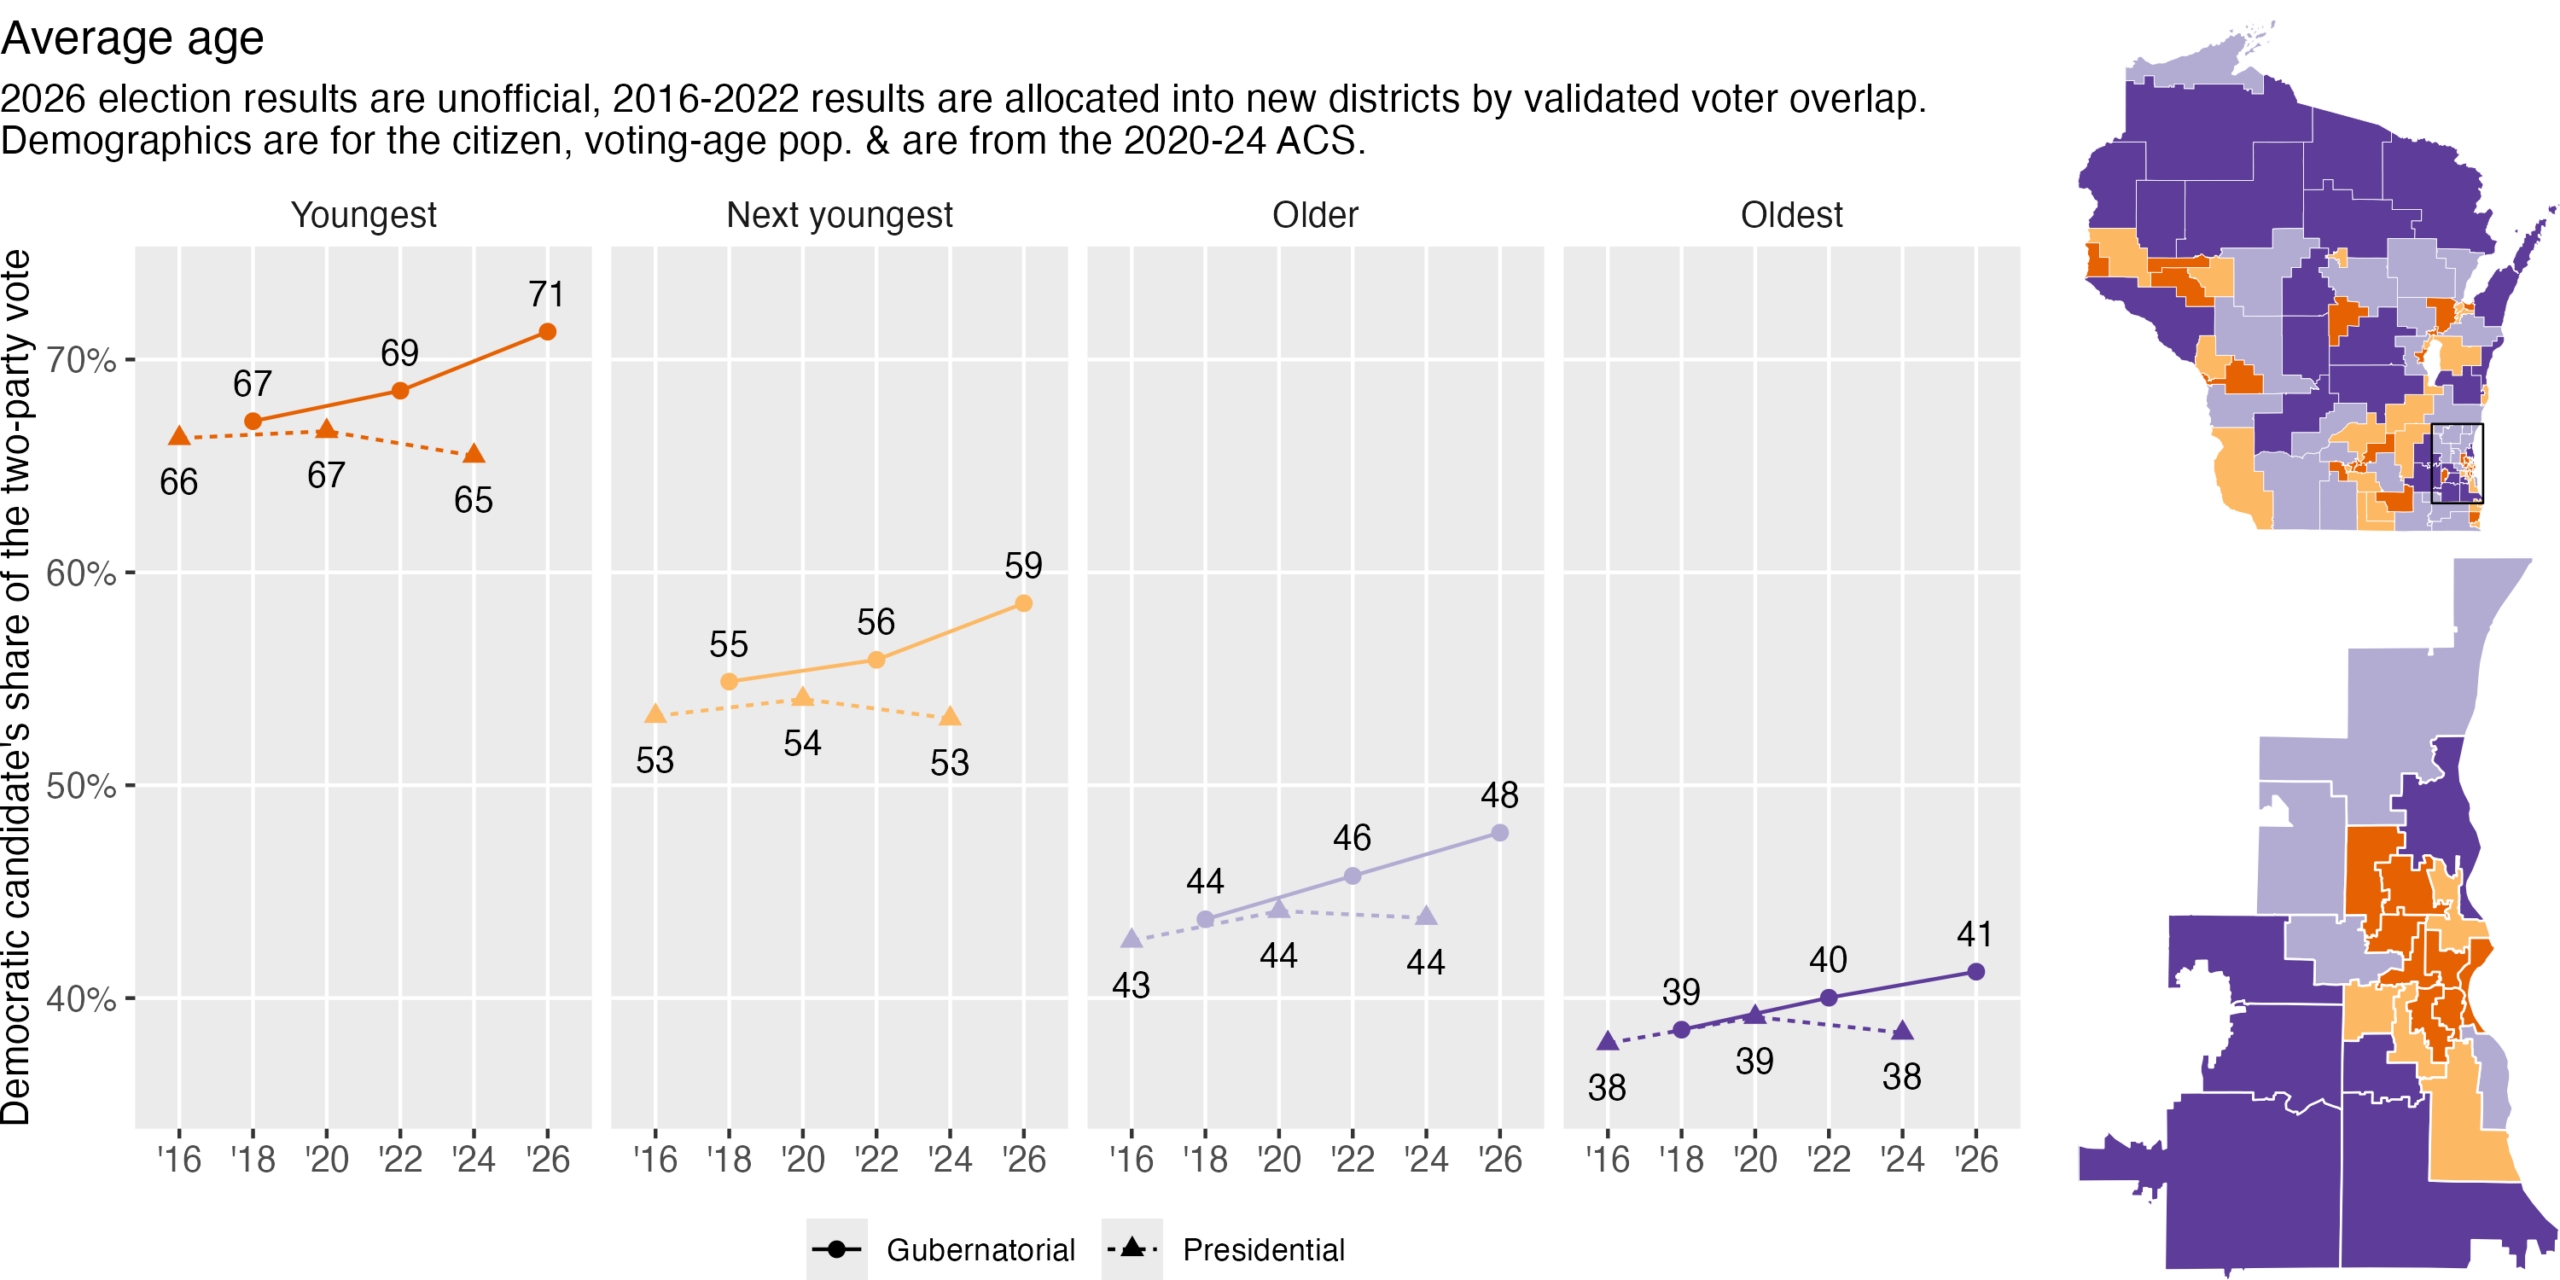
The next series of graphs uses assembly districts to divide the state into four, equally-populated tiers by income, education, and age. For each quartile, I show the percent of the vote won by the Democratic candidate in the last three elections for governor and president. I use two-party vote, just Democrats and Republicans, to avoid the confusion of third party vote shares, which vary from one election to the next. District boundaries changed twice during this period, so when necessary I reallocated results from former ward boundaries into the current districts based on the share of voters in each overlapping section.
There will be a consistent theme across these charts: Democrats improved in every single kind of district, often by similar amounts. This was a wave election, by any standard you might choose.
by income
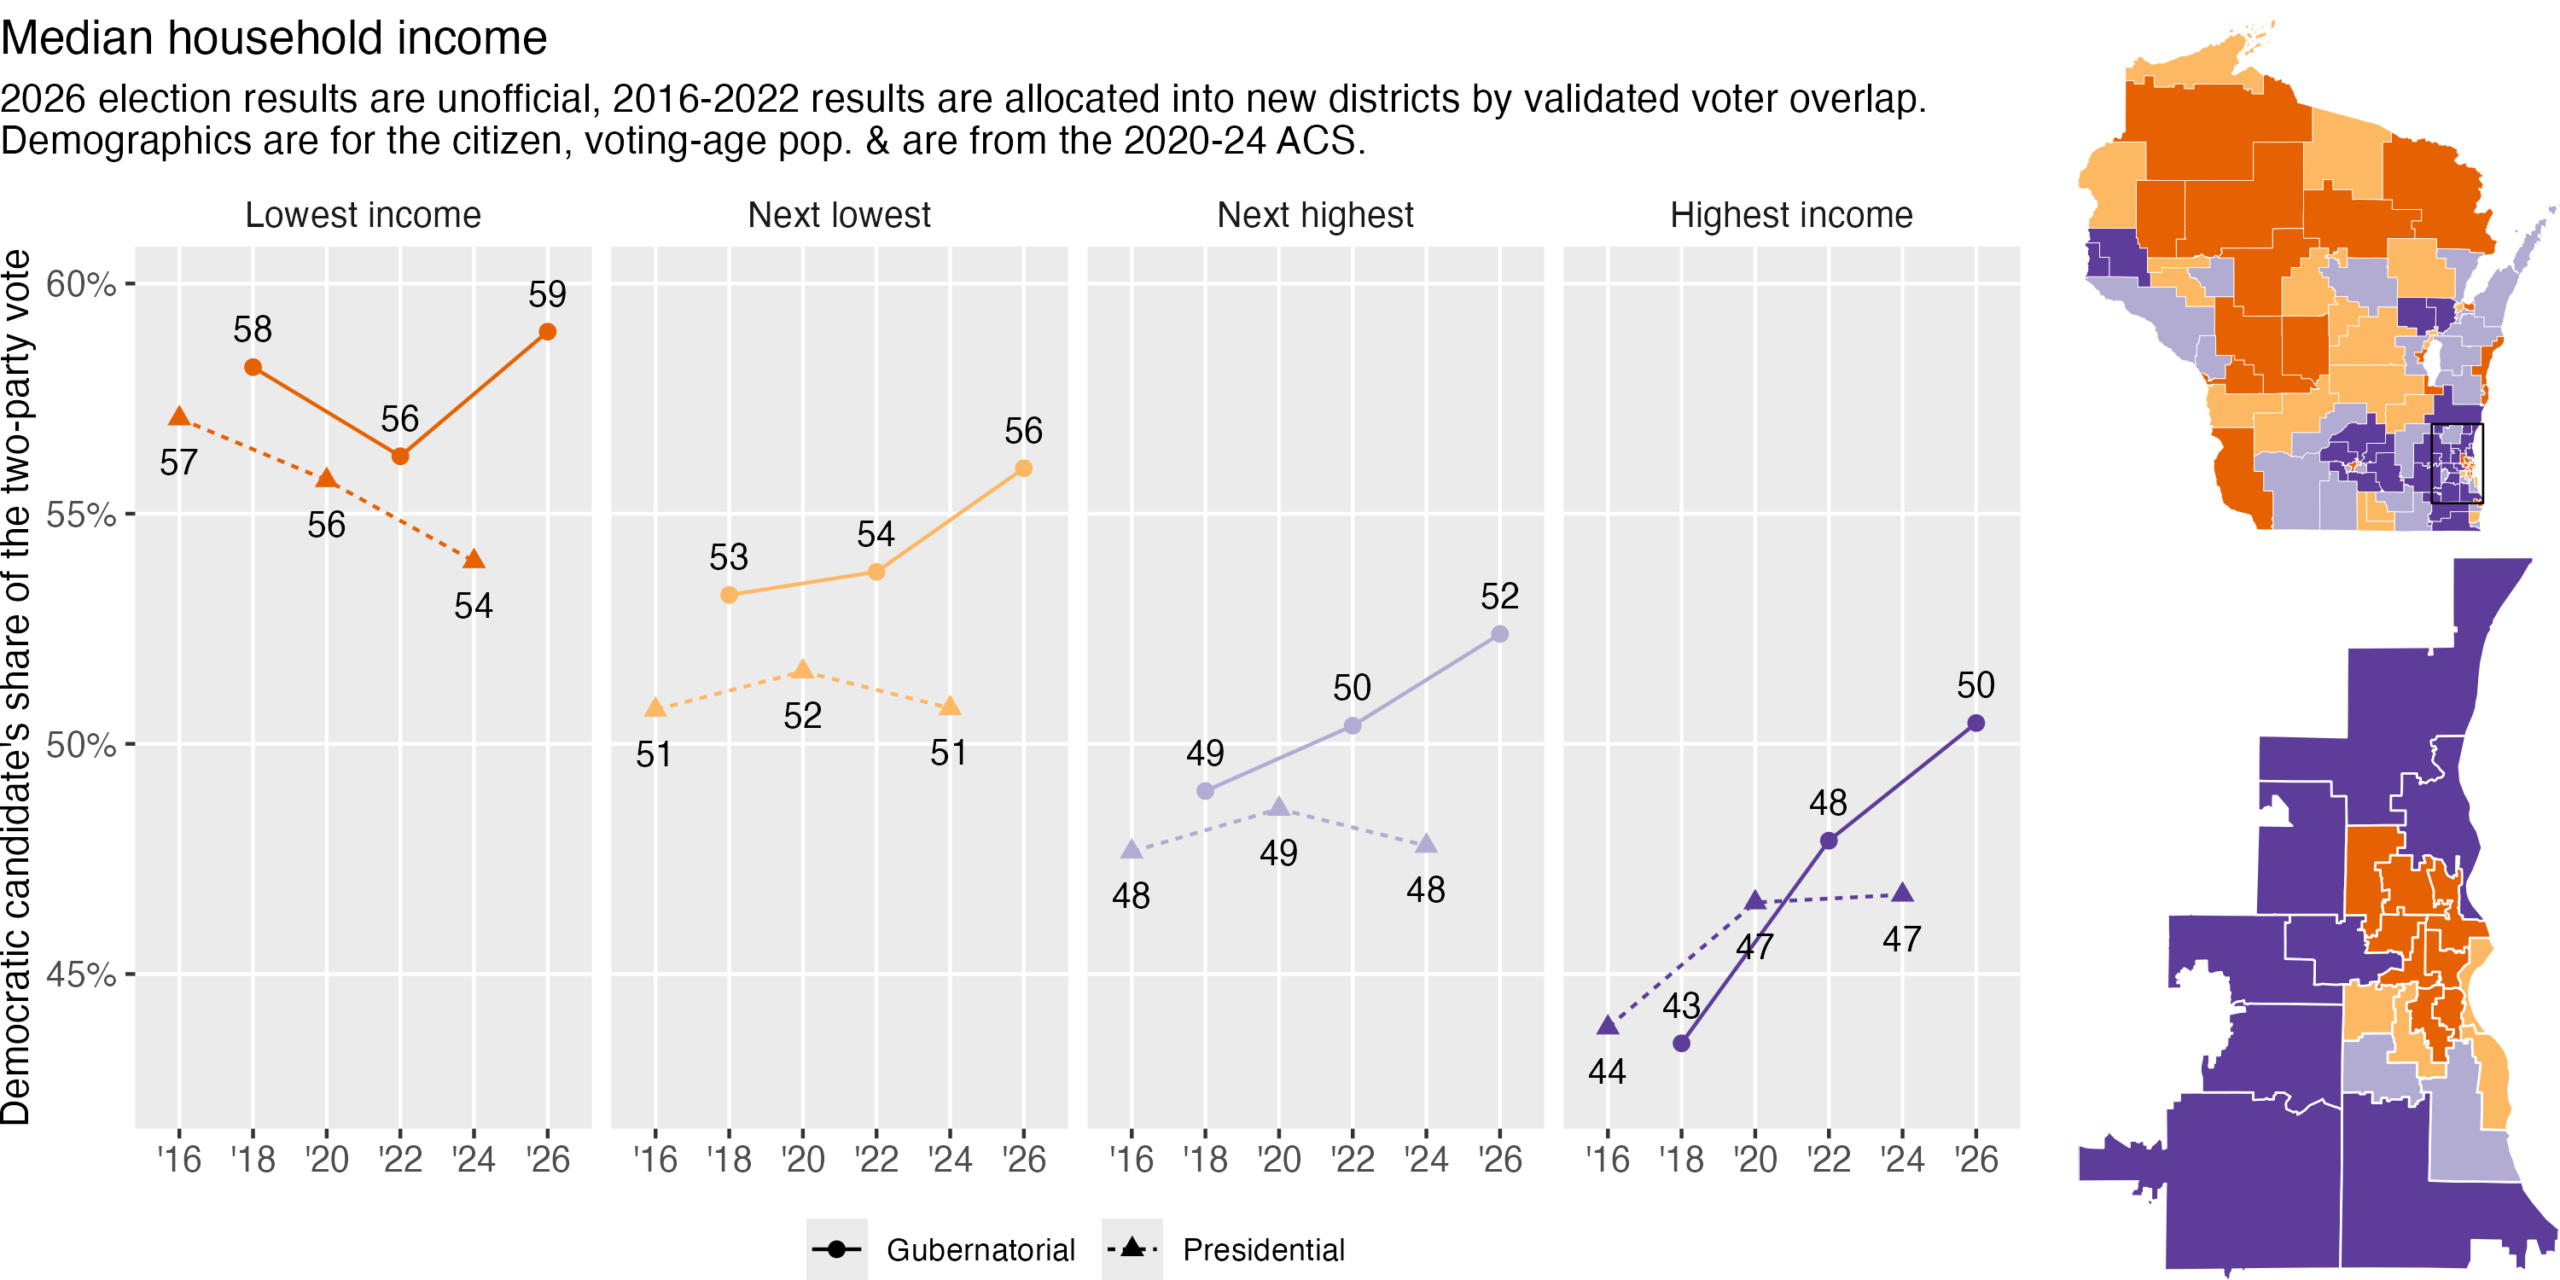
Here are the state’s 99 assembly districts, binned into quartiles by median income. Over the last decade, Democratic performance has generally declined in the poorest quarter of the state and increased in the highest quarter. From 2022 to 2026, Democratic performance jumped everywhere. Still, you can see some quite significant longer term trends. In the poorest parts of the state, Crowley did about as well as Evers in 2018. But in the wealthiest fourth of the state, Crowley won 50% of the vote in 2026, compared with Evers’ 43% in 2018.
by education
Education and income go hand-in-hand. This graph bins the state’s assembly districts into quarters based on the percent of adult citizens with a college degree. In the most educated parts of the state, Crowley won 8 percentage points more of the vote in 2026 than Evers did in 2018, while in the least-educated parts of the state, Crowley won 2 points less than Evers eight years ago.
by age
When dividing the state by age, Crowley’s improvement over Evers was lowest in the oldest places and higher in younger districts.
by race
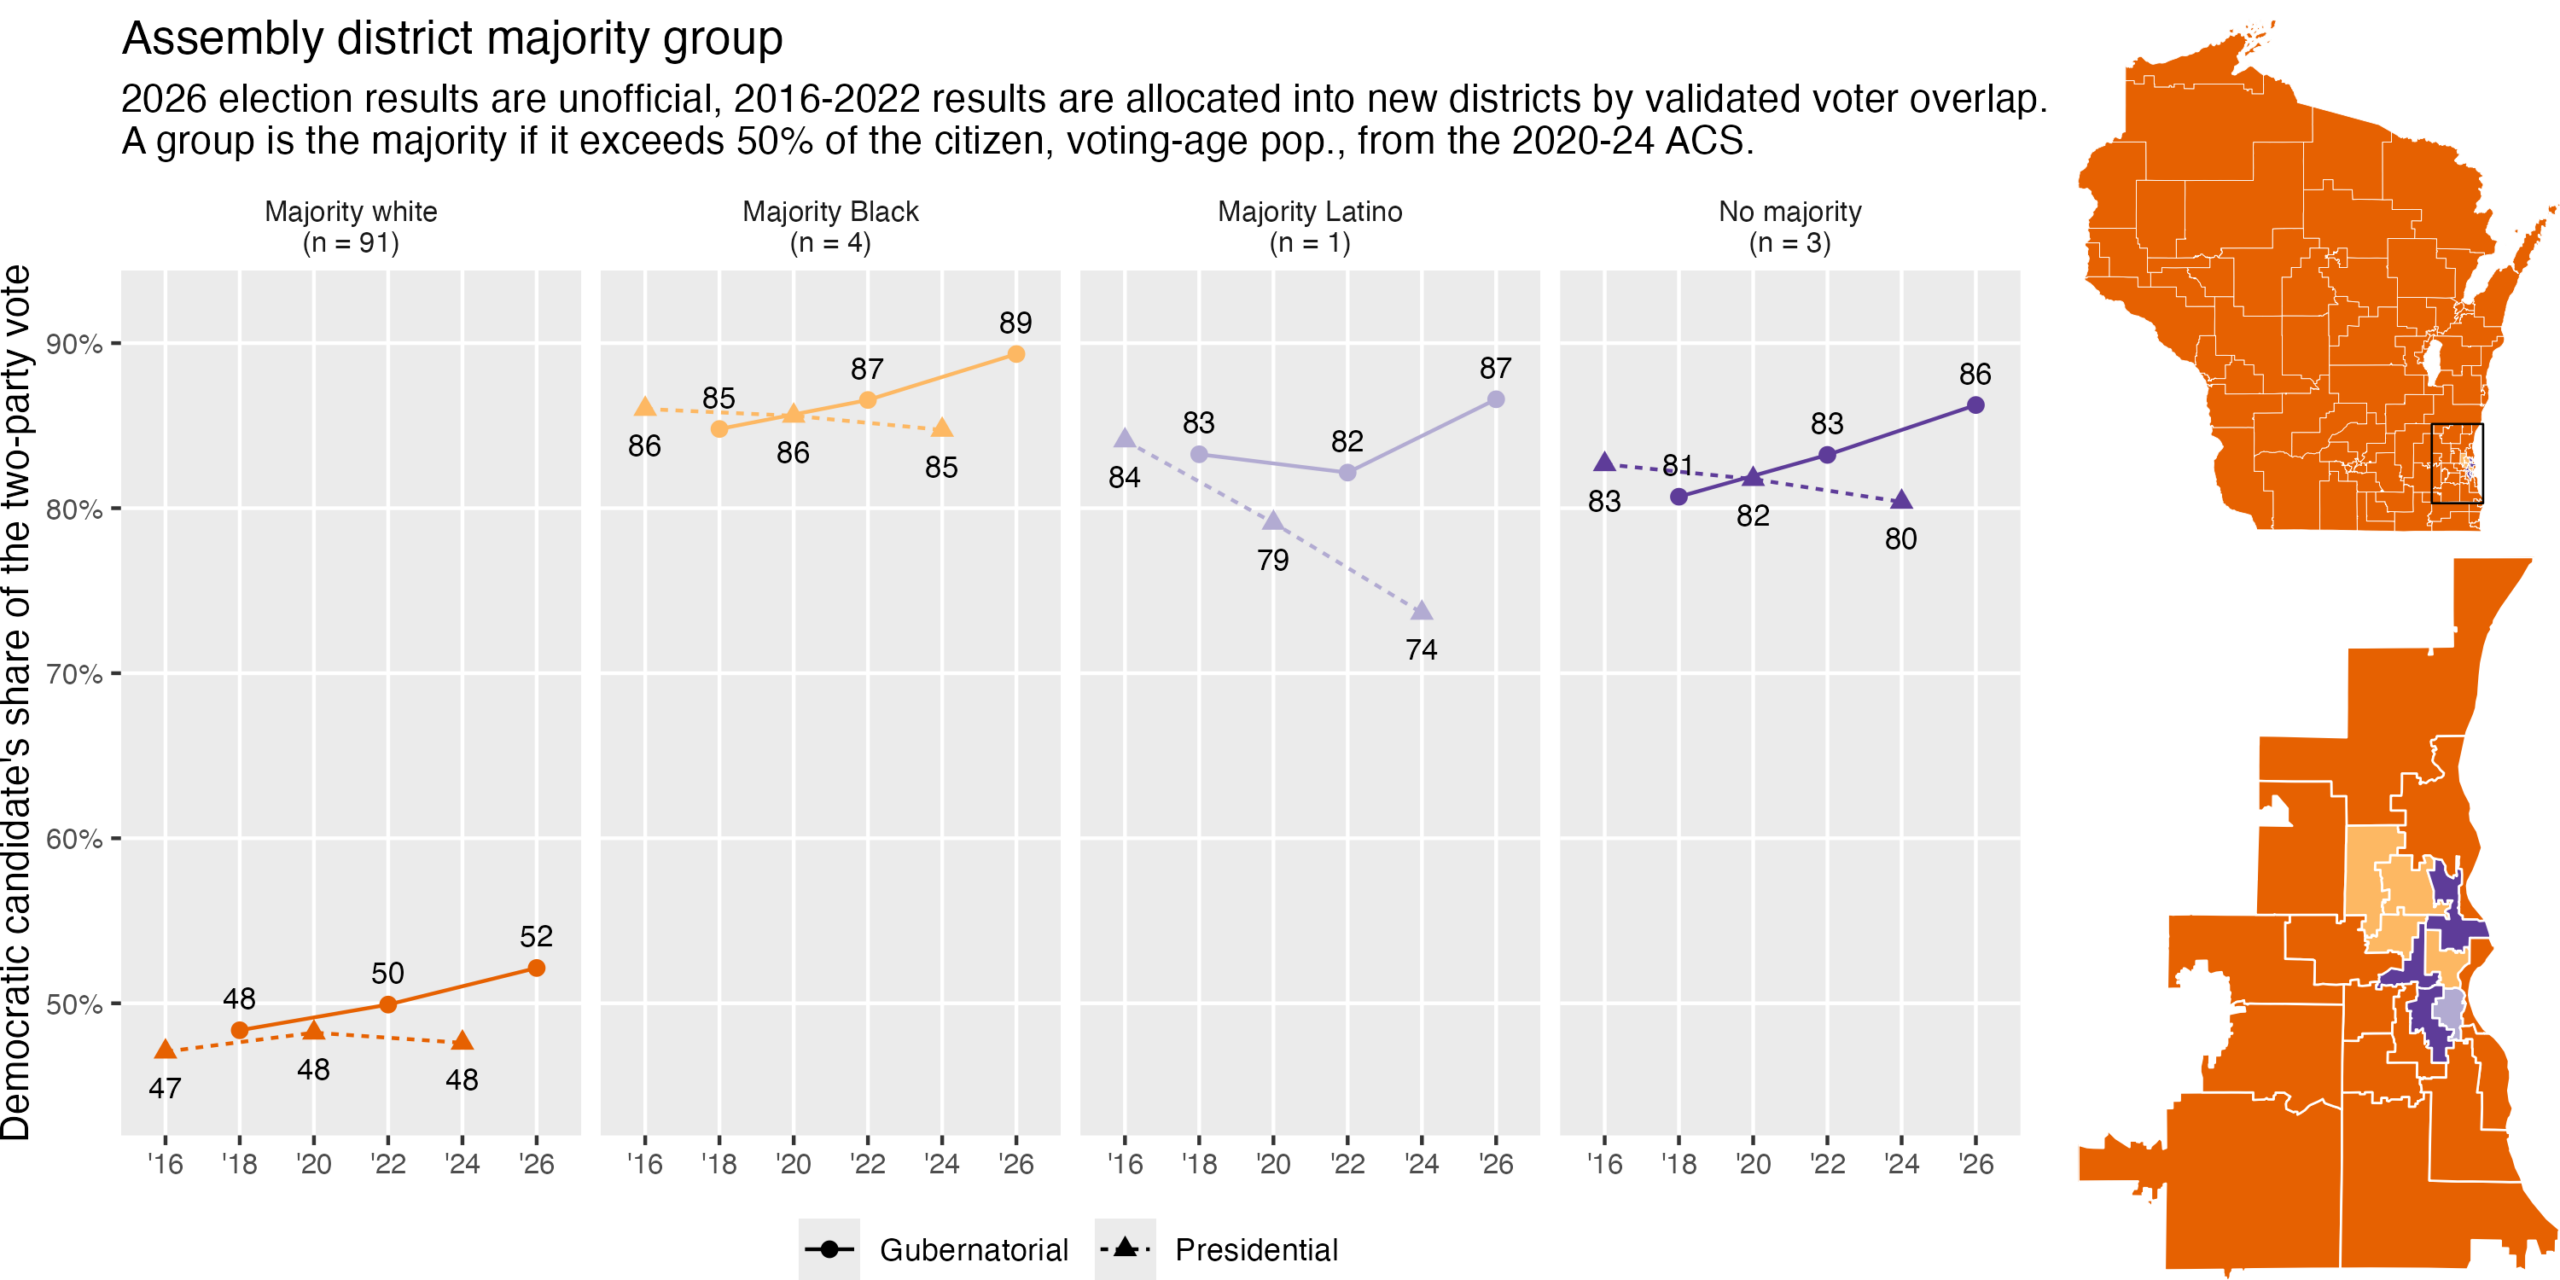
When counting just the adult, citizen population, 91 of Wisconsin’s 99 assembly districts are majority non-Hispanic white, 4 are majority Black, 1 is majority Latino, and three have no majority. All of the non-white majority districts are in Milwaukee. Here we see an interesting divergence in the trends between presidential election and midterms. In presidential years, the share of the vote going to the Democrat has declined in non-majority white districts. The drop has been quite modest among Black voters and much steeper in the state’s sole majority Latino district. However, in the lower-turnout midterm election, the exact opposite has occurred. David Crowley did much better in these non-white districts than Evers, particularly in his 2018 race.
This divergence reflects, I believe, differences in who shows up in a midterm versus a presidential election. With all but tiny Taylor County reporting, turnout in Wisconsin’s 2026 midterm stands at about 2,650,000. That is slightly down from 2022 or 2018, and it is 776,000 fewer voters than showed up in November 2024. I suspect those missing three-quarters of a million voters are mostly disillusioned Trump supporters.