The 2020 census found a population decline of 17,611 in the City of Milwaukee since 2010. This 3% population decline came as a surprise because it exceeded recent estimates based on other data. Some observers—most prominently from City Hall—have suggested the Census Bureau undercounted Milwaukee. This concern is worth taking seriously given the difficulties of the pandemic and the Trump administration’s ultimately unsuccessful but well-publicized efforts to include a question about citizenship on the census.
However, a careful consideration of the census data shows no real evidence for an undercount. On the contrary, the 2020 census count is consistent with long-observed facts about Milwaukee’s demographic trajectory and other, independent data sources.
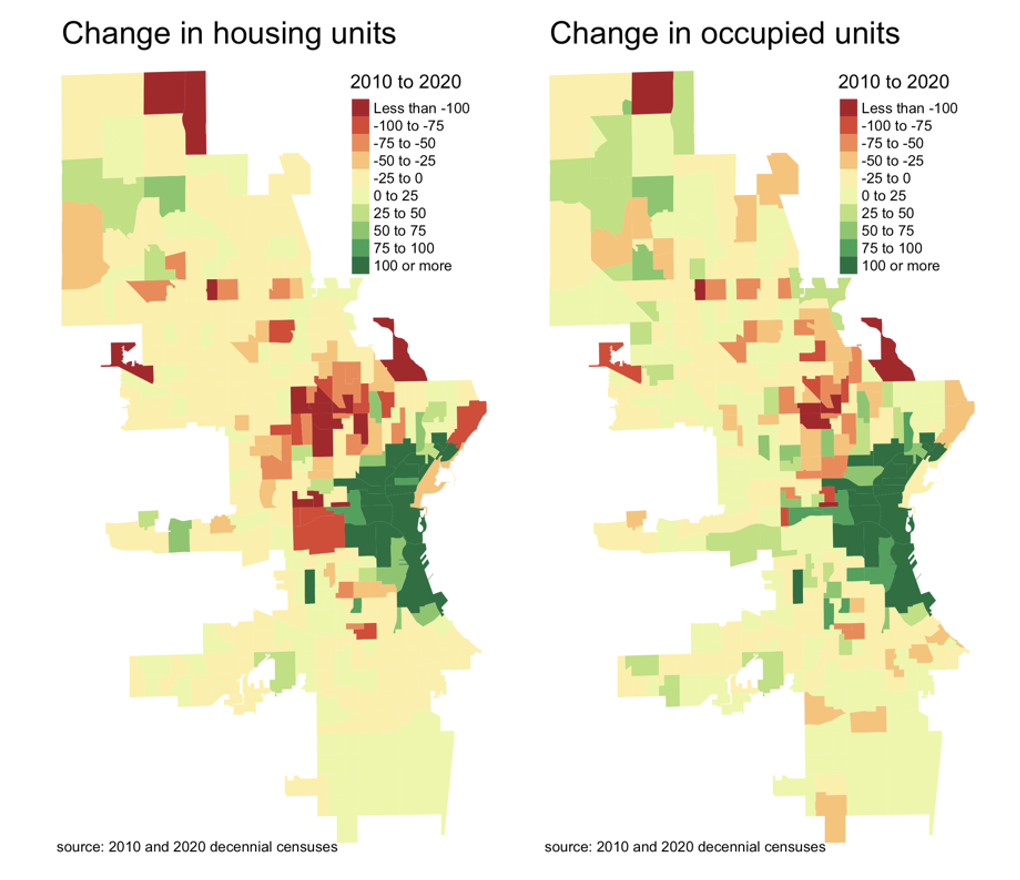
A big reason why a shrinking population feels intuitively wrong to many Milwaukeeans is that some parts of the city really are growing—specifically the places people most often visit. Just look at the new buildings going up in the North End, Bay View, and the Harbor District. In fact, the census accurately captured this growth. The total number of housing units grew from 255,570 in 2010 to 257,723 in 2020. Occupied housing units increased even more, by 5,189. This is consistent with records from city tax rolls which show a similar increase in units.
Even though the number of households increased, the population still declined, thanks to a drop in the number of kids living in the city. The population of those under 18 fell by 16,885, but the population of adults fell by just 727. There are more households in Milwaukee, but fewer people living in them.
Average household size fell from 2.50 in 2010 to 2.39 in 2020. Imagine a block with 20 dwellings. Now, on average, 2 fewer people live on that block.
Milwaukee’s property developers certainly understand these trends. New construction in the city is by-and-large for singles and couples—not families with kids. Just 7% of new units built during the 2010s were single family homes or duplexes.
Household size stayed about the same in the Milwaukee County suburbs during the 2010s. This explains why the Census Bureau’s most recent figures from the Population Estimates Program (PEP) differed so much from the 2020 census count. PEP isn’t a survey, it uses administrative records on births, deaths, and migration to model total population for UI.S. counties. This kind of data is thoroughly gathered, so it was a real cause for concern when the PEP number differed so much from the Census. PEP put the city’s population at 589,839 in 2020, a difference of 2.2% from the actual count.
PEP’s estimate of Milwaukee County’s population was much more accurate than its estimate for the City of Milwaukee specifically. It missed the 2020 census count by just 6,600, or 0.7%. PEP overestimated the size of city and underestimated the suburbs.
The reason why, it turns out, lies with the way PEP divvies up county population estimates into municipalities. Along with tracking components of population change at the county level, PEP also tracks the construction of housing units within municipalities. It then uses these updated housing unit counts to divide the county’s population into municipalities using the average household size from the 2010 census. But in reality, household size in the City had shrunk while size in the suburbs hadn’t. Consequently, the city received too large a share of the (pretty accurate) county population estimate.
Is it really true that the number of kids in Milwaukee declined by almost 17,000 since 2010? And, if so, what accounts for this drop? A change that big should leave a mark, even beyond the decennial census. One obvious place to look is school enrollments, and these do show a decline. MPS schools (including affiliated charters) enrolled 7,516 fewer students in the fall of 2019 compared to the fall of 2009. Net open enrollment to districts outside Milwaukee declined by another 1,367. But when we include other schools within city limits, things don’t look so bad. Enrollment in non-district charters grew 2,243 and private schools saw an increase of 911.
Importantly, though, enrollment in schools with Milwaukee addresses is not the same thing as kids living in Milwaukee. For one thing, the youngest don’t attend school (and enrollment records show big declines among elementary age students). For another, some private schools attract students who live in the suburbs.
A better way to track the number of kids in Milwaukee is via birth statistics. Each year, a group of kids turns 18 (becoming adults) and another group of kids is born. Our decades long trend of declining birth rates means that the number of kids born in a given year is always smaller than the cohort born 18 year earlier, causing the population of children to shrink. Over the course of a decade this has big cumulative effects. In fact, 15,983 fewer kids were born in Milwaukee from 2010-2019 than from 1992-2001—the cohort who aged into adulthood.
Recall that Milwaukee’s under-18 population declined by 16,887 from 2010 to 2020. Almost all of this is explained simply by declining birth rates. About 16,000 fewer kids were born this decade than 18 years ago. The outstanding loss in the child population can be attributed to negative net migration—more families with kids leaving than moving into the city. The Census Bureau’s American Community Survey published net migration estimates for municipalities by age, covering the period 2010-15. In that period, Milwaukee lost an estimated 1,700 kids to negative net migration each year.
If anything, Milwaukee’s decline in children measured by the 2020 census is smaller than expected. What’s more, Milwaukee’s residency requirement for public employees ended in 2016 (MPS’s ended in 2013). Since then, thousands of cops, firefighters, general city employees, and school district workers have moved to the suburbs, taking their families with them. As of August 2019, about 4,000 city and school district employees lived outside the city.
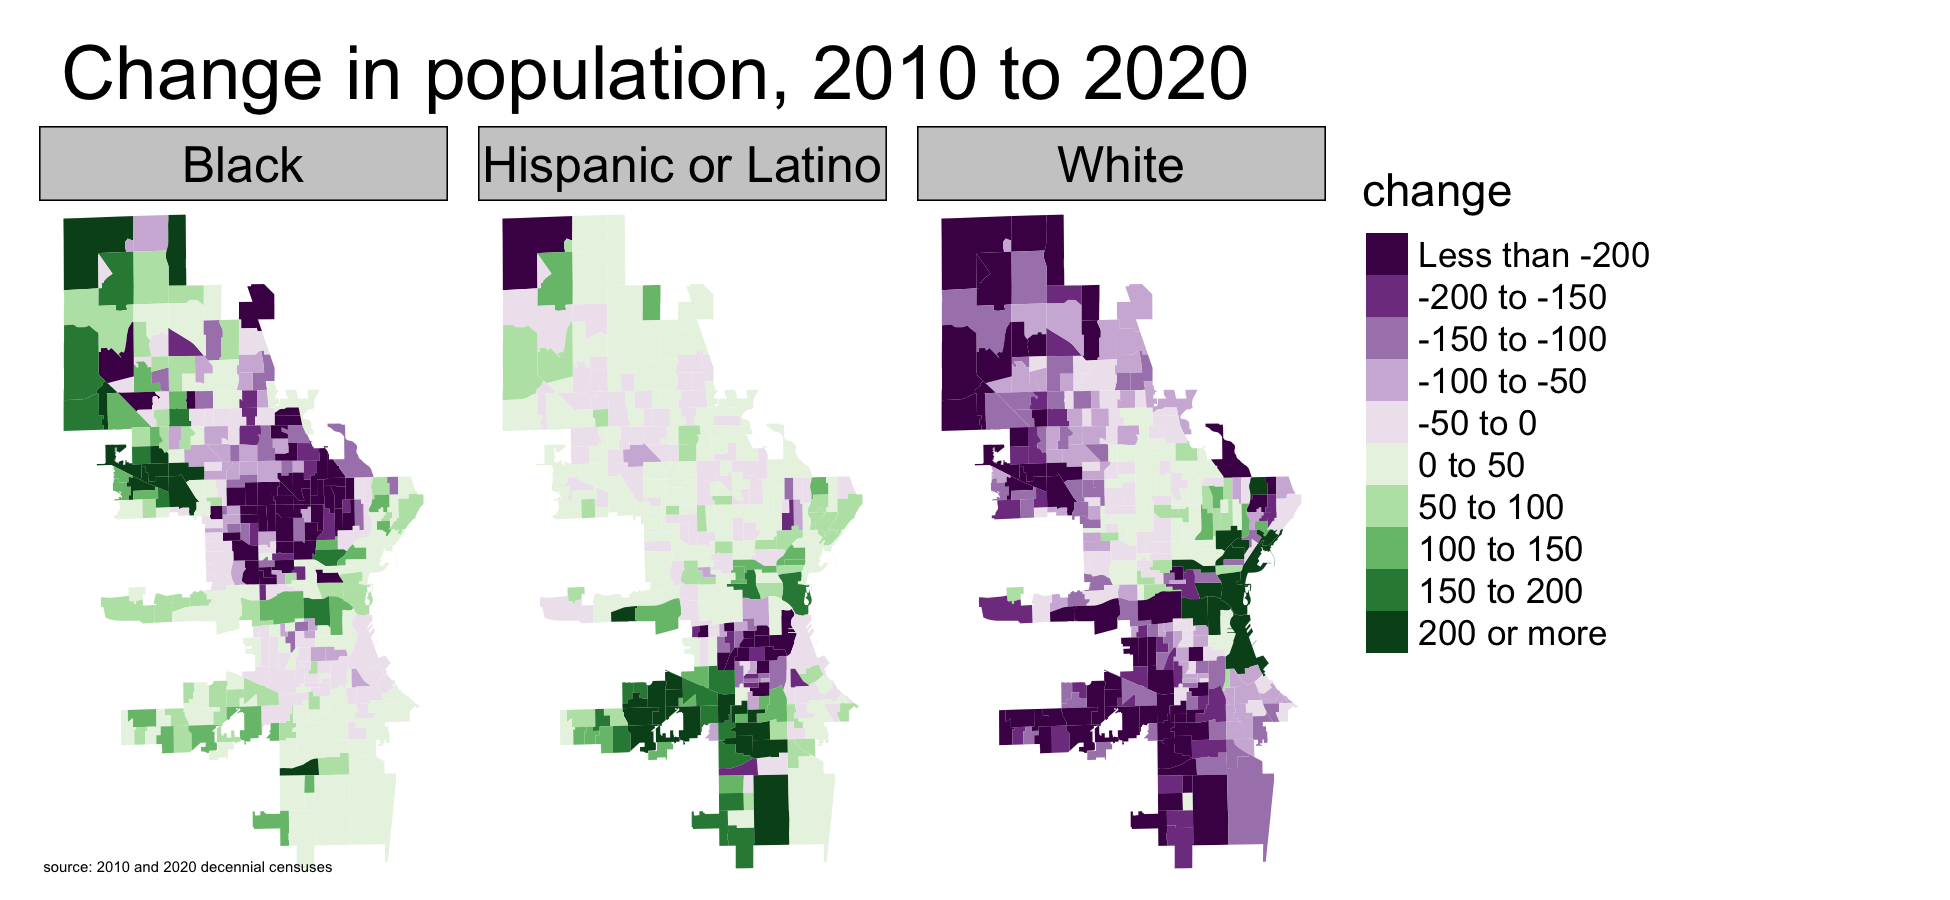
I believe this exodus helps explain some of the population changes within the City of Milwaukee over the last decade. Here we depart from what Census data alone can tell us. But judging by maps of population change, this is my best guess as to what happened. When the residency requirement lifted, several thousand (mostly white) households moved to the suburbs. These emigrants mostly left neighborhoods on the far south and southwest sides along with the Enderis Park area on the northwest side. As space opened up in these desirable neighborhoods, people (mostly Latino and Black) began moving from the near north and near south sides—contributing to a significant population decline in those areas. Meanwhile, in a basically unrelated phenomenon, singles and couples filled in the new housing developments stretching from the northern end of Bay View through the Upper East Side. Elsewhere in the city, general aging and reduced birth rates common across the country caused an incremental reduction in typical household size, and thus population.
Some of that is informed speculation, but this much is clear from the data. If it feels like the city is growing, that’s because the number of occupied households did increase, but fewer people are living in them. Milwaukee’s population declined in the 2020 census mainly because there are fewer children. This is wholly consistent with the general trend of declining birth rates. In fact, given earlier estimates of negative net migration, the only surprising thing is that losses weren’t higher.