MILWAUKEE – Even as hearings that could lead to President Donald Trump’s impeachment heat up, a new Marquette University Law School poll of Wisconsin registered voters finds consistent, if sometimes modest, shifts in public opinion away from support of impeachment and toward supporting Trump in next year’s presidential election
For example, Trump holds small leads over each of four top Democratic candidates for president in head-to-head matchups in the new survey, while three of the Democrats held small leads over Trump in the previous poll.
While the shifts in opinion on both impeachment and presidential preferences are not large, they are consistent across multiple questions in the poll. That includes increases in support for Trump’s work on foreign policy and the economy.
The poll was conducted Nov. 13-17, 2019. The sample included 801 registered voters in Wisconsin interviewed by cell phone or landline, with a margin of error of +/- 4.1 percentage points.
Opinions on impeachment overall
In the new poll, 40 percent of registered voters think that Trump should be impeached and removed from office, while 53 percent do not think so and 6 percent say that they do not know.
In October, before public hearings began, 44 percent favored impeachment and removal from office, while 51 percent were opposed, and 4 percent said they didn’t know.
The November results also find that 52 percent say they believe Trump asked the Ukrainian president to investigate Trump’s political rivals, while 29 percent believe Trump did not do this. Eighteen percent say they don’t know if Trump asked this or not.
Forty-one percent believe Trump withheld military aid to pressure the Ukrainian president to investigate Trump’s political rivals, while 38 percent do not believe Trump did this and 21 percent say they don’t know.
Forty-two percent say that Trump did something seriously wrong in his dealings with Ukraine, 9 percent say he did something wrong but not seriously so, and 38 percent say Trump did nothing wrong. Eleven percent say they don’t know.
Views of impeachment by partisanship and attention to hearings
There are large partisan differences in views of impeachment, with Democrats much more supportive and Republicans much more opposed, and a plurality of independents opposed. Comparing the October and November polls, support for impeachment and removal declined slightly among Democrats, and opposition to removal rose slightly among Republicans. “Don’t know” responses rose among independents and Democrats and barely declined among Republicans.
Table 1: Impeach and remove Trump from office by party identification, November
| Impeach & remove | Don’t think so | Don’t know | |
| Republican | 4 | 94 | 2 |
| Lean Republican | 7 | 92 | 1 |
| Independent | 36 | 47 | 15 |
| Lean Democrat | 73 | 20 | 8 |
| Democrat | 81 | 11 | 7 |
Table 2: Impeach and remove Trump from office by party identification, October
| Impeach & remove | Don’t think so | Don’t know | |
| Republican | 6 | 92 | 2 |
| Lean Republican | 9 | 88 | 3 |
| Independent | 33 | 55 | 10 |
| Lean Democrat | 78 | 16 | 6 |
| Democrat | 88 | 8 | 3 |
Partisans
are reacting differently to the testimony and other evidence, with Democrats
much more likely than Republicans to say that Trump asked the Ukrainian president
to investigate his political rivals. Opinion among independents tends to fall
in between the results in the partisan groups.
Table 3: Did Trump ask for investigation of political rivals?
| Yes, did ask | No, did not ask | Don’t know | |
| Republican | 29 | 51 | 20 |
| Lean Republican | 29 | 53 | 17 |
| Independent | 41 | 24 | 33 |
| Lean Democrat | 81 | 8 | 10 |
| Democrat | 80 | 8 | 12 |
While about 3 in 10 Republicans thus think that Trump asked for an investigation (Table 3), only about 1 in 10 Republicans think Trump withheld military aid to pressure the Ukrainian president into an investigation (Table 4, below). Eight in 10 Democrats believe Trump asked for an investigation, and 3 in 4 think that he withheld aid to exert pressure for an investigation. Forty-one percent of independents think Trump asked for an investigation, while 30 percent think he withheld aid as pressure. Independents are the most likely group to say they don’t know if Trump did either of these things, with 33 percent saying they don’t know whether he asked for an investigation and 41 percent saying they don’t know whether he withheld aid.
Table 4: Did Trump withhold aid to pressure Ukraine for investigation of political rivals?
| Yes, held up aid | No, did not hold up aid | Don’t know | |
| Republican | 8 | 70 | 21 |
| Lean Republican | 11 | 70 | 19 |
| Independent | 30 | 26 | 41 |
| Lean Democrat | 75 | 10 | 15 |
| Democrat | 77 | 7 | 16 |
Thirty-two percent of all registered voters say that they are following the news and testimony in the impeachment hearings very closely, with another 33 percent saying they are following fairly closely. Twenty percent are not following too closely, and 14 percent are following not at all closely.
There are no statistically significant differences in attention to the hearings by partisanship, although independents are more likely to say they are not following closely at all.
Table 5: Attention to hearings by party identification
| Very closely | Fairly closely | Not too closely | Not at all closely | |
| Republican | 33 | 36 | 18 | 12 |
| Lean Republican | 29 | 34 | 20 | 16 |
| Independent | 20 | 26 | 25 | 28 |
| Lean Democrat | 32 | 34 | 21 | 14 |
| Democrat | 39 | 30 | 19 | 11 |
Those who are following the hearings most closely are much more likely to have an opinion about the evidence than are those not paying close attention. Of those paying very close attention, 61 percent say that Trump asked for an investigation, 33 percent say he did not ask, and only 5 percent say they don’t know. By contrast among those not following the hearings at all closely, 34 percent say Trump asked, 23 percent say he did not ask, and 41 percent say they don’t know.
Table 6: Did Trump ask for investigation of political rivals? By attention to hearings
| Yes, did ask | No, did not ask | Don’t know | |
| Very closely | 61 | 33 | 5 |
| Fairly closely | 56 | 30 | 13 |
| Not too closely | 46 | 26 | 28 |
| Not at all closely | 34 | 23 | 41 |
A similar pattern holds with attention and opinion on whether Trump withheld aid to pressure Ukraine for an investigation. Both the percentage saying he did do this and the percentage saying he did not are higher among the most attentive, and both percentages are lower among the least attentive. Among the most attentive, only 4 percent say they don’t know, while over half of the least attentive say they don’t know.
Table 7: Did Trump withhold aid to pressure Ukraine for investigation of political rivals? By attention to hearings
| Yes, held up aid | No, did not hold up aid | Don’t know | |
| Very closely | 51 | 45 | 4 |
| Fairly closely | 46 | 40 | 13 |
| Not too closely | 32 | 35 | 34 |
| Not at all closely | 20 | 23 | 55 |
General election matchups
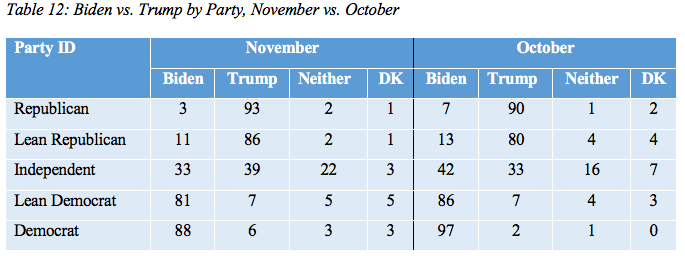
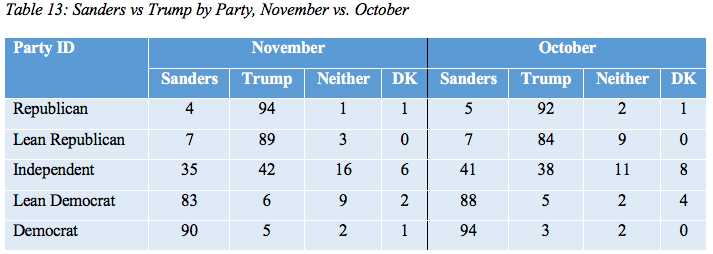
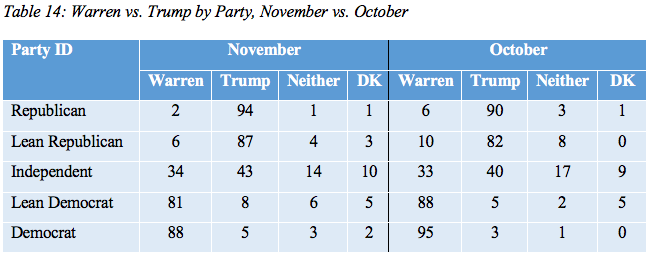
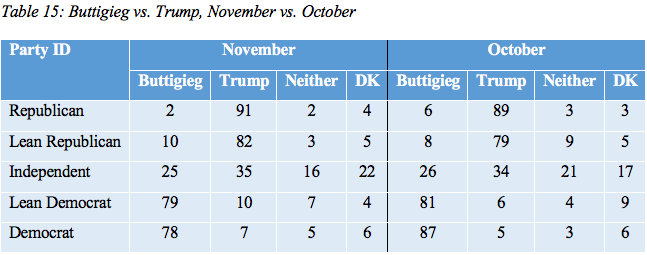
Wisconsin voters were asked whom they would support as of now in the presidential election, Trump or each of four leading candidates for the Democratic nomination. Trump has 3-point leads over former Vice President Joe Biden and Sen. Bernie Sanders, a 5-point margin over Sen. Elizabeth Warren, and an 8-point lead over Mayor Pete Buttigieg. In October, Biden, Sanders, and Warren had small leads and Buttigieg trailed by 2 percentage points.
A summary
of the general election results in this November poll is shown in Table 8. For
comparison, the October results are shown in Table 9 and the August results in
Table 10. In August, Trump was tested against Sen. Kamala Harris rather
than Buttigieg.
Table 8: November General Election Matchups
| Matchup | Pct | Matchup | Pct | Matchup | Pct | Matchup | Pct |
| Biden | 44 | Sanders | 45 | Warren | 43 | Buttigieg | 39 |
| Trump | 47 | Trump | 48 | Trump | 48 | Trump | 47 |
| Neither | 5 | Neither | 5 | Neither | 4 | Neither | 6 |
| Don’t know | 2 | Don’t know | 2 | Don’t know | 4 | Don’t know | 7 |
Table 9: October General Election Matchups
| Matchup | Pct | Matchup | Pct | Matchup | Pct | Matchup | Pct |
| Biden | 50 | Sanders | 48 | Warren | 47 | Buttigieg | 43 |
| Trump | 44 | Trump | 46 | Trump | 46 | Trump | 45 |
| Neither | 3 | Neither | 4 | Neither | 4 | Neither | 5 |
| Don’t know | 3 | Don’t know | 2 | Don’t know | 2 | Don’t know | 7 |
Table 10: August General Election Matchups
| Matchup | Pct | Matchup | Pct | Matchup | Pct | Matchup | Pct |
| Biden | 51 | Sanders | 48 | Warren | 45 | Harris | 44 |
| Trump | 42 | Trump | 44 | Trump | 45 | Trump | 44 |
| Neither | 4 | Neither | 5 | Neither | 5 | Neither | 6 |
| Don’t know | 2 | Don’t know | 2 | Don’t know | 5 | Don’t know | 6 |
In the new poll, two additional general election matchups tested Trump against Sen. Amy Klobuchar and Sen. Cory Booker. Each of these was asked of half the polling sample, and they have a margin of error of 5.7 and 5.8 percent, respectively. While the half-samples were selected randomly, the half with Booker versus Trump has significantly more younger voters than the half with Klobuchar. Sanders also does better in the Booker half-sample, although no other candidates do significantly better in either half-sample.
Table 11: General Election Matches
| Match | Pct | Match | Pct |
| Klobuchar | 36 | Booker | 45 |
| Trump | 50 | Trump | 44 |
| Neither | 7 | Neither | 4 |
| Don’t know | 5 | Don’t know | 5 |
Vote by party identification, November vs. October
None of the shifts in vote preference between October and November reaches statistical significance. The shifts in the balance of the vote are largely due to slightly greater partisan loyalty among Republicans and slightly lower loyalty among Democrats. The party balance between October and November samples was unchanged, with 45 percent identifying themselves as Republican or leaning Republican and 44 percent identifying themselves as Democrat or leaning Democrat in each month.
Democratic presidential primary candidates
| Table 16: First and second choice in Democratic primary (among Democratic primary voters) | |||
| Response | First Choice | Second Choice | |
| Joe Biden | 30 | 15 | |
| Bernie Sanders | 17 | 18 | |
| Elizabeth Warren | 15 | 19 | |
| Pete Buttigieg | 13 | 10 | |
| Cory Booker | 3 | 3 | |
| Amy Klobuchar | 3 | 8 | |
| Kamala Harris | 2 | 4 | |
| Andrew Yang | 2 | 2 | |
| Tom Steyer | 1 | 1 | |
| Marianne Williamson | 1 | 0 | |
| Steve Bullock | 1 | 0 | |
| Michael Bennet | 0 | 0 | |
| Julián Castro | 0 | 0 | |
| John Delaney | 0 | 1 | |
| Someone else (VOL) | 1 | 1 | |
| Would not vote (VOL) | 1 | 0 | |
| Don’t know | 10 | 10 | |
| Refused | 1 | 1 |
Democratic presidential primary preference items were asked of those who said that they will vote in the Democratic primary in April. That sample size is 340, with a margin of error of +/-6.4 percentage points.
Among those who say they will vote in the Democratic primary, Biden receives the most support. Biden is the first choice of 30 percent, followed by Sanders at 17 percent, Warren at 15 percent, and Pete Buttigieg at 13 percent. Booker and Klobuchar receive 3 percent each. Harris and Yang are the top choices of 2 percent each, while all other candidates receive 1 percent or less.
The complete results for the Democratic primary are shown in Table 16.
Almost two-thirds of Democratic primary voters, 62 percent, say they might change their minds about their primary choice, while 37 percent say their mind is made up.
Table 17: Favorability ratings of six candidates among Democratic primary sample
| Favorable | Unfavorable | Haven’t heard enough | Don’t know | |
| Joe Biden | 67 | 20 | 6 | 6 |
| Bernie Sanders | 67 | 24 | 7 | 2 |
| Elizabeth Warren | 56 | 19 | 21 | 4 |
| Pete Buttigieg | 45 | 11 | 37 | 7 |
| Cory Booker | 36 | 14 | 39 | 11 |
| Amy Klobuchar | 27 | 16 | 45 | 12 |
Among the Democratic primary sample, favorability of candidates is shown in Table 17.
Trump job approval
Forty-seven percent of registered voters approve of the job Trump is doing as president, with 51 percent disapproving. That is little changed from October, when 46 percent approved and 51 percent disapproved.
Fifty-five percent of those polled approve of Trump’s handling of the economy, while 43 percent disapprove. In October, 51 percent approved and 45 percent disapproved.
Forty-four percent of those polled approve of Trump’s handling of foreign policy, while 52 percent disapprove. In October, 37 percent approved and 59 percent disapproved.
Thirty-seven percent say that Trump’s foreign policies have helped America’s standing in the world, while 53 percent say his policies have hurt the standing of the country.
Twenty percent say that the decision to remove most U.S. troops from Syria strengthens the United States, while 38 percent say this weakens the country and 34 percent say it doesn’t make much difference. An additional 8 percent say they don’t know.
Economic outlook and issues
Wisconsin registered voters hold a positive view of the recent performance of the economy, with 42 percent saying the economy has improved over the past year, 18 percent saying it has worsened, and 37 percent saying it has stayed the same. In October, 41 percent said the economy had improved, 20 percent said it had worsened, and 36 percent said it has stayed the same.
Looking ahead to the next year, 35 percent say the economy will improve, while 24 percent think it will get worse and 37 percent say it will remain the same. That reverses the more negative outlook in October, when 25 percent said the economy would improve, 30 percent said it would worsen, and 39 percent said it would remain the same.
Chronic wasting disease
Deer
hunters in Wisconsin are more aware than are non-hunters of chronic wasting
disease, which affects deer through much of the state.
Table 18: Awareness of CWD by hunter or non-hunter
| A lot | Some | Not much | Nothing at all | |
| Deer hunter | 59 | 30 | 7 | 3 |
| Not deer hunter | 25 | 36 | 20 | 16 |
A majority of hunters approve of the job the Department of Natural Resources is doing handling CWD. A plurality of non-hunters also approve, but non-hunters are more than twice as likely as hunters to say they don’t know how DNR is doing in addressing CWD.
Table 19: Approve DNR handling of CWD by hunter or non-hunter
| Approve | Disapprove | Don’t know | |
| Deer hunter | 56 | 29 | 15 |
| Not deer hunter | 45 | 16 | 38 |
Hunters and non-hunters alike see CWD as a threat to the future of deer hunting in Wisconsin.
Table 20: See CWD as threat to future of deer hunting by hunter or non-hunter
| Yes | No | Don’t know | |
| Deer hunter | 65 | 31 | 4 |
| Not deer hunter | 62 | 18 | 19 |
Opinion of the governor and legislature
Governor Tony Evers’ job approval stands at 47 percent, with disapproval at 42. Ten percent say they don’t have an opinion. In October, 52 percent approved, 34 percent disapproved, and 13 percent lacked an opinion.
Approval of the job the Wisconsin legislature is doing is 48 percent and disapproval is 39 percent, with 13 percent saying they don’t know. When last asked in August, 52 percent approved, 38 percent disapproved, and 8 percent lacked an opinion.
On Nov. 5, the state Senate voted to reject Evers’ nominee for secretary of the Department of Agriculture, Trade and Consumer Protection. Twenty-two percent say rejecting the nominee was the right thing for the Senate to do, 25 percent say it was the wrong thing to do, and 47 percent said they haven’t heard anything about this. An additional 6 percent say they don’t have an opinion.
Favorability rating of elected officials
Table 21
presents the favorability ratings of elected officials in Wisconsin and the
percentage of respondents who haven’t heard enough or say they don’t know.
Table 21: Favorability ratings of elected officials
| Favorable | Unfavorable | Haven’t heard enough | Don’t know | |
| Donald Trump | 46 | 50 | 2 | 1 |
| Tony Evers | 43 | 41 | 12 | 3 |
| Ron Johnson | 39 | 29 | 24 | 7 |
| Tammy Baldwin | 39 | 43 | 12 | 5 |
About the Marquette Law School Poll
The Marquette Law School Poll is the most extensive statewide polling project in Wisconsin history. This poll interviewed 801 registered Wisconsin voters by landline or cell phone, Nov. 13-17, 2019. The margin of error is +/-4.1 percentage points for the full sample.
The Democratic presidential candidate preference items were asked of Democrats, independents who lean Democratic, and independents who do not lean to either party. That sample size is 340 with a margin of error of +/-6.4 percentage points.
Two presidential matchup questions were asked of half-samples. Klobuchar vs. Trump was asked of 400 respondents, with a margin of error of +/- 5.7 percentage points. Booker vs. Trump was asked of 401 respondents, with a margin of error of +/- 5.8 percentage points.
The partisan makeup of the sample, including those who lean to a party, is 45 percent Republican, 44 percent Democratic, and 10 percent independent. The partisan makeup of the sample, excluding those who lean to a party, is 28 percent Republican, 28 percent Democratic, and 42 percent independent.
Since January 2017, the long-term partisan balance, including those who lean to a party, in the Marquette poll has been 45 percent Republican and 45 percent Democratic, with 9 percent independent. Partisanship, excluding those who lean, has been 30 percent Republican and 29 percent Democratic, with 40 percent independent.
The entire questionnaire, methodology statement, full results and breakdowns by demographic groups are available at law.marquette.edu/poll/results-and-data.