MILWAUKEE — A new Marquette Law School poll of Wisconsin likely voters finds support in the presidential race little changed since June, with Joe Biden favored by 49 percent and President Donald Trump by 44 percent. Six percent of voters say they will vote for neither, don’t know who they will vote for, or don’t want to give an opinion.
In June, among likely voters, Biden was supported by 50 percent and Trump by 44 percent, with 6 percent choosing neither. Biden had 49 percent in May and Trump 45 percent.
The new poll also found that, as COVID-19 cases have gone up in the state, the percent of voters who are concerned personally has increased. With strong partisan differences, voters overall favor requiring masks be worn in public, but opinion is almost evenly decided on whether children should go to school in person at the start of the new school year.
The poll was conducted Aug. 4-9, 2020. The sample included 801 registered voters in Wisconsin who were interviewed by cell phone or landline, with a margin of error of +/- 3.9 percentage points. There are 675 likely voters included in the poll, with a margin of error of +/- 4.2 percentage points.
There is little difference in polling among registered voters, with Biden receiving 48 percent and Trump receiving 42 percent. In June, among all registered voters, Biden was supported by 49 percent and Trump by 41 percent.
Enthusiasm for voting
Democrats and Republicans are almost equally likely to say they are certain to vote in November, with independents somewhat less so. About 87 percent of both Democrats and Republicans say they are certain to vote, while independents are 60 percent are certain to vote.
Respondents were also asked how enthusiastic they are about voting in November’s election. Among Democrats, 65 percent are very enthusiastic and 64 percent of Republicans are equally enthusiastic. Thirty-seven percent of independents say they are very enthusiastic about voting this fall.
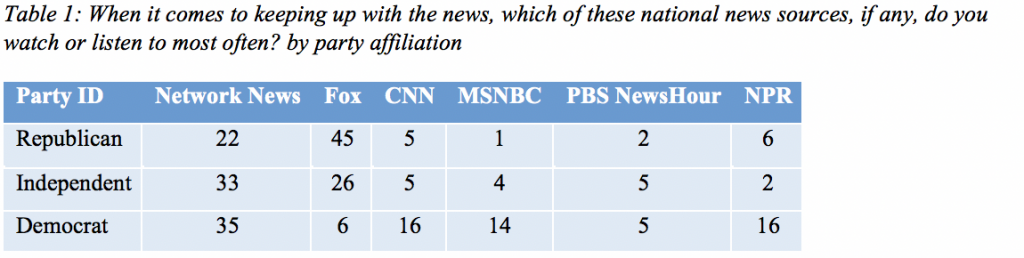
As for attention to politics and public affairs, 72 percent of Democrats say they follow what’s going on in politics most of the time, as do 71 percent of Republicans and 45 percent of independents.
There are sharp partisan differences in sources of national news, as shown in Table 1. Republicans are much more likely to rely on Fox News than are Democrats, who are more likely to get national news from CNN or MSNBC. Despite these differences, between one-fifth and about one-third of each partisan group still relies on broadcast network evening news.
Voting absentee by mail
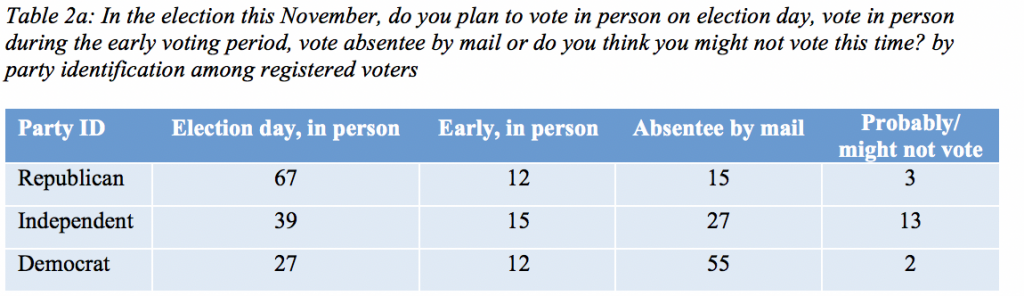
Among all registered voters, 35 percent say they plan to vote absentee by mail in November, while 46 percent say they will vote in-person on election day and 12 percent say they will vote early in-person. In May, 43 percent said they would vote absentee, 39 percent in person on election day, and 11 percent would vote early.
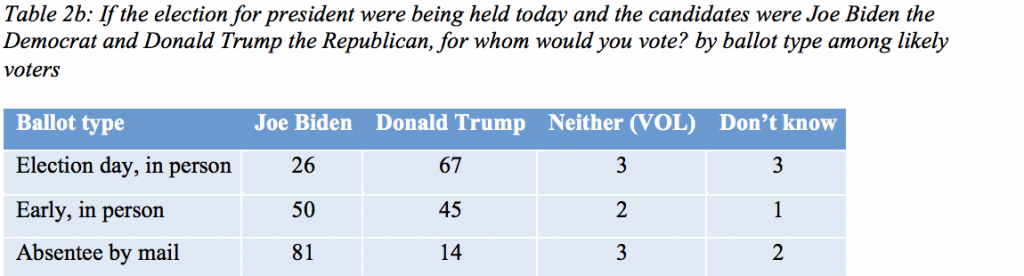
There are substantial partisan differences in plans to vote by mail or in-person as shown in Table 2a, with Democrats far more likely to vote by mail than Republicans, and Republicans far more likely to vote in-person on election day. Table 2b shows vote choice by type of ballot, reflecting the partisan differences in ballot choice.
Approval of Evers and coronavirus measures
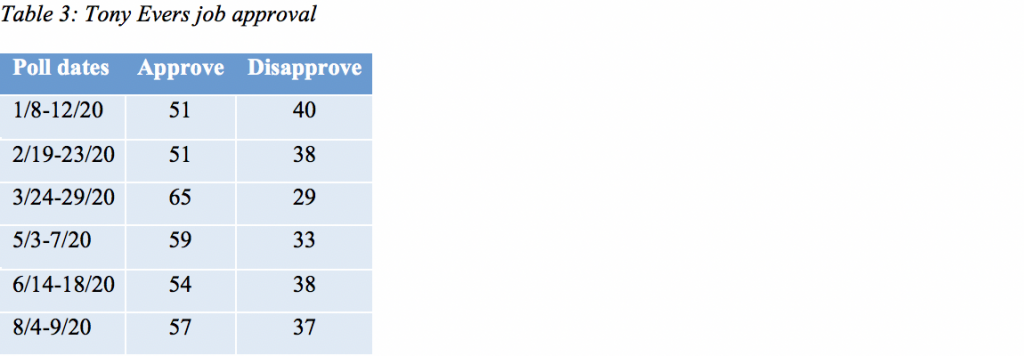
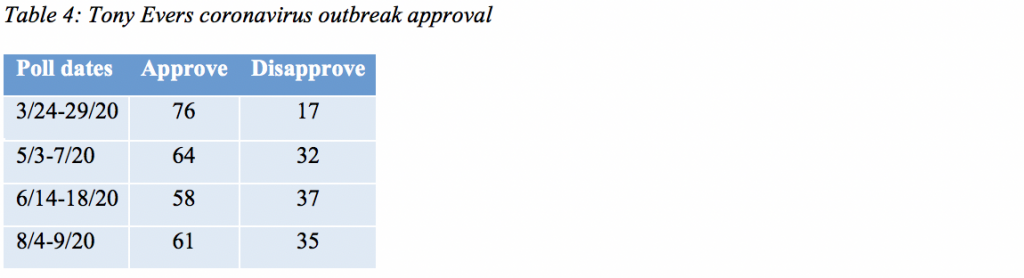
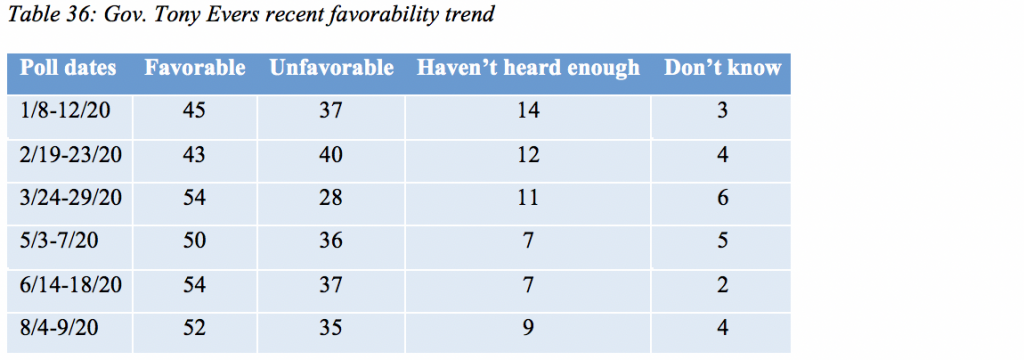
In August, 57 percent approve of Gov. Tony Evers’ handling of his job and 37 percent disapprove. In June, 54 percent approved and 38 percent disapproved. The trend in overall approval of Evers in 2020 is shown in Table 3.
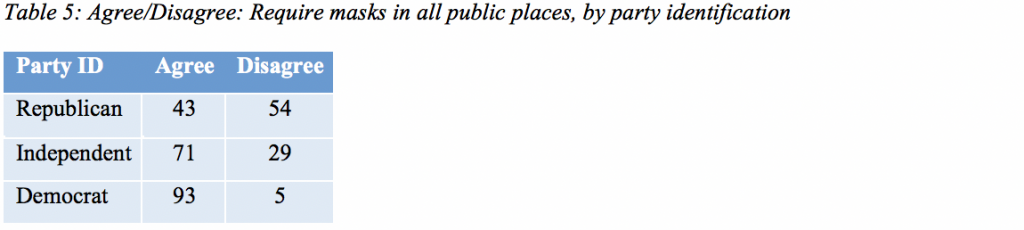
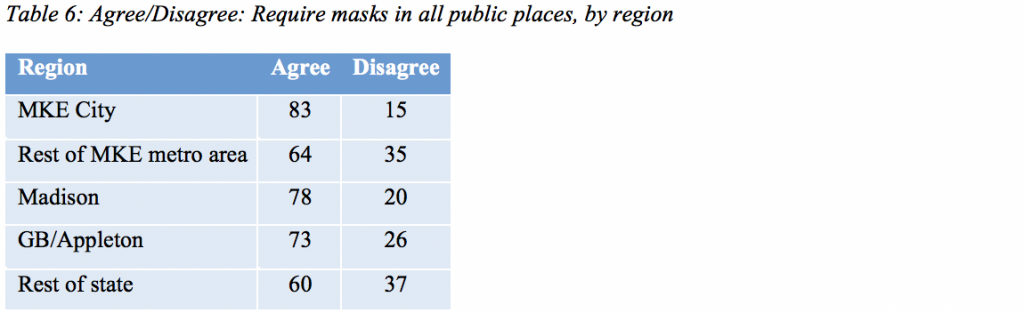
Sixty-nine percent agree that masks should be required in all public places, while 29 percent disagree. There are partisan and regional differences in views of masks as shown in Tables 5 and 6.
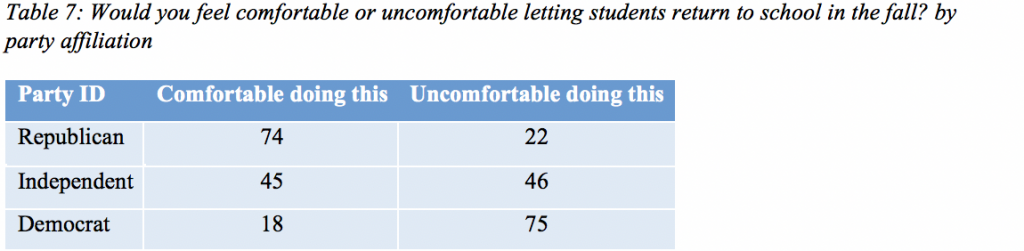
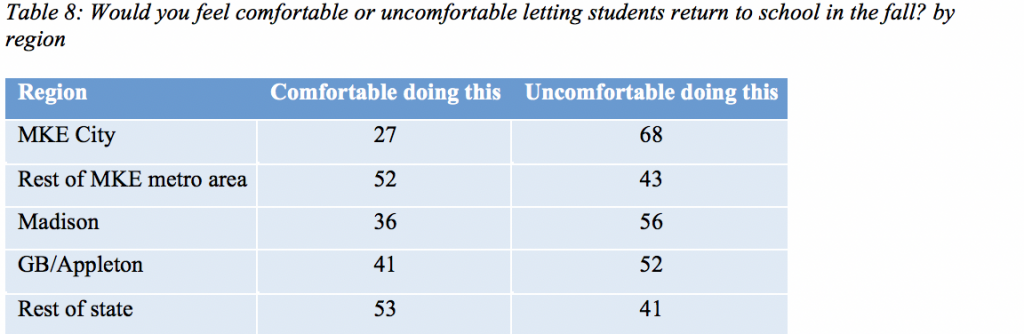
Forty-five percent say they feel comfortable letting students return to school in the fall and 48 percent say they are uncomfortable with reopening schools. Among those with school age children at home, 53 percent are comfortable and 45 percent are uncomfortable.
Comfort with reopening schools by party and region is shown in Tables 7 and 8.
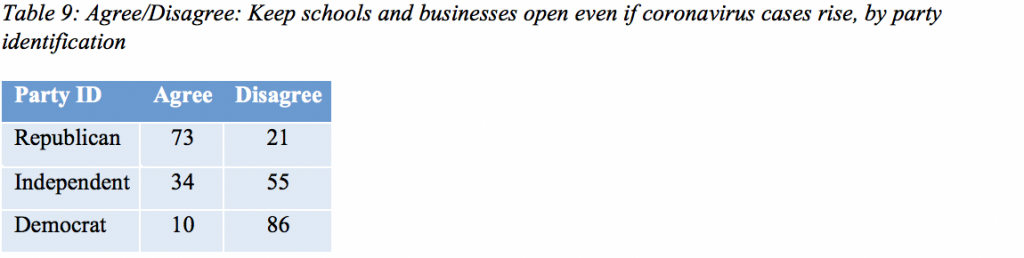
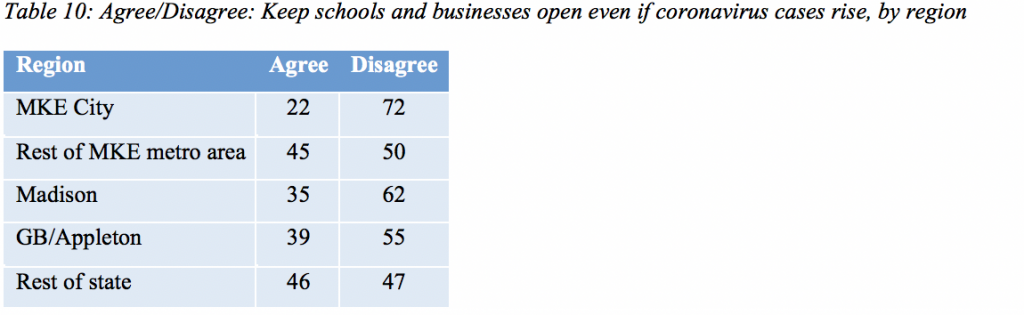
Forty percent agree that we should keep schools and businesses open even if coronavirus cases rise, while 54 percent disagree with this. Among those with school age children, 44 percent agree and 51 percent disagree that schools and businesses should stay open if cases increase. Partisan and regional differences on this question are shown in Table 9 and 10.
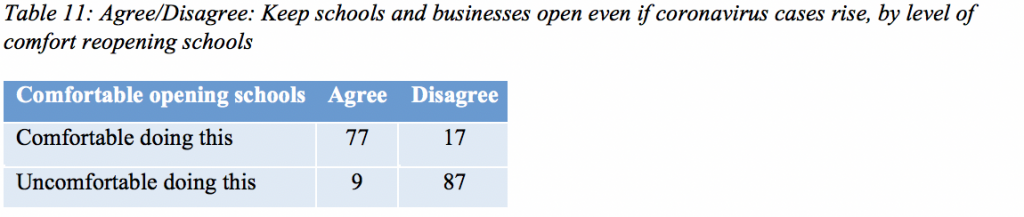
By a three-to-one margin, those comfortable returning students to school also think schools and businesses should stay open even if COVID-19 cases rise. Conversely, almost 90 percent of those who are uncomfortable reopening schools also oppose keeping schools and businesses open in the face of rising numbers of cases, as shown in Table 11.
Trump approval
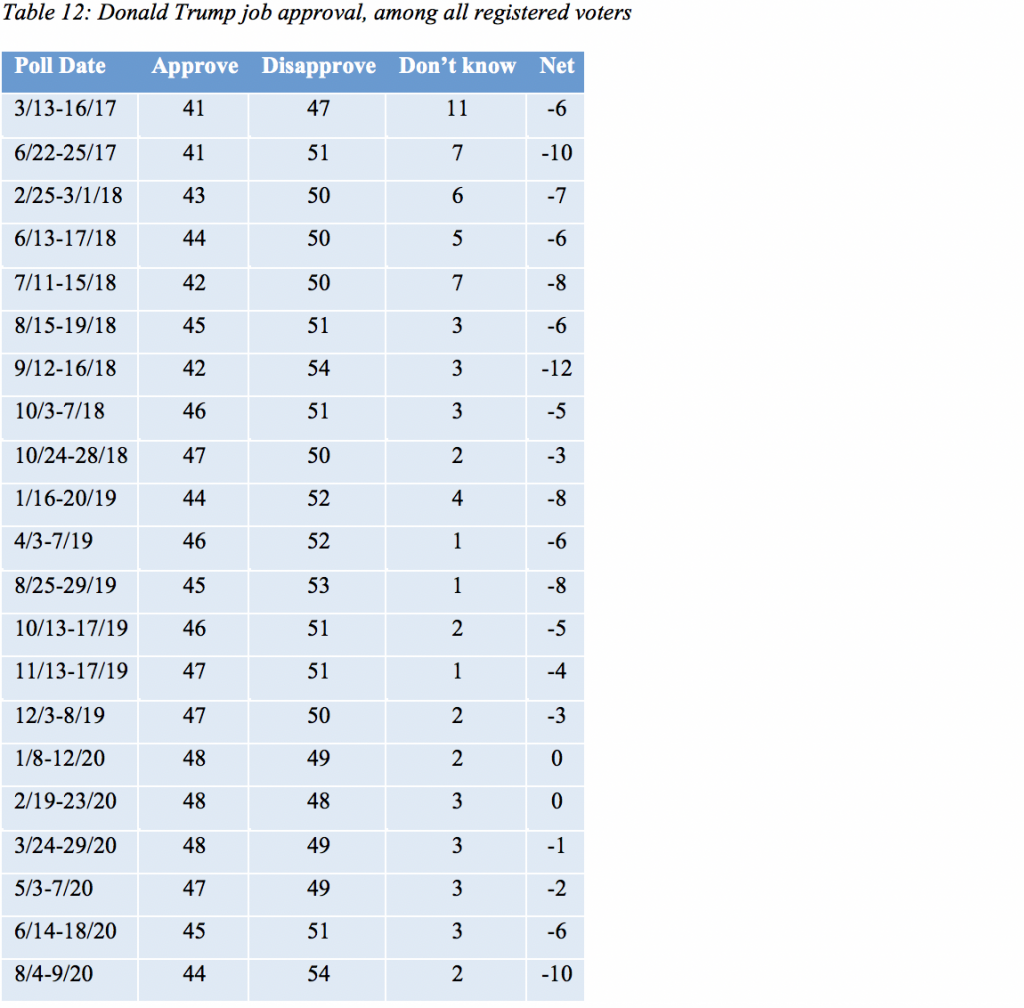
In August, Trump’s overall job approval declined to 44 percent, with 54 percent disapproving. In June, 45 percent approved and 51 percent disapproved. His job approval since taking office is shown in Table 12. Trump’s approval was last this low in January 2019 when approval was 44 percent and disapproval was 52 percent.
Approval of Trump’s handling of specific issues varies considerably, despite the narrow range of his overall approval ratings during his presidency.
Approval is lowest for Trump’s handling of protests over the death of George Floyd in police custody. Thirty-two percent approve of Trump’s handing of the protests and 58 percent disapprove. In June, 30 percent approved and 58 percent disapproved.
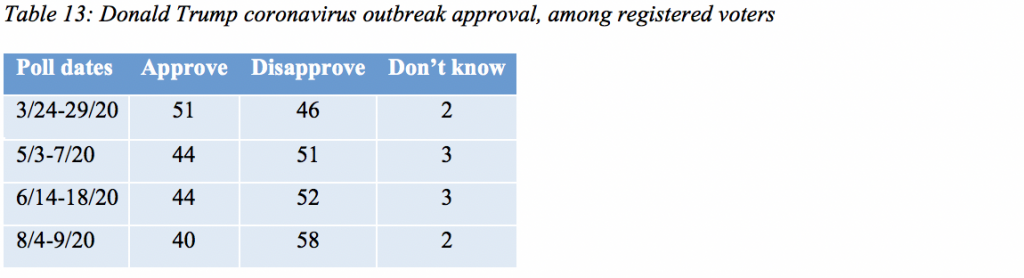
Approval of Trump’s handing of the coronavirus outbreak is 40 percent and disapproval is 58 percent, with 2 percent who don’t know. In June, 44 percent approved and 52 percent disapproved.
The trend in approval of Trump’s handling of the coronavirus outbreak is shown in Table 13.
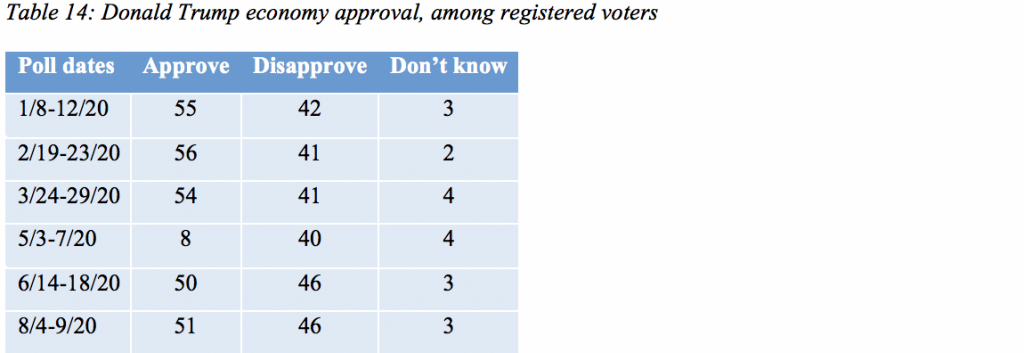
Trump receives the strongest support for his handling of the economy, with 51 percent approval and 46 percent disapproval, and 3 percent who don’t know. In June, 50 percent approved and 46 percent disapproved. The full trend during 2020 is shown in Table 14.
Views of the candidates
Thirty-six percent say Trump generally shows good judgment, while 61 percent say he does not. Forty-five percent say Biden generally shows good judgment and 46 percent say he does not.
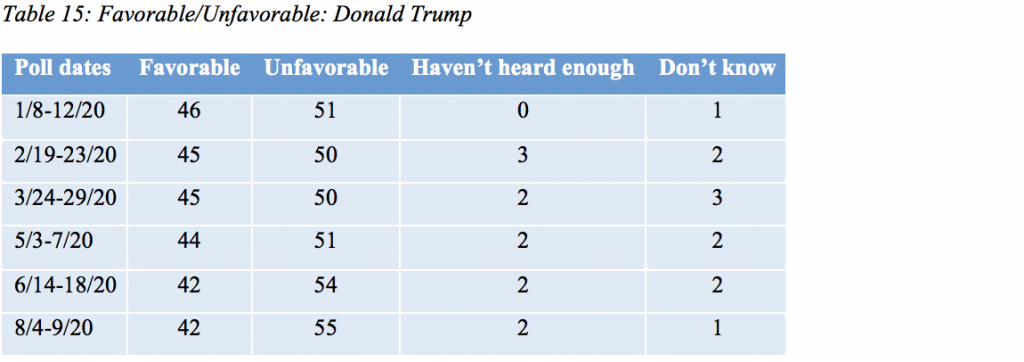
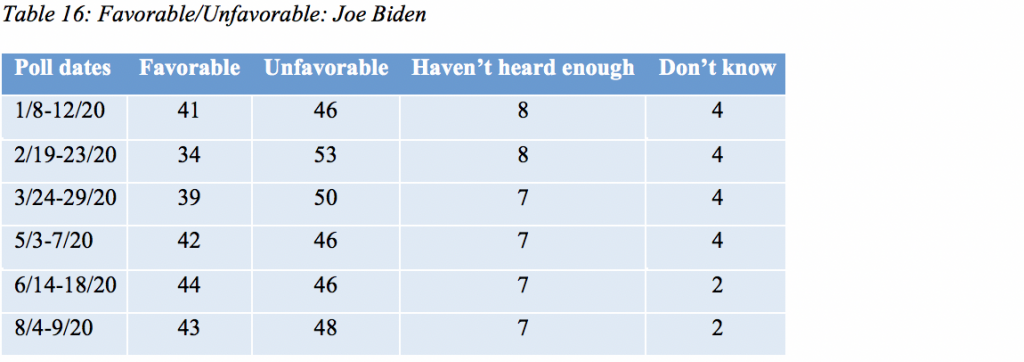
Trump is viewed favorably by 42 percent and unfavorably by 55 percent, while Biden is seen favorably by 43 percent and unfavorably by 48 percent. The trends in favorability for each candidate are shown in Tables 15 and 16.
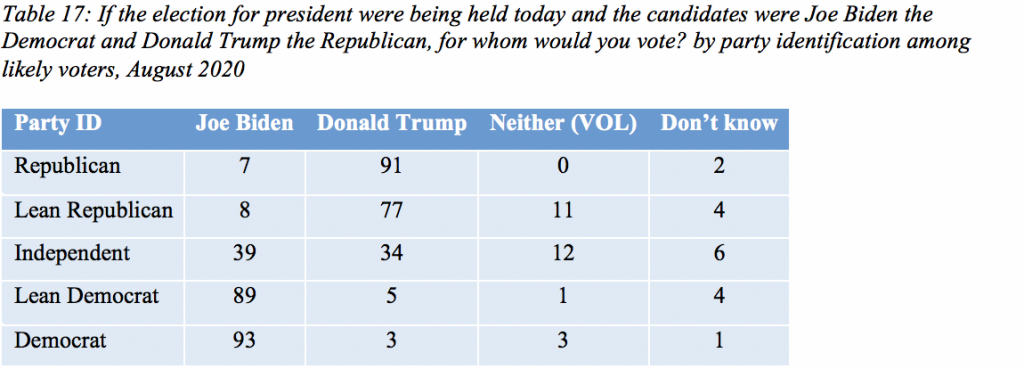
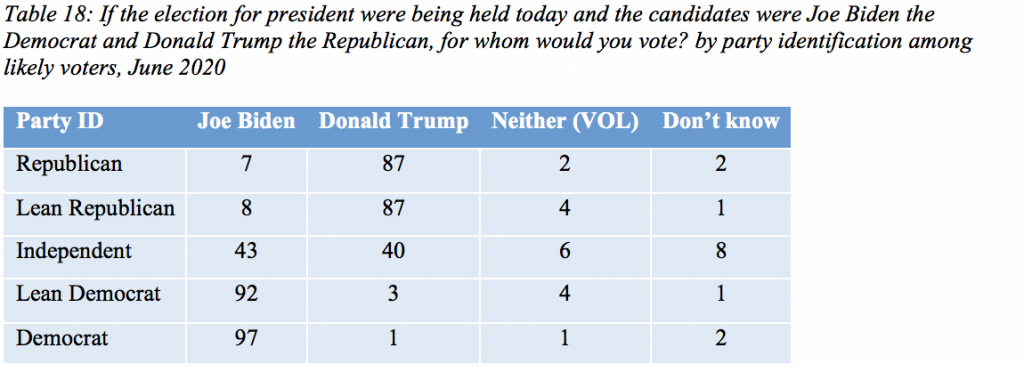
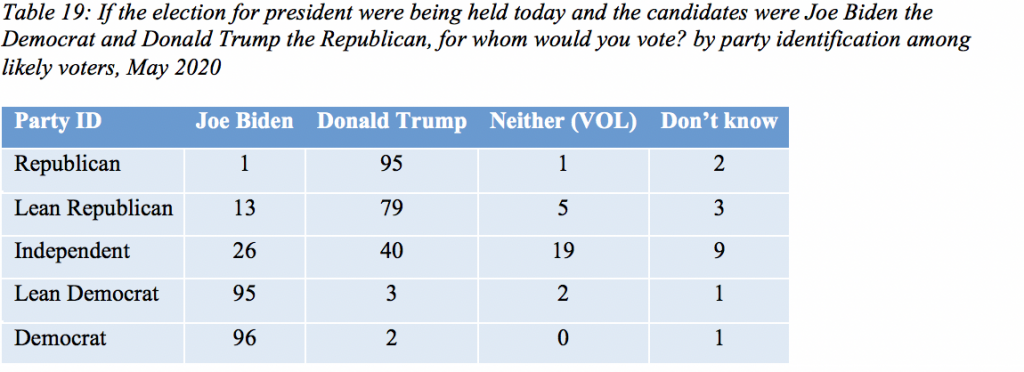
Vote by party ID in June and August
Partisan loyalty has varied from May to June and August among likely voters, as shown in Tables 17-19. Democratic and Republican unity has fluctuated but remained near 90 percent or above for both parties. Independents have narrowly divided preferences, favoring Biden in June and August, but with a substantial percentage not choosing either major party candidate.
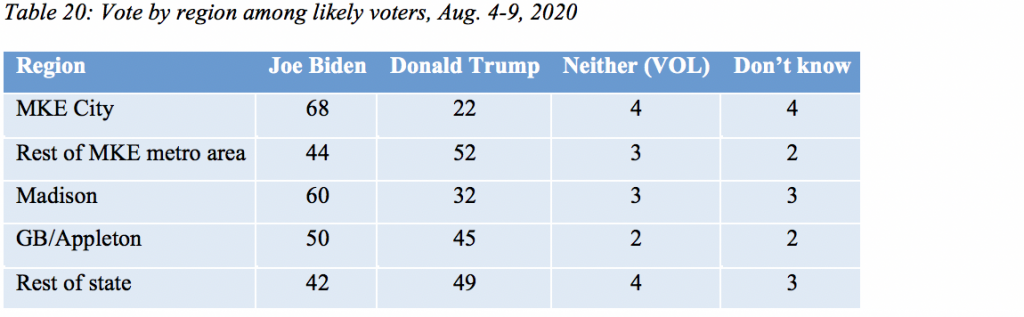
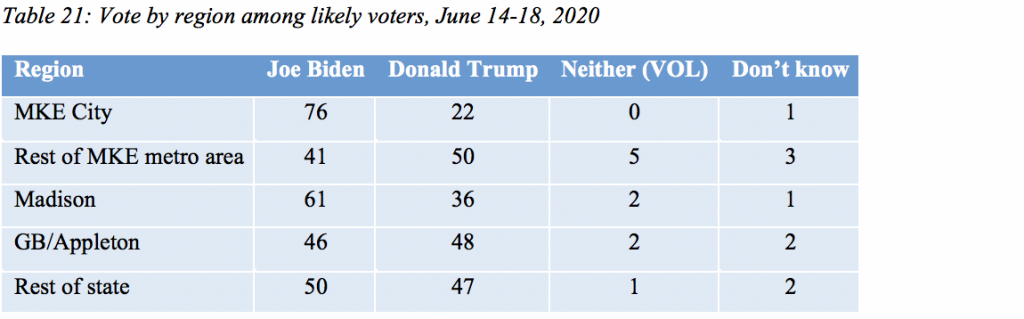
Vote by region
Regional support for each candidate has been relatively stable between June and August, as shown in Tables 20 and 21. Biden holds leads in the City of Milwaukee and the Madison media market. Trump leads in the Milwaukee area outside the city. The race is very close in the Green Bay area and in the rest of the state, with Trump regaining the lead in the north and west of the state in August.
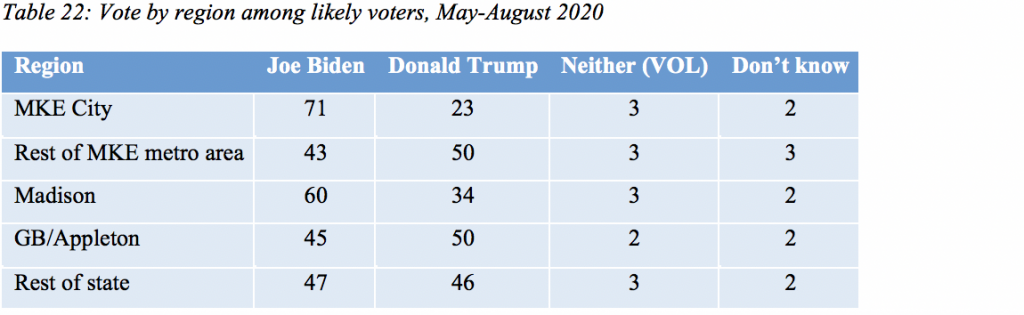
Table 22 shows vote by region combining the last three polls, from May through August in order to increase the sample size in each region and average over month-to-month variation.
Views of protests
Forty-eight percent of Wisconsin registered voters approve of the mass protests since the death of George Floyd, while 48 percent disapprove. That is a drop in approval from June, when 61 percent approved and 36 percent disapproved.
In August, 48 percent said the protests had been mostly peaceful, while 41 percent said they had been mostly violent. This question was not asked in June.
Forty-nine percent had a favorable view of the Black Lives Matter movement and 37 percent had an unfavorable view. In June, 59 percent had a favorable and 27 percent an unfavorable view of the movement.
Police are viewed favorably by 76 percent and unfavorably by 13 percent. In June, 72 percent had a favorable and 18 percent had an unfavorable view of the police.
Coronavirus epidemic and impact
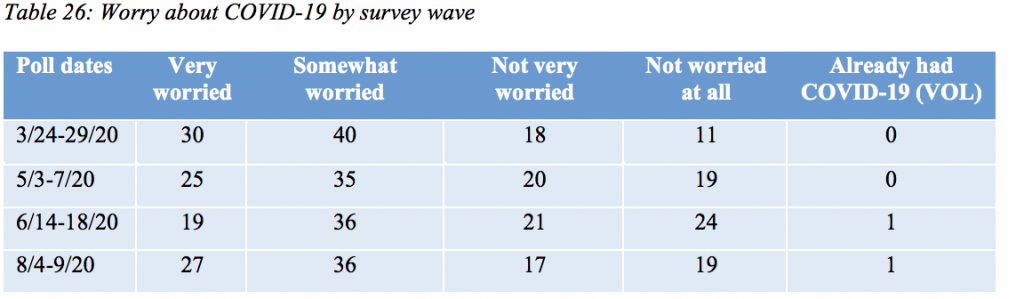
The percentage of those very worried about personal risk from COVID-19 increased by eight points in August, after declining each previous month since March. Twenty-seven percent say they are very worried and 36 percent are somewhat worried, while 17 percent are not very worried and 19 percent say they are not at all worried. The full trend since March is shown in Table 26.
Economic impact of the coronavirus
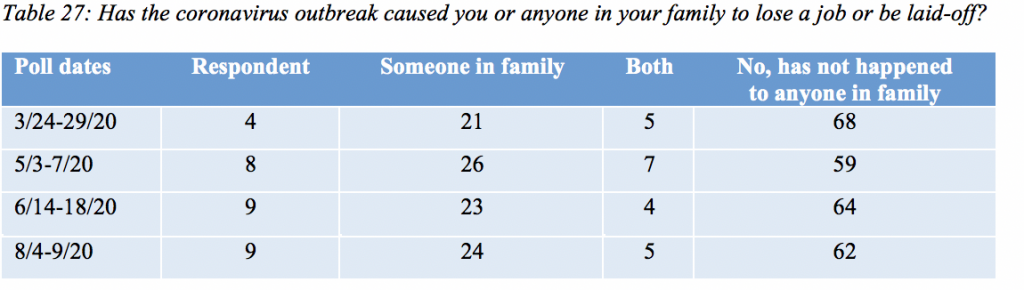
Reported job loss held steady in August, with 14 percent saying they have lost a job. Twenty-nine percent say someone in their family, other than themselves, has suffered a job loss. Table 27 shows the trend in job loss.
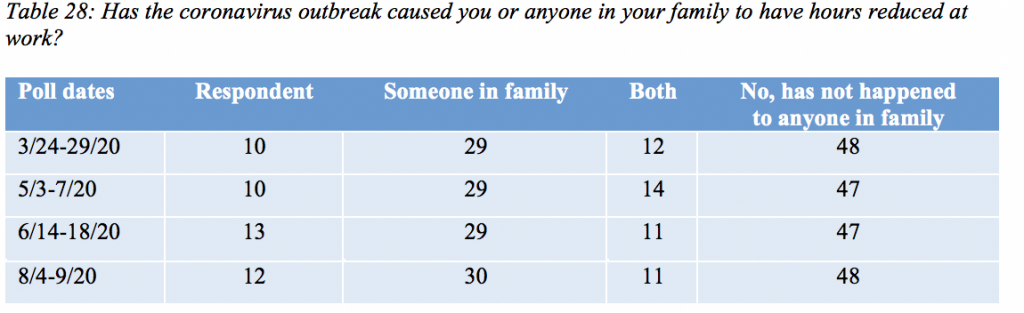
Work hours have been reduced for 23 percent of respondents. Forty-one percent say some other family member has had work hours reduced. These results are little changed from June. The full trend is shown in Table 28.
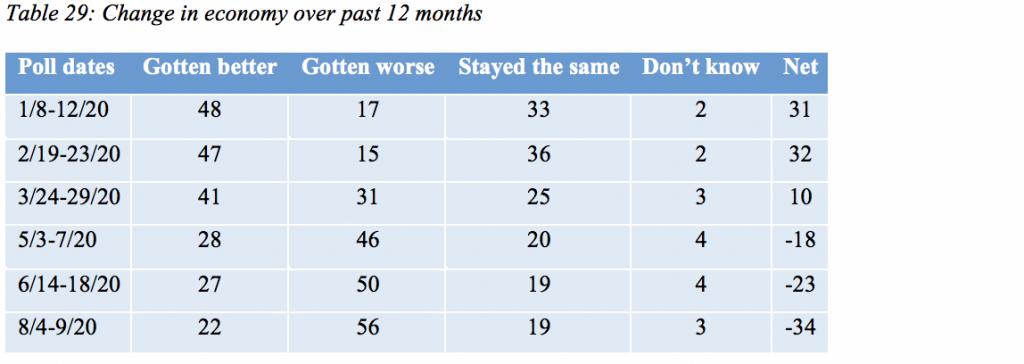
Views of the direction of the economy have turned sharply down since February, with many more people saying the economy has gotten worse over the past year.
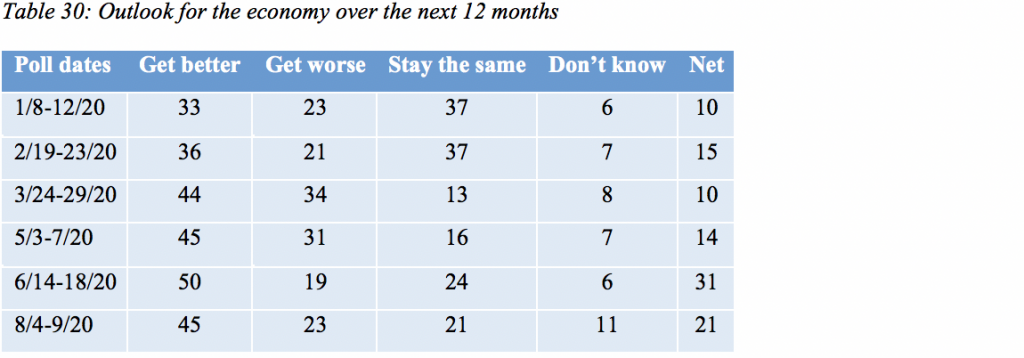
Respondents have a positive outlook for the economy over the next 12 months, though a bit less so in August than in June. Tables 29 and 30 show the recent trends in these measures.
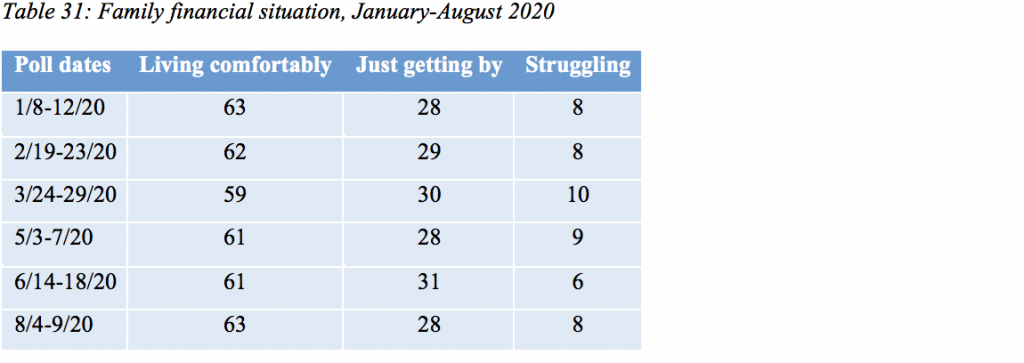
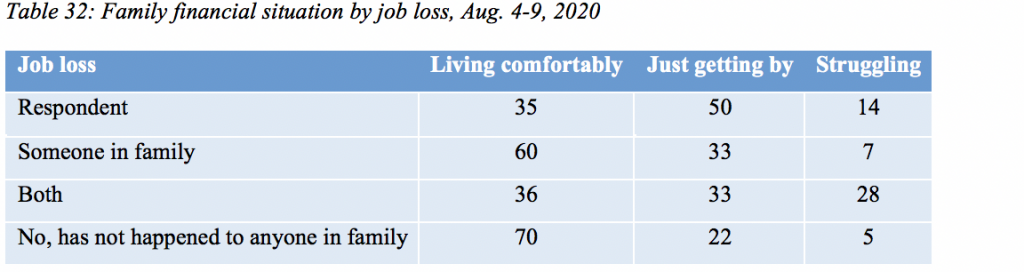
While many respondents have lost jobs or had working hours cut, there has not been a surge in reports of financial distress. However, those who have lost jobs or had family members lose jobs report substantially higher levels of financial insecurity as shown in Tables 31 and 32.
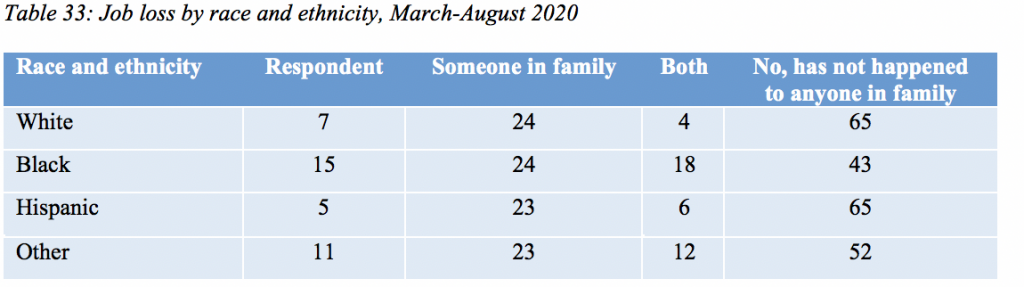
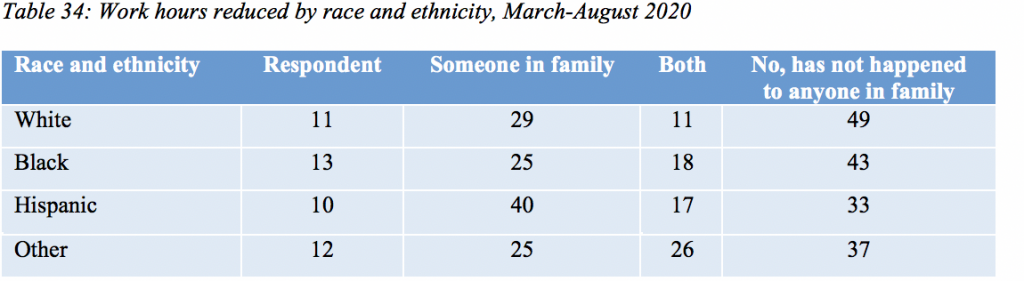
Black respondents have been especially hard hit by the economic consequences of the pandemic. Combining all polls from March through August, Tables 33 and 34 shows job loss and work hours reduced by race.
Issues
While the coronavirus epidemic, the economy and Black Lives Matter protests have occupied the headlines, a number of other issues remain important. Table 35 shows these issues, all posed as statements of possible policies the respondent could agree or disagree with.
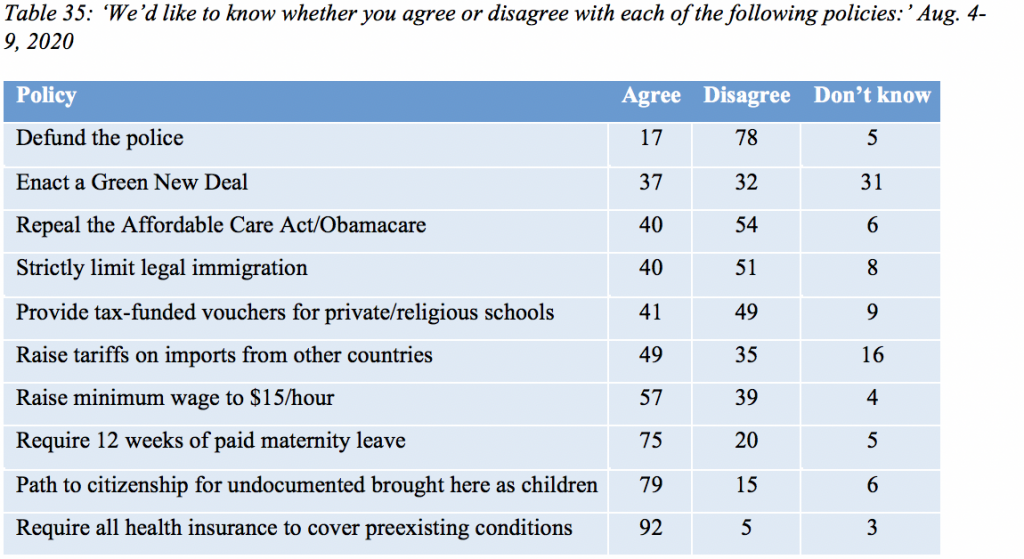
Defunding the police draws the highest opposition, 17 percent in favor and 78 percent opposed, while requiring all insurance to cover preexisting conditions has the highest support, 92 percent to 5 percent. Three in four registered voters also support 12 weeks of paid maternity leave and a path to citizenship for those undocumented immigrants brought to the US as children.
The Green New Deal is supported by 37 percent and opposed by 32 percent, but almost a third, 31 percent, say they don’t have an opinion of it.
A majority oppose repealing the Affordable Care Act, or Obamacare, and a similar majority oppose limiting legal immigration.
Providing tax-funded vouchers for private and religious schools is supported by 41 percent and opposed by 49 percent.
More agree that we should raise tariffs on imports, 49 percent, than disagree, 35 percent, though a substantial 16 percent say they don’t know, despite the frequent debates over tariffs during the current administration.
Views of state officials
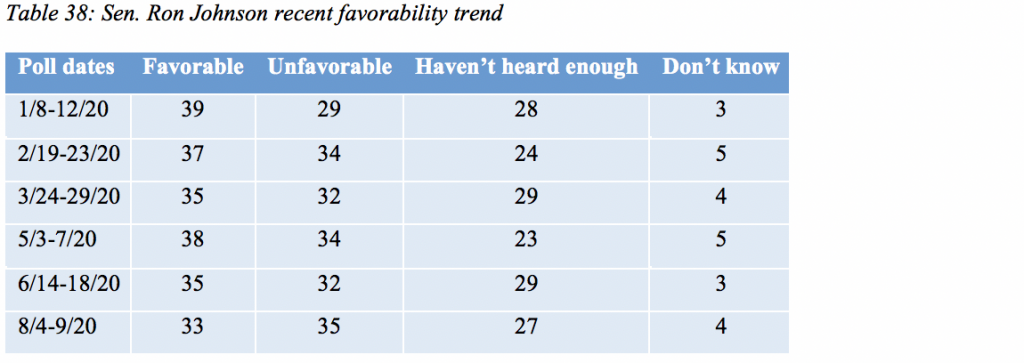
Tables 36-38 presents the recent favorability ratings of elected officials in Wisconsin and the percentage of respondents who haven’t heard enough or say they don’t know.

About the Marquette Law School Poll
The Marquette Law School Poll is the most extensive statewide polling project in Wisconsin history. This poll interviewed 801 registered Wisconsin voters by landline or cell phone from Aug. 4-9, 2020. The margin of error is +/-3.9 percentage points for the full sample. There are 675 likely voters, with a margin of error of +/- 4.2 percentage points, in the weighted sample reported in all results, and 694 unweighted.
The partisan makeup of the sample, including those who lean to a party, is 45 percent Republican, 45 percent Democratic, and 9 percent independent. The partisan makeup of the sample, excluding those who lean to a party, is 30 percent Republican, 29 percent Democratic, and 40 percent independent.
Since January 2017, the long-term partisan balance, including those who lean to a party, in the Marquette poll has been 45 percent Republican and 45 percent Democratic, with 9 percent independent. Partisanship exuding those who lean has been 30 percent Republican and 29 percent Democratic, with 40 percent independent.
The entire questionnaire, methodology statement, full results and breakdowns by demographic groups are available at law.marquette.edu/poll/results-and-data.