
Adults born before 1960 are the most trustful of other people, while those born in 2000s are most distrustful
Also:
- Interpersonal trust is not correlated to social media use among any age group
- Younger cohorts are less trusting of people in general and of some types of people
- Trust is higher among those with ongoing relationships, lower where others’ motives are unclear
- Electronic communications top the list of how people interact
- Many turn to their phone rather than speak to people
- A substantial percentage report they say “hi” and start conversations with strangers
- Dating is not dead
MILWAUKEE — A new Marquette Law School Poll national survey finds that there is a dramatic decline in the level of trust of people by age groupings, with people born before 1960 the most trusting and each subsequent grouping by age less trustful than the one before. The trend culminates with those born in the 2000s, who are the least trusting.
In the late 1950s and early 1960s, Johnny Carson, paired with Ed McMahon, hosted the TV game show “Who Do You Trust?” Aside from uniting the legendary late-night duo, the title poses a question as relevant today as it was then. Society rests on connections between people, and trust is one vital element in social bonds of cooperation, business, friendship, and family. In 2026 America, 64 years after Carson and McMahon moved to “The Tonight Show,” whom do Americans trust and how much trust do we have in each other?
The Marquette Law School Poll national survey has dived into the question of trust in the age of cell phones, the internet, social media and dating apps—long past the age of black and white television.
In four polls conducted with 4,500 respondents in 2026, 77% of those born before 1960 say most people can be trusted, a markedly high level of interpersonal trust. Contrast that with those born in the 2000s, among whom only 35% say most people can be trusted. This dramatic difference is no fluke. Trust steadily declines according to age cohort, as shown in Figure 1, with the numerical data shown in Table 1. (All results in the tables are stated as percentages).
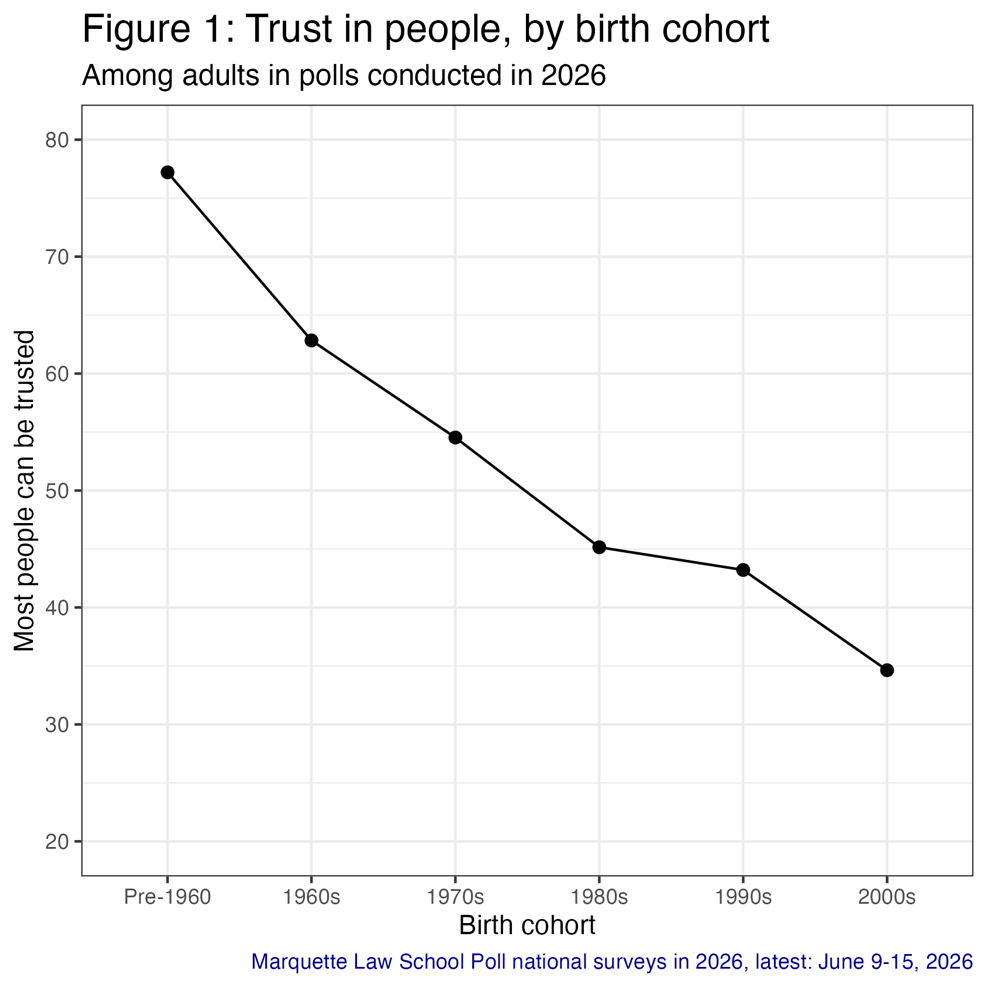
Table 1: Trust in people, by birth cohort
Among adults in polls conducted in 2026
| Birth Cohort | Trust | |
| Most people can be trusted | Most people can’t be trusted | |
| Pre-1960 | 77 | 23 |
| 1960s | 63 | 37 |
| 1970s | 55 | 45 |
| 1980s | 45 | 55 |
| 1990s | 43 | 57 |
| 2000s | 35 | 65 |
| Marquette Law School Poll national surveys in 2026, latest: June 9-15, 2026 | ||
| Question: Generally speaking, would you say that most people can be trusted, or most people can’t be trusted? | ||
There has been relatively little change in overall trust in Marquette Law School polling since 2021, with trust ranging from 51% to 55%, as shown in Table 2.
Table 2: Trust in people, by year
Among adults
| Year | Trust | |
| Most people can be trusted | Most people can’t be trusted | |
| 2021 | 55 | 45 |
| 2022 | 55 | 45 |
| 2023 | 54 | 46 |
| 2024 | 52 | 48 |
| 2025 | 51 | 49 |
| 2026 | 54 | 46 |
| Marquette Law School Poll national surveys, latest: June 9-15, 2026 | ||
| Question: Generally speaking, would you say that most people can be trusted, or most people can’t be trusted? | ||
While there has been little change in overall trust, the youngest birth cohort has shown a notable increase in trust. Trust among those born in the 2000s increased from 23% in 2021 to 35% in 2026.
Each cohort shows at least some increase in trust from 2025 to 2026, and the 1990s cohort has increased in trust during each of the past three years. None of these shifts has changed the relative ordering of cohorts by level of trust, and only the two youngest cohorts have moved up consistently in the last several years. Despite the recent rise among the youngest cohort (those born in the 2000s), their level of trust has not risen to match that of their predecessor, the cohort born in the 1990s. No younger cohort, as of 2026, has trust as high as their predecessor, although those born in the 1980s and 1990s are close to each other. The trends for cohorts by year are shown in Figure 2, with numerical results shown in Table 3.
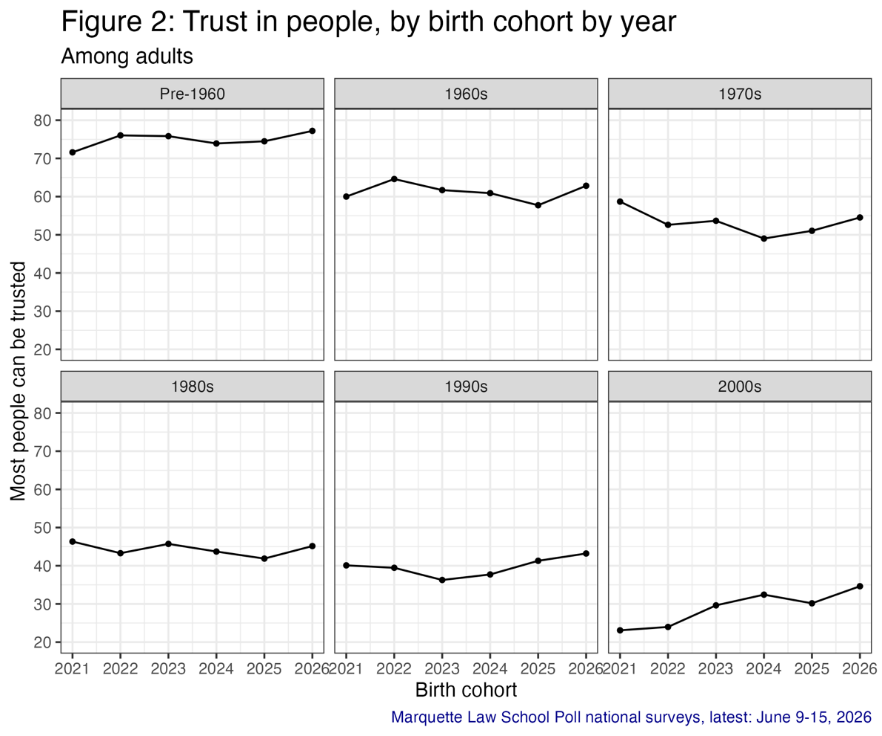
Table 3: Trust in people, by birth cohort by year
Among adults
| Year Trust Most people can be trusted Most people can’t be trusted Pre-1960 2021 72 28 2022 76 24 2023 76 24 2024 74 26 2025 74 26 2026 77 23 1960s 2021 60 40 2022 65 35 2023 62 38 2024 61 39 2025 58 42 2026 63 37 1970s 2021 59 41 2022 53 47 2023 54 46 2024 49 51 2025 51 49 2026 55 45 | Year Trust Most people can be trusted Most people can’t be trusted 1980s 2021 46 54 2022 43 57 2023 46 54 2024 44 56 2025 42 58 2026 45 55 1990s 2021 40 60 2022 39 60 2023 36 64 2024 38 62 2025 41 59 2026 43 57 2000s 2021 23 77 2022 24 76 2023 30 70 2024 32 68 2025 30 70 2026 35 65 |
| Marquette Law School Poll national surveys, latest: June 9-15, 2026 Question: Generally speaking, would you say that most people can be trusted, or most people can’t be trusted? | |
It is tempting to reach for a handy explanation for the decline in trust, but the fact that trust has declined with each new cohort makes recent changes, such as the growth of social media, not generally persuasive. It is true that heavy users of social media are less trusting, and they are also younger and so a larger proportion of more recent birth cohorts. In 2026, among those who used one social media platform or none, 59% say most people can be trusted, while among those who use five or more social media platforms, 46% say most people can be trusted. This is a significant gap but far smaller than the gap between the oldest and youngest birth cohorts.
It is also true that the young are much heavier users of social media. Only 6% of the oldest cohort use five or more social media platforms, while 32% of the youngest cohort use that many. At the other end of the scale, 41% of the oldest cohort use one or no social media apps, while just 15% of the 2000s cohort use so little. Is it birth cohort or social media use that plays the dominant role in trust?
A closer look at trust by social media use within each birth cohort finds that there is little consistent effect of social media use within each cohort. Members of the oldest cohort are the most trusting on average no matter how much social media they consume. The youngest cohort is the least trusting, regardless of social media immersion. The modest variation within each cohort is inconsistent rather than showing clear trends across social media use; this is shown in Figure 3, with data in Table 4.
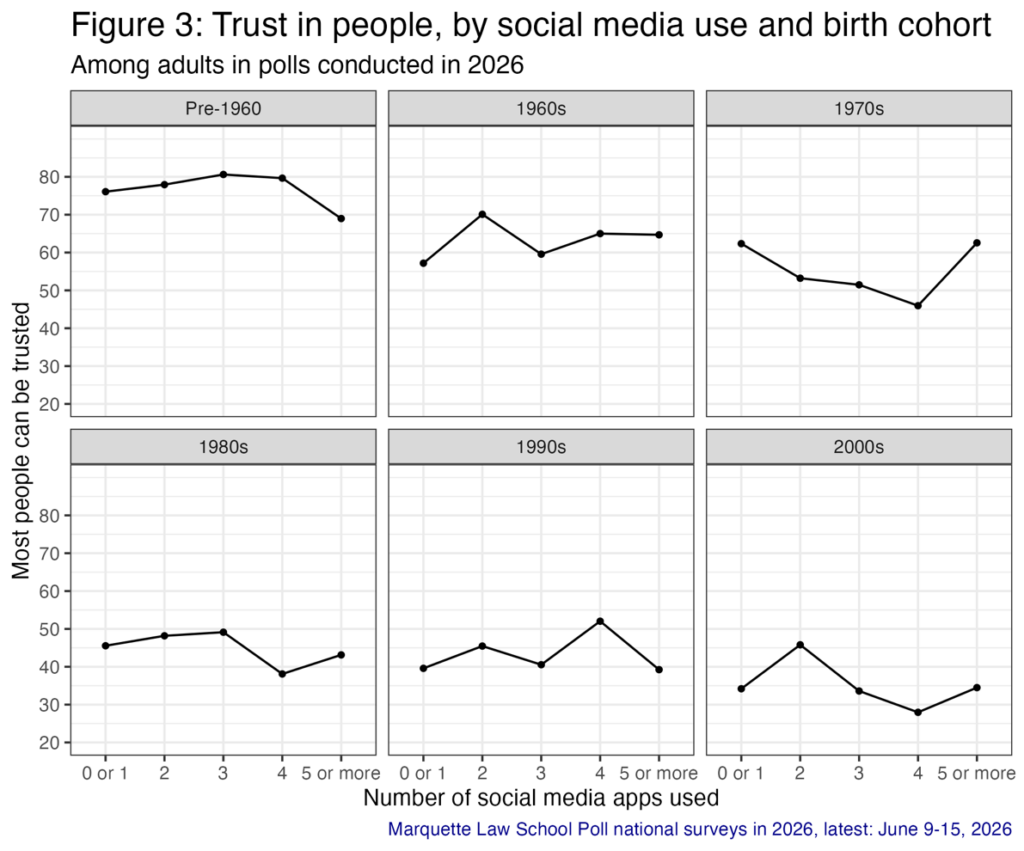
Table 4: Trust in people, by social media use and birth cohort
Among adults in polls conducted in 2026
| Social media use Trust Most people can be trusted Most people can’t be trusted Pre-1960 0 or 1 76 24 2 78 22 3 81 19 4 80 20 5 or more 69 31 1960s 0 or 1 57 42 2 70 30 3 60 40 4 65 35 5 or more 65 35 1970s 0 or 1 62 38 2 53 47 3 51 49 4 46 54 5 or more 63 37 | Social media use Trust Most people can be trusted Most people can’t be trusted 1980s 0 or 1 46 54 2 48 52 3 49 51 4 38 62 5 or more 43 57 1990s 0 or 1 40 60 2 45 55 3 41 59 4 52 48 5 or more 39 61 2000s 0 or 1 34 66 2 46 54 3 34 66 4 28 72 5 or more 34 66 |
| Question: Which of the following sites or apps, if any, have you used in the past week? Question: Generally speaking, would you say that most people can be trusted, or most people can’t be trusted? | |
The interpersonal trust gap between the old and the young carries over to more specific questions about trust in people. Among all adults in June 2026, 59% say most people would “try to take advantage of you if they got a chance,” while 41% think most would “try to be fair.” A majority of each cohort except those born before 1960 think most people would try to take advantage, and that majority grows with each younger cohort, as shown in Table 5.
Table 5: Most people would take advantage, by birth cohort
Among adults
| Birth Cohort | Trust government | |
| Would try to take advantage of you if they got a chance | Would try to be fair to you no matter what | |
| Pre-1960 | 40 | 60 |
| 1960s | 55 | 45 |
| 1970s | 58 | 42 |
| 1980s | 61 | 39 |
| 1990s | 70 | 30 |
| 2000s | 72 | 28 |
| Marquette Law School Poll national survey, June 9-15, 2026 | ||
| Question: Do you think most people (would try to take advantage of you if they got a chance) or (would try to be fair to you no matter what)? | ||
The public is even more inclined to say people just look out for themselves, 64%, rather than saying people try to help others, 36%. Only a small majority of the pre-1960 cohort think people try to help others, and the majority saying people look out for themselves grows to 76% in the youngest cohort, as shown in Table 6.
Table 6: Most people just look out for themselves, by birth cohort
Among adults
| Birth Cohort | Help others or look out for themselves | |
| Try to help others | Just look out for themselves | |
| Pre-1960 | 53 | 47 |
| 1960s | 45 | 55 |
| 1970s | 35 | 65 |
| 1980s | 30 | 70 |
| 1990s | 27 | 73 |
| 2000s | 24 | 76 |
| Marquette Law School Poll national survey, June 9-15, 2026 | ||
| Question: Would you say that most of the time people (try to help others) or (just look out for themselves)? | ||
Despite these majorities who doubt others, a majority of adults say they begin with a presumption of trustworthiness until a person proves otherwise (59%), rather than beginning by not trusting people until they prove they can be trusted (41%). On this question, the majority for a presumption of trust shrinks from the pre-1960s cohort to that of the 1980s, then becomes a minority view among those born in the 1990s and 2000s, as shown in Table 7.
Table 7: Trust until proven untrustworthy, by birth cohort
Among adults
| Birth Cohort | Trust first or not trust first | |
| Trust people until they prove untrustworthy | Not trust people until they prove they can be trusted | |
| Pre-1960 | 73 | 27 |
| 1960s | 66 | 34 |
| 1970s | 63 | 37 |
| 1980s | 56 | 44 |
| 1990s | 49 | 51 |
| 2000s | 43 | 57 |
| Marquette Law School Poll national survey, June 9-15, 2026 | ||
| Question: Is it better to (trust people until they prove untrustworthy), or to (not trust people until they prove they can be trusted)? | ||
One area in which the old and the young see trust the same way is that all agree that Americans’ level of trust in one another has been shrinking. Among all adults, 82% say trust is declining, just 5% say it has been growing, and 13% say it is staying about the same. Although the older cohorts have longer experience to inform their answers, there is hardly any difference across cohorts in views of this aspect of trust, as shown in Table 8.
Table 8: Trust growing or shrinking, by birth cohort
Among adults
| Birth Cohort | Trust growing or shrinking | ||
| Growing | Shrinking | Staying about the same | |
| Pre-1960 | 2 | 85 | 13 |
| 1960s | 4 | 83 | 13 |
| 1970s | 6 | 77 | 17 |
| 1980s | 3 | 83 | 14 |
| 1990s | 6 | 82 | 12 |
| 2000s | 11 | 82 | 7 |
| Marquette Law School Poll national survey, June 9-15, 2026 | |||
| Question: Would you say Americans’ level of trust in one another has been (growing) or (shrinking) or staying about the same? | |||
The sharp difference in interpersonal trust across cohorts is not generic to all measures of trust. In contrast with the large differences in trust in other people, there are only modest differences in trust in the federal government across birth cohorts. The high measure of trust is 3 points higher among the oldest than the youngest cohort, while the percentage saying they never trust the government is some 13 points higher among the young. The majority of each age cohort say they can trust the government only some of the time, as shown in Table 9.
Table 9: Trust the federal government, by birth cohort
Among adults in polls conducted in 2026
| Birth Cohort | Trust government | ||
| Always/most of the time | Only some of the time | Never | |
| Pre-1960 | 22 | 66 | 12 |
| 1960s | 23 | 60 | 17 |
| 1970s | 22 | 58 | 20 |
| 1980s | 19 | 58 | 23 |
| 1990s | 16 | 61 | 23 |
| 2000s | 19 | 56 | 25 |
| Marquette Law School Poll national surveys, latest: June 9-15, 2026 | |||
| Question: How much of the time do you think you can trust the government in Washington to do what is right? | |||
Trust in specific types of people
While generalized trust was low on most questions above, there is large variation in trust in specific types of people. Trust is higher in people with whom we have an ongoing relationship, and highest in family and coworkers. Trust is lowest in strangers with unknown or ulterior motives, such as a stranger who knocks on the door or a telemarketer on the phone.
Most of the types of people who are trusted a great deal or a fair amount are involved in established relationships of varying degrees of closeness. Family stands apart at the top of the list, but 70% or more have a high level of trust in coworkers and neighbors, as well as in “teachers in your local schools” and financial advisers. Teachers represent a role rather than specifically the teacher of a parent’s child. The next tier of trust includes fellow worshipers, businesspeople you buy from, leaders of your religious institution, and casual acquaintances seen a few times a year. Each involves some level of voluntary association and repeated interactions.
Trust is lower for more distant people, especially those whose motives may not be known. Candidates for local offices are more trusted than state elected officials, who in turn are more trusted than federal elected officials. A stranger who strikes up a conversation is not very well trusted but is more trusted than a stranger who knocks on one’s door, or especially a stranger who phones to sell something. Trust in this range of types of people is shown in Table 10.
Table 10: Trust in types of people
Among adults
| Type of person | Trust | |
| Great deal/fair amount | Not much/not at all | |
| Your immediate family | 92 | 7 |
| People you work with | 79 | 21 |
| Teachers in your local schools | 77 | 23 |
| Someone you recognize from your neighborhood | 72 | 28 |
| Financial advisors at your bank or other financial institution | 70 | 30 |
| People you attend religious services with | 69 | 31 |
| Businesspeople you buy goods or services from | 67 | 33 |
| The leaders of your religious institution | 64 | 35 |
| Casual acquaintances you see a few times a year | 64 | 36 |
| A candidate for local school board or city council | 53 | 47 |
| State elected officials such as state legislators | 36 | 64 |
| A stranger who strikes up a conversation with you | 34 | 66 |
| Federal elected officials such as members of Congress | 26 | 74 |
| Someone you don’t know who knocks on your door in the afternoon | 11 | 89 |
| Someone you don’t know who phones you to sell you something | 6 | 94 |
| Marquette Law School Poll national survey, June 9-15, 2026 | ||
| Question: How much can you trust the following people? | ||
What about variation in trust in each of these types of people, by age cohort? Do the differences in generalized trust found above also carry over to these specific types of people? Yes: In most cases, the younger cohorts are less trusting than the older cohorts, with only modest exceptions.
The decline in trust from oldest to youngest cohort is clear and substantial among all types of people who are rated most trustworthy overall. This includes family, where the youngest cohort is 15 points lower in trust than the oldest. But these differences are even larger for coworkers, neighbors, financial advisers, co-worshipers, business relationships, religious leaders, and casual acquaintances.
Among the types of people generally rated less trustworthy, differences across cohorts persist, with a small exception for the three least trustworthy categories: federal elected officials, strangers knocking on doors, and telemarketers. In these groups with especially low overall trust, the youngest cohort has slightly higher trust than their elders, though trust is quite low for all cohorts.
The decline in trust also applies to each succeeding cohort, from the oldest to the youngest, with only a few minor exceptions. For an example of an exception, the 1990s cohort is more trusting in coworkers than the 1980s cohort, but the 2000s cohort is less trusting than either. The strong and consistent pattern is that across all these types of people, trust consistently declines as we move from older to younger cohorts. The full pattern is shown in Table 11.
Table 11: Trust in types of people, by cohort
Among adults
| Type of person | Trust a great deal/fair amount | ||||||
| All adults | Pre-1960 | 1960s | 1970s | 1980s | 1990s | 2000s | |
| Your immediate family | 92 | 98 | 95 | 92 | 93 | 90 | 83 |
| People you work with | 79 | 88 | 85 | 79 | 73 | 81 | 65 |
| Teachers in your local schools | 77 | 82 | 79 | 81 | 76 | 74 | 69 |
| Someone you recognize from your neighborhood | 72 | 86 | 77 | 74 | 70 | 67 | 52 |
| Financial advisors at your bank or other financial institution | 70 | 87 | 77 | 74 | 63 | 59 | 57 |
| People you attend religious services with | 69 | 81 | 79 | 70 | 66 | 60 | 53 |
| Businesspeople you buy goods or services from | 67 | 83 | 81 | 71 | 59 | 55 | 51 |
| The leaders of your religious institution | 64 | 80 | 78 | 65 | 60 | 51 | 48 |
| Casual acquaintances you see a few times a year | 64 | 75 | 70 | 65 | 59 | 59 | 51 |
| A candidate for local school board or city council | 53 | 66 | 55 | 55 | 49 | 47 | 43 |
| State elected officials such as state legislators | 36 | 53 | 35 | 36 | 34 | 29 | 26 |
| A stranger who strikes up a conversation with you | 34 | 40 | 40 | 34 | 28 | 34 | 24 |
| Federal elected officials such as members of Congress | 26 | 30 | 30 | 32 | 20 | 20 | 24 |
| Someone you don’t know who knocks on your door in the afternoon | 11 | 9 | 13 | 9 | 9 | 11 | 14 |
| Someone you don’t know who phones you to sell you something | 6 | 2 | 4 | 3 | 7 | 8 | 12 |
| Marquette Law School Poll national survey, June 9-15, 2026 | |||||||
| Question: How much can you trust the following people? | |||||||
Trust consistently declines as we move from older to younger people across these numerous measures of trust—in people in general, in presumptions about trustworthiness, and in 15 specific types of people. The Marquette Law School Poll also found that the handy explanation of social media use doesn’t stand up to empirical examination. Within each cohort, use of social media is at best inconsistently related to trust, and there is no systematic decline in trust as social media use increases. We are left without a ready answer to the question of what has changed since the 1950s that has produced succeeding generations who have substantially less trust in other people. But the consistency of the decline shows that the newest cohorts are not aberrations. Changes over the past 70 years appear to have systematically reduced trust in people in general and in our friends and neighbors, just as in those whose motives most people don’t trust.
Where and how often do we interact with other people?
Given this pervasive limited trust in others, how do Americans today interact with others?
Perhaps the best example of modern social isolation is the image of a group of people sitting together while each is mesmerized by their cell phone, not speaking to anyone around them. In this sample, 41% say they turn to their phone all or most of the time, rather than talk to people around them. Another 40% say they do this sometimes, while 20% say they seldom or never do so.
Nearly 60% of adults start a conversation with strangers at least once a month.
That image of isolation is tempered by people’s sense that they start conversations with strangers fairly often. Among all adults, 57% say they start such conversations at least once a month or more, while 29% do so a few times a year and 14% say they never do. Here, trust begets conversations. Of those who trust strangers who start conversations, 70% say they in turn start conversations with strangers at least monthly, while those who do not trust strangers start conversations less frequently, with 51% doing so at least monthly.
80% of adults say “hello” to strangers in passing at least monthly.
Trust in people generally boosts how often people speak or chat with strangers. Four in five adults report themselves as saying “hello” to strangers in passing at least monthly. Of those who say most people can be trusted, 86% say they say hello frequently. Even among those who don’t trust others, a still sizable 73% speak in passing. Initiating a conversation with a stranger is less common but also more frequent among those who trust others, 61%, than among those distrustful, 52%.
Over half of adults spend a social evening with friends at least monthly.
More substantial interactions with people outside the immediate family include spending a social evening with friends, which 54% say they do at least monthly, though 11% say they never do this. Thirty-three percent say they go to parties or meals organized by other people at least monthly, while 23% say they host parties or dinners at least monthly.
Text messages are most frequent electronic interaction.
The amount of interaction with others varies widely across locations and circumstances. It is not surprising that the most frequent means of interaction are electronic rather than face-to-face. Text messages are the most frequent interaction, followed by telephone calls and social media.
Work provides most common face-to-face interaction.
The most common face-to-face interaction comes at work, though this is naturally much less common for retired people and others not in the labor force. Among full-time employees, 86% say this is the source of a great many interactions. While it is obvious that work involves interaction with others, it is important as a source of contact with other people who may become friends and who provide different perspectives from those within the immediate family.
For parents of school-age children, schools offer a frequent point of contact with others. Likewise, coffee shops and restaurants are frequent locations for personal interactions.
Organized voluntary associations are important but less common sources of interaction, including religious services, parties either given by others or hosted, neighborhood events, and clubs. About one in five say they meet other people at bars or taverns regularly. Less common locations are special interest groups, such as knitting circles, and sporting events.
The full list is shown in Table 12.
Table 12: Where and how often people interact with others
Among adults
| Where | How often | |
| Monthly or more | Few per year or never | |
| Through text messages | 84 | 16 |
| On a telephone call | 72 | 28 |
| On social media | 63 | 37 |
| At work | 58 | 42 |
| Visiting someone’s home | 47 | 53 |
| Through your child’s school (among parents) | 41 | 59 |
| At a coffee shop or restaurant | 40 | 60 |
| At religious services | 33 | 67 |
| At parties or meals organized by others | 33 | 67 |
| At neighborhood events or parks | 28 | 72 |
| In a social organization or club | 26 | 74 |
| At parties or meals organized by yourself | 23 | 77 |
| At a bar or tavern | 22 | 78 |
| In a class or group that meets for some purpose such as knitting or a book club | 18 | 82 |
| Attending sporting events | 17 | 83 |
| Marquette Law School Poll national survey, June 9-15, 2026 | ||
| Question: In each of the following settings, how often do you interact with other people outside of your immediate family? | ||
Over 70% of single adults don’t use dating apps, though more common for singles under 50.
For those seeking a more involved relationship, dating apps are a relatively common way to meet people, with 15% of single people saying they use such apps at least once a month, with an additional 13% using such apps a few times a year. Seventy-two percent say they don’t use dating apps at all. Use of dating apps is more common among singles under age 50, falling sharply after that, as shown in Table 13. (Single people make up 40% of all adults. Those not married but living with a partner are not counted as single.)
Table 13: Use of dating apps, by age
Among single adults (never married, separated, divorced or widowed)
| Age | Use of a dating app | ||
| More than once a month | A few times a year | Never | |
| 18-29 | 22 | 18 | 61 |
| 30-39 | 21 | 17 | 62 |
| 40-49 | 22 | 10 | 68 |
| 50-59 | 9 | 17 | 74 |
| 60-69 | 4 | 7 | 89 |
| 70+ | 4 | 3 | 93 |
| Marquette Law School Poll national survey, June 9-15, 2026 | |||
| Question: Use a dating app to meet people] How often do you do the following things? | |||
Regardless of how singles meet people, they go on dates more often than they use dating apps. Among singles, 27% say they go on a date at least once a month, 24% go out a few times a year, and 49% are not dating at all.
Dating is most frequent for singles in their 30s, with those in their 20s dating the next most frequently. The 20-somethings, however, also have a relatively high level of never dating. Beyond the 30s, dating among singles is fairly stable in the 40s through the 60s, dropping for those 70 and over. It is worth noting, however, that about half or more of singles over 40 say they never go on dates. This is shown in Table 14.
Table 14: Going on dates, by age
Among single adults (never married, separated, divorced or widowed)
| Age | Going on dates | ||
| More than once a month | A few times a year | Never | |
| 18-29 | 33 | 24 | 43 |
| 30-39 | 40 | 33 | 27 |
| 40-49 | 23 | 25 | 52 |
| 50-59 | 24 | 28 | 48 |
| 60-69 | 22 | 18 | 60 |
| 70+ | 8 | 13 | 79 |
| Marquette Law School Poll national survey, June 9-15, 2026 | |||
| Question: [Go on a date with someone] How often do you do the following things? | |||
About the Marquette Law School Poll
The survey was conducted June 9-15, 2026, interviewing 1,514 adults nationwide, with a margin of error of +/-2.7 percentage points. For the analysis of single persons, those who never married, are separated, divorced or widowed, the sample size is 606, with a margin of error of +/-4.2 percentage points. For the combined polls for each year in tables 1 through 3, the sample sizes and margins of error are shown in Table 15.
Table 15: Sample size and margin of error for each year
Among adults
| Year | Sample size | Margin of error |
| 2021 | 3,425 | 2.1 |
| 2022 | 6,463 | 1.6 |
| 2023 | 6,036 | 1.6 |
| 2024 | 6,109 | 1.7 |
| 2025 | 6,143 | 1.4 |
| 2026 | 4,482 | 1.6 |
Interviews were conducted using the SSRS Opinion Panel, a national probability sample with interviews conducted online. Certain other data from this survey are held for future release, or were previously released on June 24 and June 25. The detailed methodology statement, survey instrument, topline results, and crosstabs for this release are available on the Marquette Law School Poll website.