
New Marquette Law School Poll finds Sanders’ support rising among Democrats and tight races between Trump and each Democratic candidate for president
MILWAUKEE — A new Marquette University Law School poll of Wisconsin registered voters finds that Sen. Bernie Sanders leads in the Democratic primary with support from 29 percent of those saying they will take part in the April 7 voting. Of the six Marquette polls conducted since August 2019, this is the first in which Sanders has held the top spot.
Mayor Mike Bloomberg is supported by 17 percent, and Vice President Joe Biden is the first choice of 15 percent. Mayor Pete Buttigieg is at 13 percent, Sen. Amy Klobuchar is at 11 percent, and Sen. Elizabeth Warren is at 9 percent.
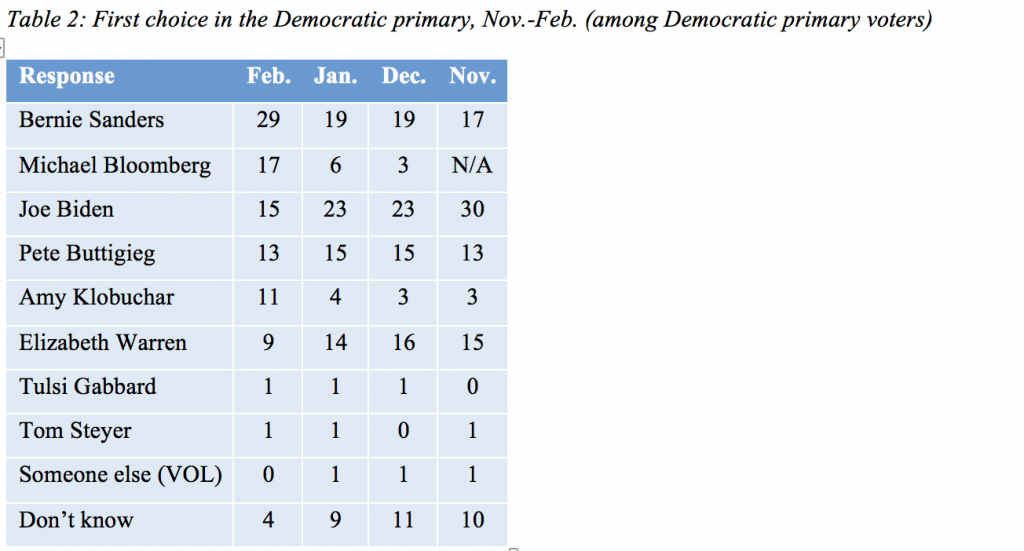
In January, Sanders was the choice of 19 percent, Bloomberg held 6 percent and Biden held first place with 23 percent.
The complete results for first and second choices in the Democratic primary are shown in Table 1.
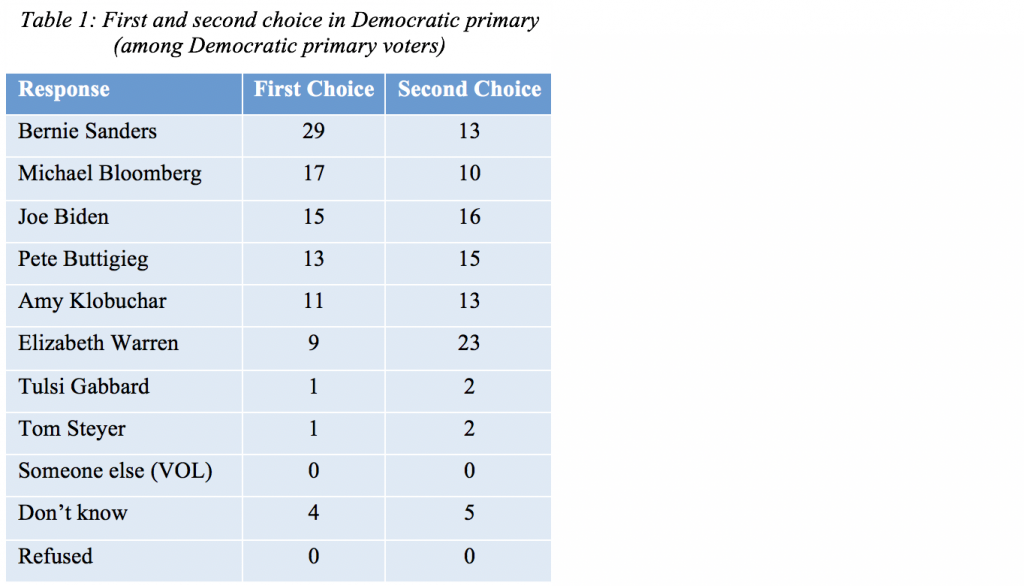
Table 2 shows how support for each candidate has changed each month since November 2019. Support for Sanders has increased while support for Biden has declined. After entering the race in the late fall, Bloomberg rose to second place in February. Klobuchar’s support has more than doubled her support from January, while Warren has declined over the past four months.
Fifty-six percent of Democratic primary voters say they might change their minds about their primary choice, while 42 percent say their mind is made up. Table 3 shows that Democratic primary voters have become more certain of their primary preferences since November.

The poll was conducted Feb. 19-23, 2020. The sample included 1000 registered voters in Wisconsin interviewed by cell phone or landline, with a margin of error of +/- 3.6 percentage points.
Democratic presidential primary preference items were asked of those who said they will vote in the Democratic primary in April. That sample size is 490, with a margin of error of +/-5.1 percentage points.
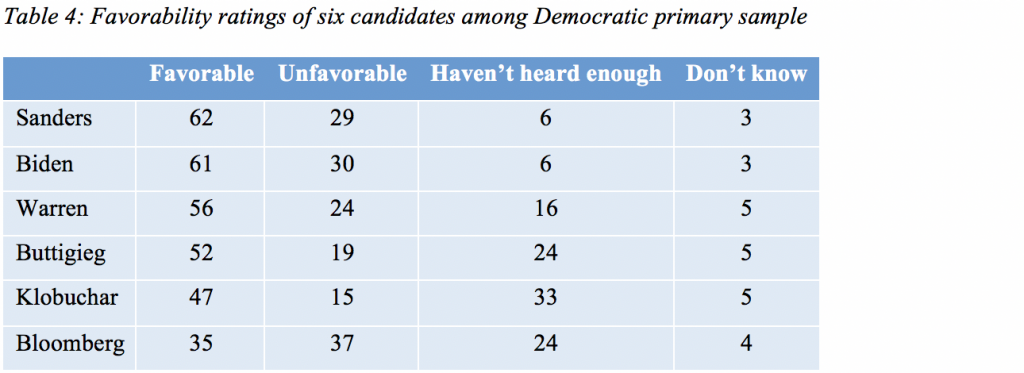
Among the Democratic primary sample, the percentage of those saying they have favorable or unfavorable opinions of each candidate is shown in Table 4. Bloomberg, despite his second place standing in vote preference, is the only primary candidate with more unfavorable than favorable ratings among Democratic primary voters. Elizabeth Warren holds the third-highest favorable rating, despite her sixth place standing in vote preference.
Democratic primary voters who describe themselves as liberal or very liberal are more likely to support Sanders or Warren than those who describe themselves as moderate or conservative, as seen in Table 5. The reverse pattern holds for Bloomberg and Biden, each of whom does better with moderate or conservative primary voters than with more liberal ones. Buttigieg and Klobuchar draw support more evenly across ideological identities.
In this sample, 56 percent of Democratic primary voters described themselves as moderate or conservative while 41 percent considered themselves liberal or very liberal.

Sanders has consistently received more support from younger voters than from older ones. That pattern continues to hold in the February data, but he has increased support across all age groups since the January poll, as shown in Table 6.
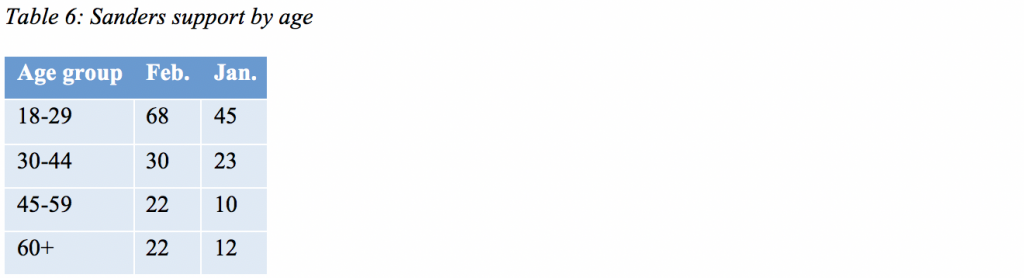
Table 7 shows that Sanders, Bloomberg, Klobuchar and Warren each do a little better among those who say they are absolutely certain to vote in the Democratic primary than among those who are not so certain they will vote. Biden does substantially less well among those certain to vote than with those less likely to do so. Buttigieg is also slightly weaker among the most likely to vote.

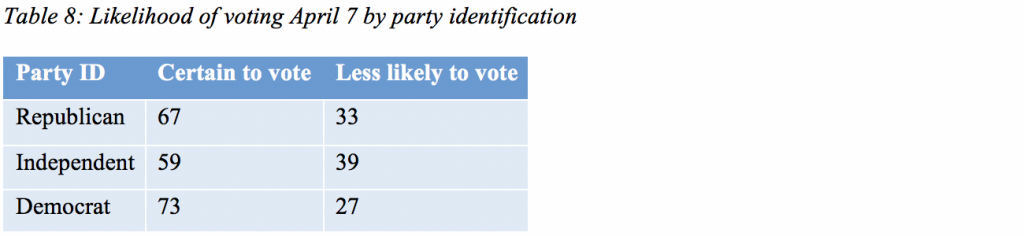
Respondents were asked how likely they were “to vote in the April 7 election for state Supreme Court, presidential primaries, and other offices” and were asked in a separate question in which presidential primary they would participate.
The likelihood of voting on April 7 is shown by party identification in Table 8. Democrats are a little more likely than Republicans to say they are certain to vote, with independents least certain of participating.
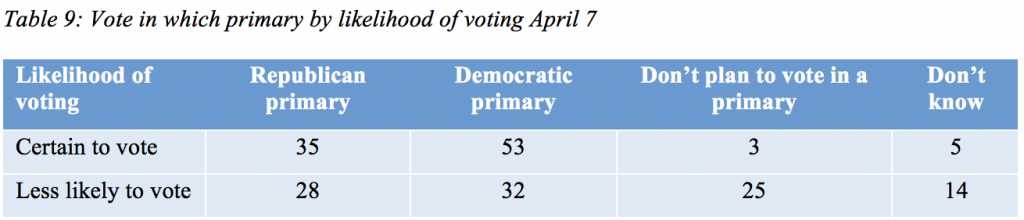
Of those who say they are certain to vote, a majority say they will vote in the Democratic primary, while just over a third say they will vote in the Republican primary, as shown in Table 9.
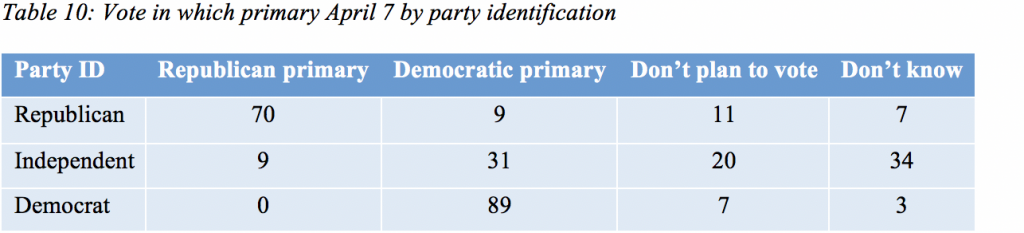
While most partisans say they will participate in their own party’s primary, about 10 percent of Republicans say they will vote in the Democratic presidential primary, while no Democrats say they will cross over to the Republican primary, as in Table 10 (President Donald J. Trump is the only candidate listed on the Republican primary ballot. Crossover voting is permitted in Wisconsin.). About a third of independents say they will vote in the Democratic primary, though more say either they won’t vote or don’t know which primary they might vote in.
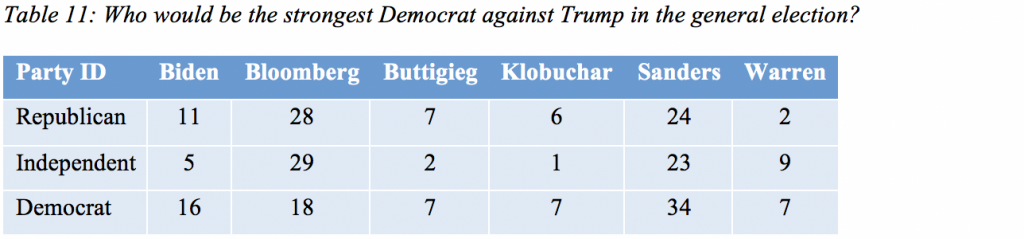
“Electability” has been a topic of discussion for primary voters. We asked respondents, “Regardless of who you think would win, which of the current Democratic candidates do you think would run the strongest race against Donald Trump in November’s presidential election?” Responses by party identification are shown in Table 11.
Among Democrats, Sanders is seen as the strongest against Trump, with Bloomberg and Biden a distant second and third. Republicans see Bloomberg as the strongest, closely followed by Sanders with Biden a distant third. Independents give similar responses to Republicans, although they rate Biden as a weaker candidate than do Republicans.
General-election matchups
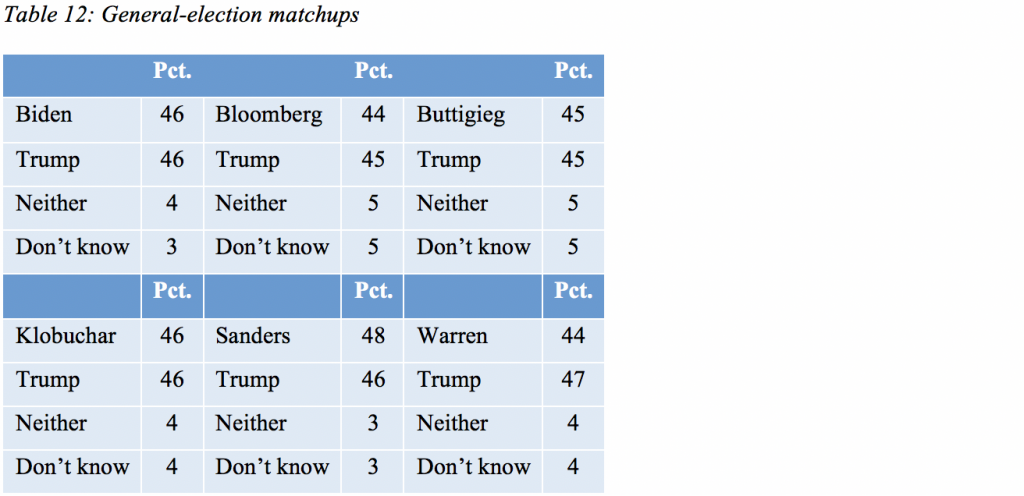
General-election matchups between Trump and six Democratic candidates all indicate very close races. Sanders holds a two-percentage point edge over Trump while Biden, Buttigieg and Klobuchar tie with Trump. Bloomberg trails Trump by one point and Warren trails by three points. Each of these margins is well within the margin of error for this poll. Table 12 presents the matchups.
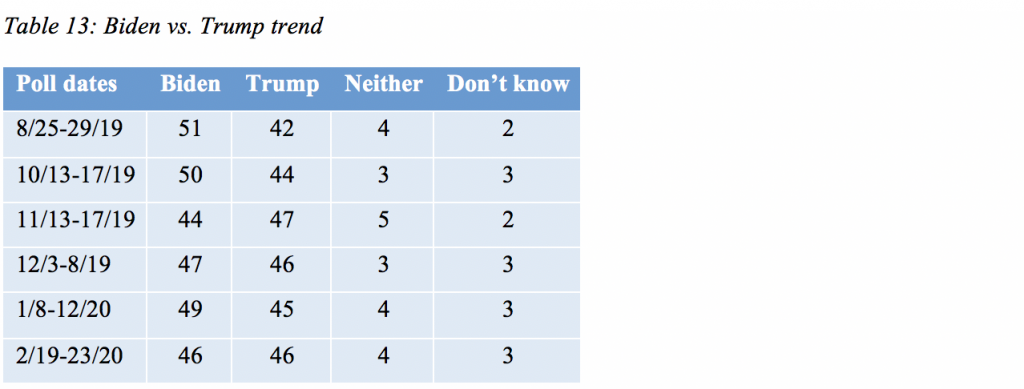
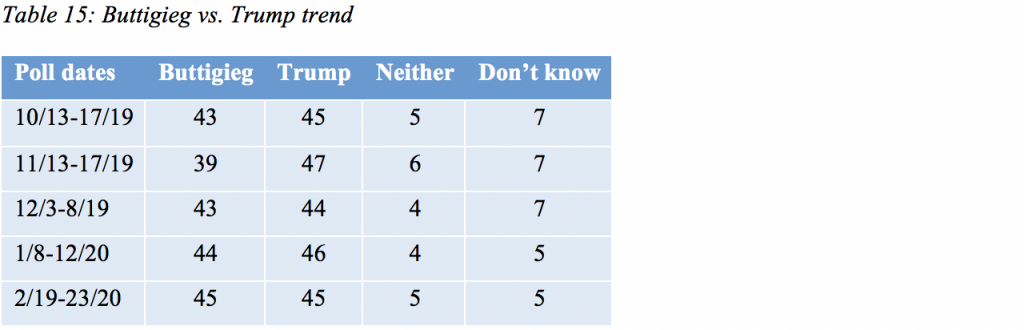
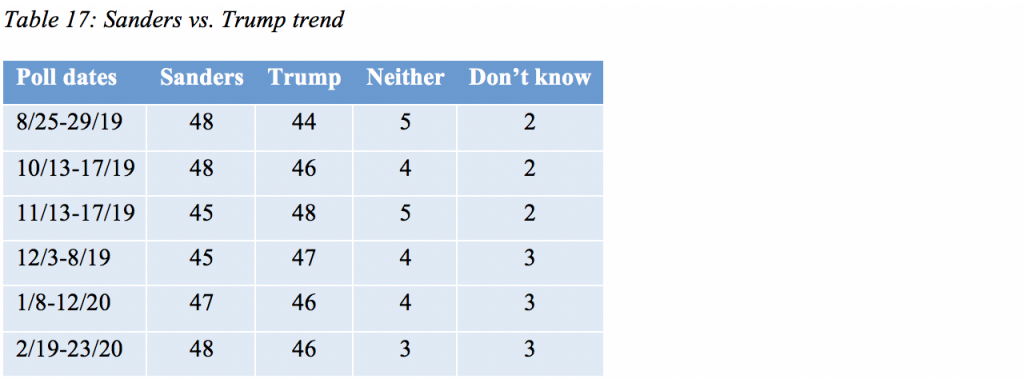
Trends in the matchups since August are shown in Tables 13-18. The matchup with Buttigieg was not asked in August. Klobuchar was asked only in November (half-sample) and February. The matchup with Bloomberg was first asked in February.


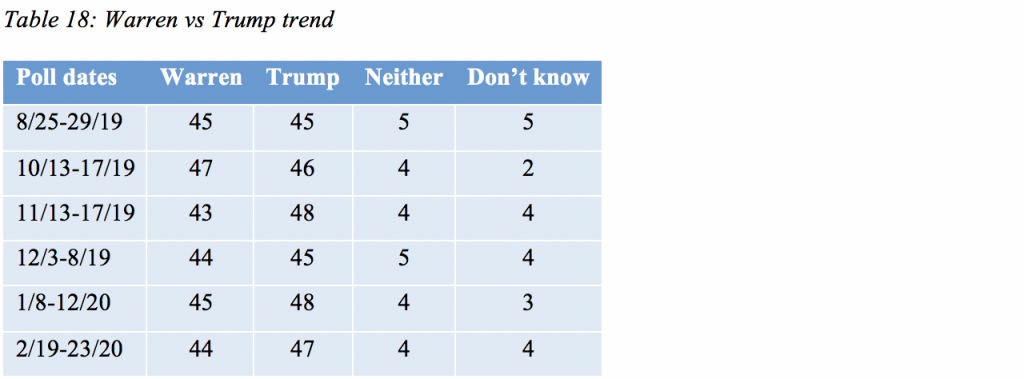
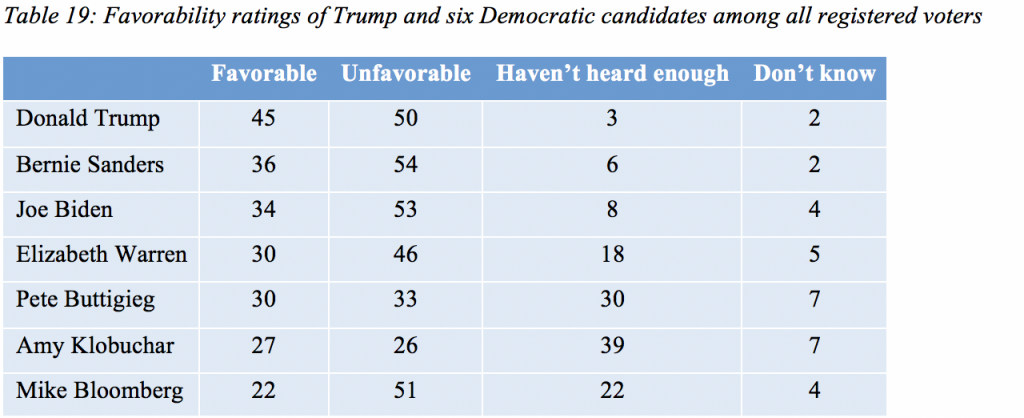
Favorability of Trump and six Democrats among all registered voters is shown in Table 19. The Democratic candidates are all less favorably perceived than is Trump. With the exception of Klobuchar, all candidates have more unfavorable than favorable evaluations among all registered voters.
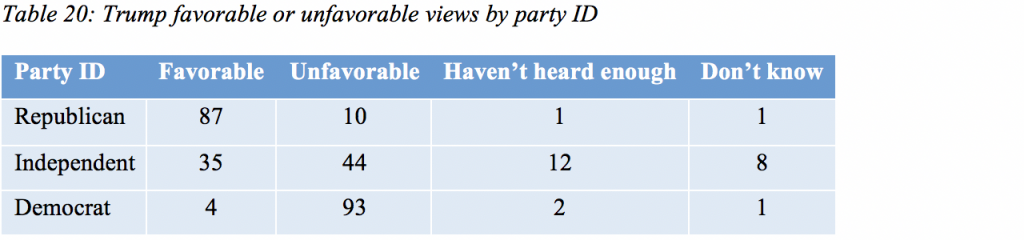
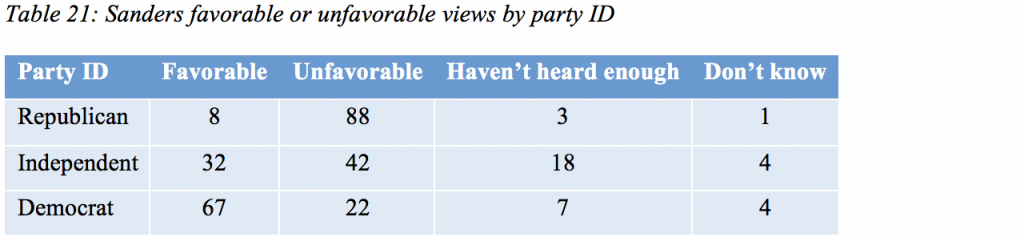
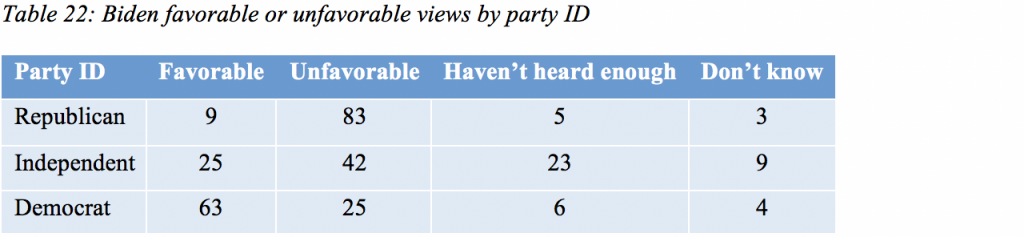
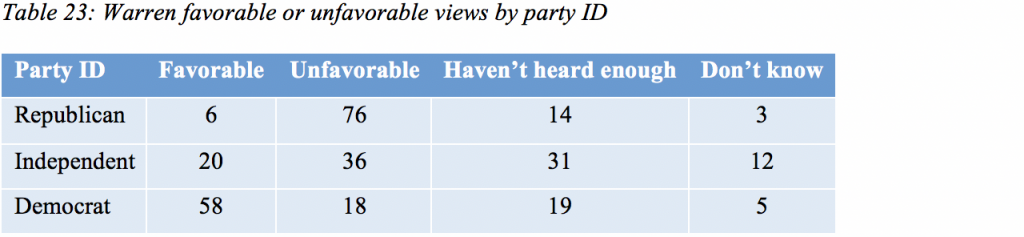
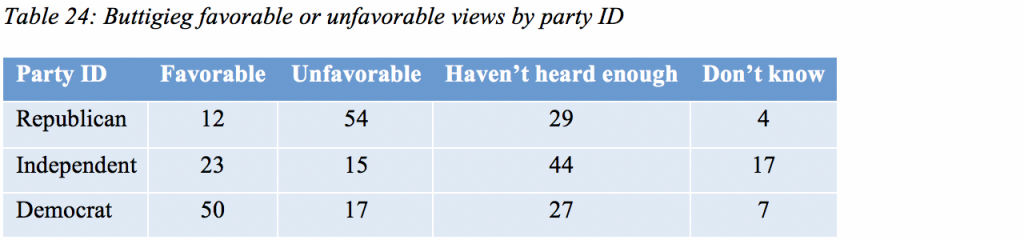
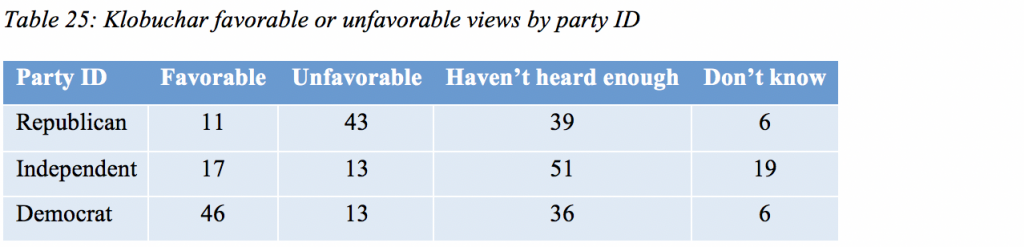
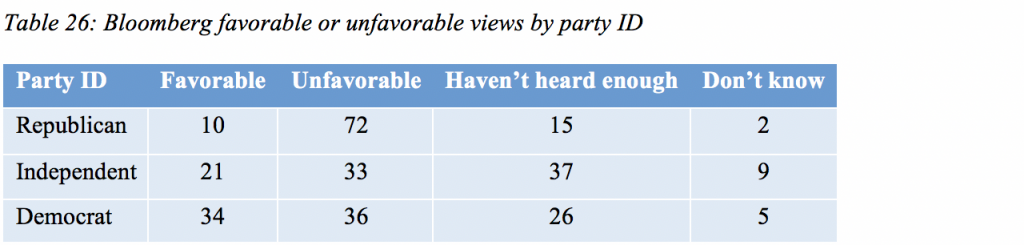
Favorability varies strongly by party identification, with partisans holding sharply negative views of candidates of the other party. Democrats are more divided over some of their potential nominees and some Democrat candidates remain less well known even among Democratic partisans. Tables 20-26 show favorability by party identification for each candidate. (Democrats in these tables includes all those who identify as Democrats or independents who lean Democratic, while favorability among Democratic primary voters above includes independents and Republicans planning to vote in the Democratic primary and excludes those who do not intend to vote in the primary.)
Trump job approval
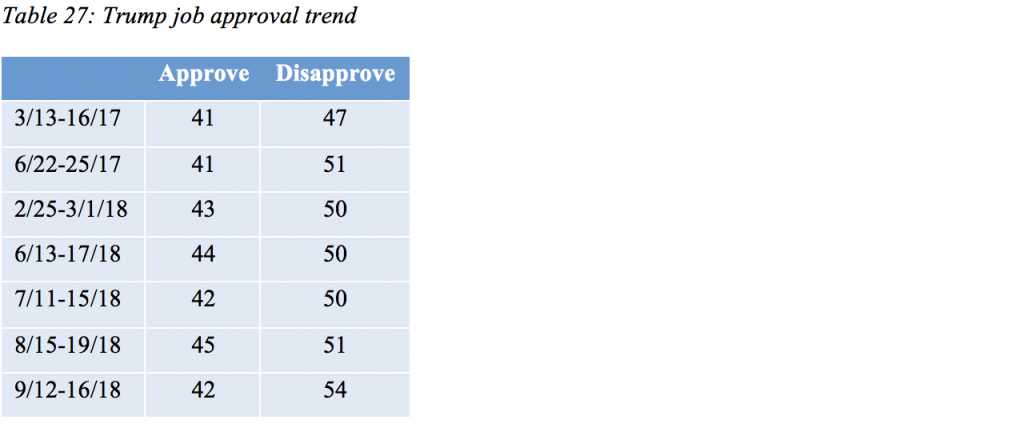
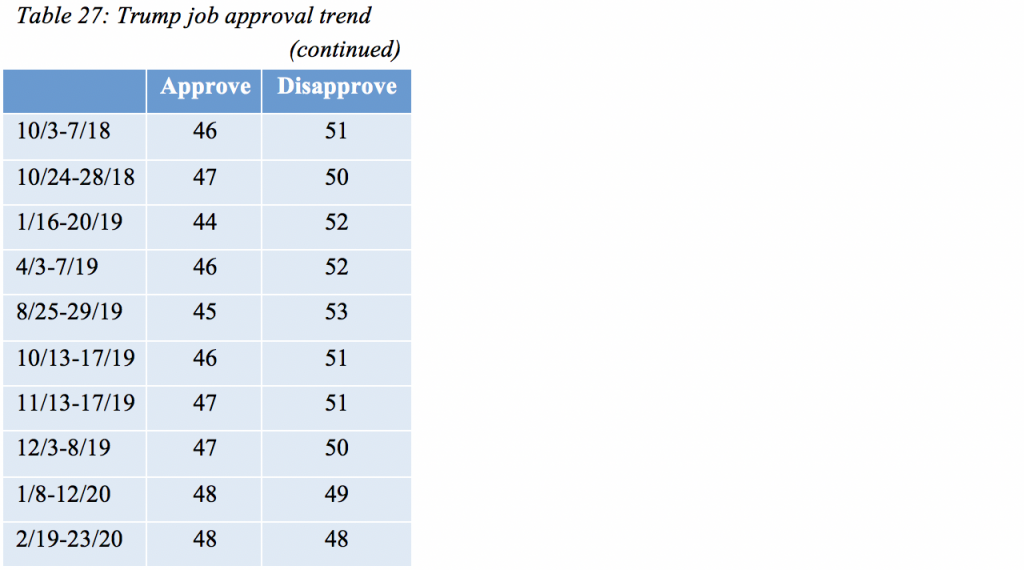
Forty-eight percent approve of the job Trump is doing as president, with 48 percent also disapproving. This is the first Marquette Law School Poll since Trump took office in which Trump’s disapproval is not higher than his approval. In January, 48 percent approved and 49 percent disapproved.
Trump’s job approval trend is shown in Table 27.
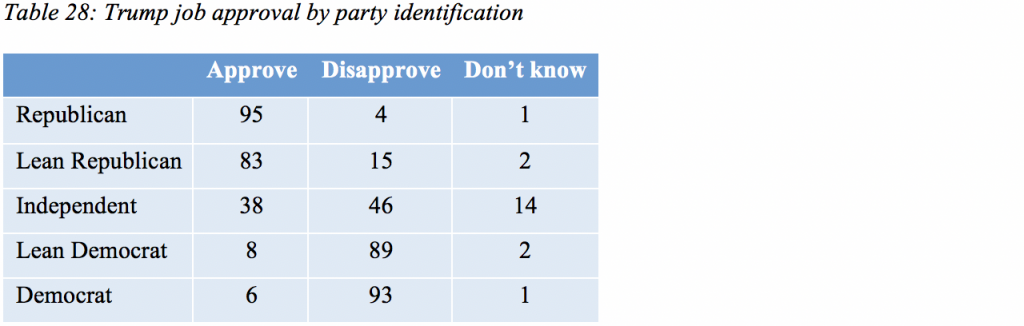
Trump’s job approval is extremely high among Republicans, extremely low among Democrats and split among independents and those who lean to a party, as shown in Table 28.
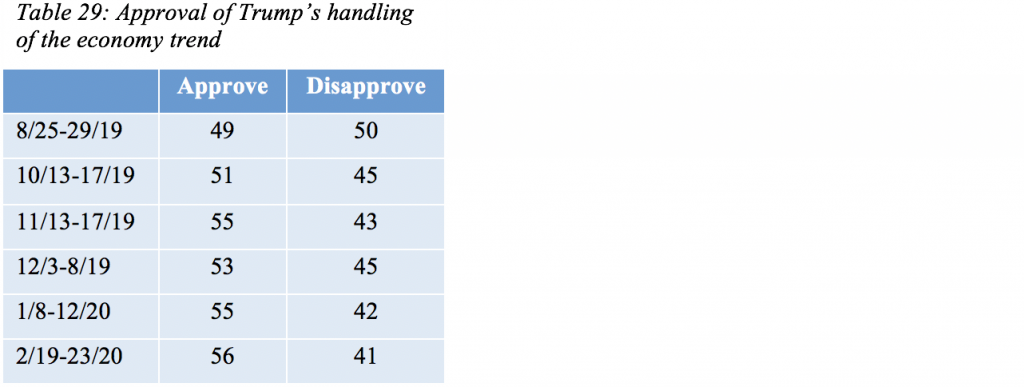
Fifty-six percent of those polled approve of Trump’s handling of the economy, while 41 percent disapprove. In December, 55 percent approved and 42 percent disapproved.
The trend in approval of Trump’s handling of the economy is shown in table 29.
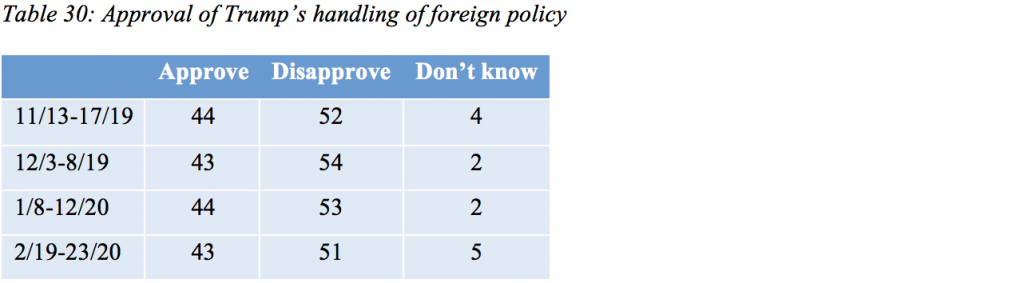
The trend in foreign policy approval is shown in Table 30.
Opinions about impeachment
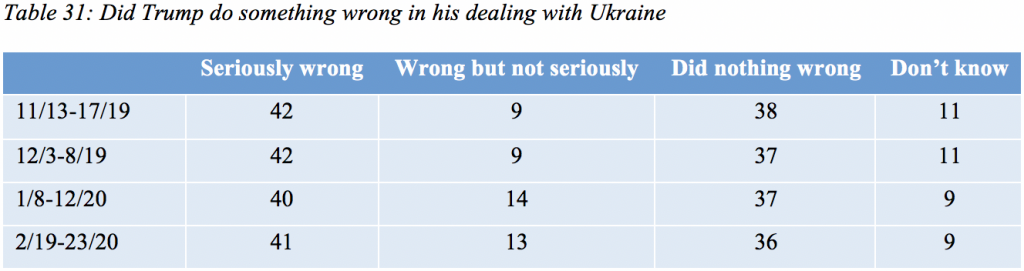
Views about Trump’s actions regarding Ukraine changed very little following the U.S. Senate vote not to convict Trump based on impeachment counts approved by the U.S. House of Representatives. In the new results, forty-one percent say that Trump did something seriously wrong in his dealings with Ukraine, 13 percent say he did something wrong but not seriously so and 36 percent say Trump did nothing wrong. Nine percent say they don’t know. In January, 40 percent said he did something seriously wrong, 14 percent said it was wrong but not serious and 37 percent said he did nothing wrong.
The trend in views of Trump’s dealing with Ukraine is shown in Table 31.
Following the Senate vote to acquit Trump, 42 percent say the Senate should have convicted Trump and removed him from office, while 52 percent say the Senate should have acquitted him of the charges. Five percent say they don’t know. These views are little changed from the January poll which asked, before the Senate proceedings, what the Senate should do. Tables 32 and 33 show the results for January and February respectively.


National policy issues
With the presidential election on the horizon, we asked about two social issues that divide the parties and are often subject of campaign debate.
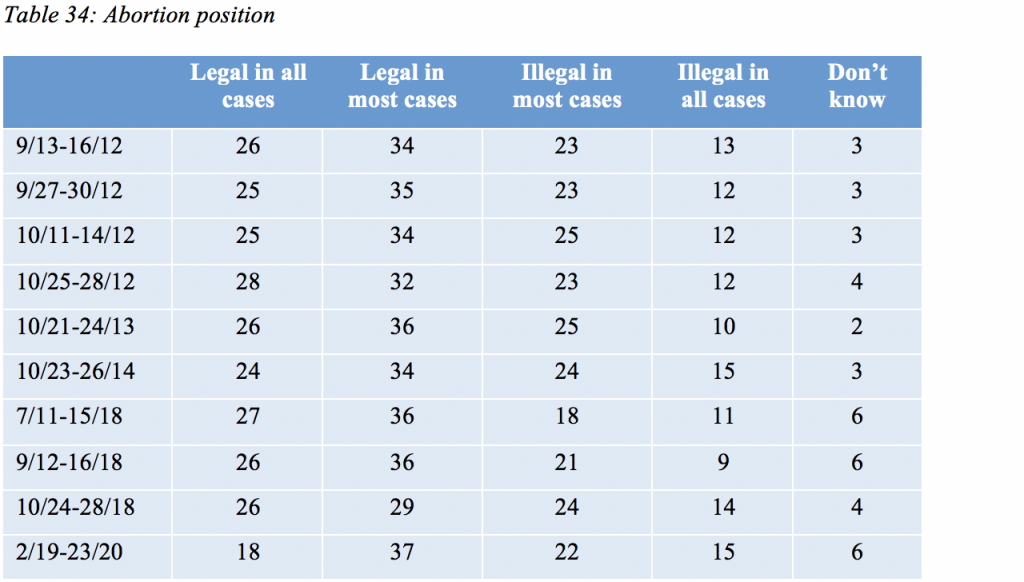
Opinions about abortion have been a longstanding issue in elections and legislation. In the current February poll, 18 percent say abortions should be legal in all circumstances, with 37 percent saying it should be legal in most circumstances. Twenty-two percent say it should be illegal in most circumstances, while 15 percent say it should be illegal in all circumstances. The full trend for this question is shown in Table 34.
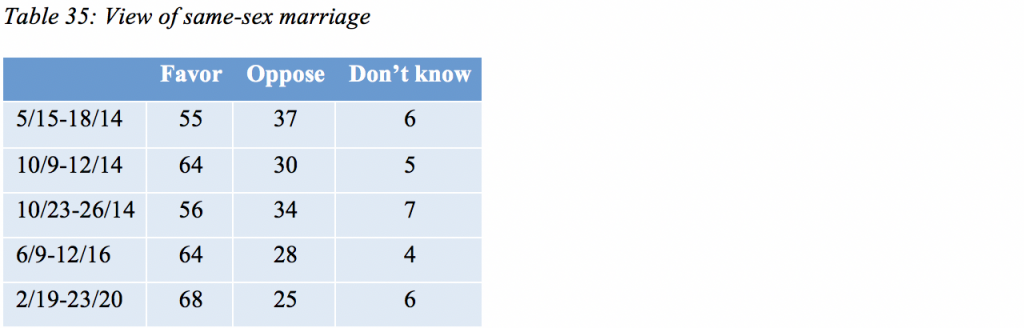
Views of same-sex marriage have changed considerably over time. The recent trend in Wisconsin, shown in Table 35, shows over two-thirds support for the legal status of same-sex marriage, with about a quarter continuing to oppose it.
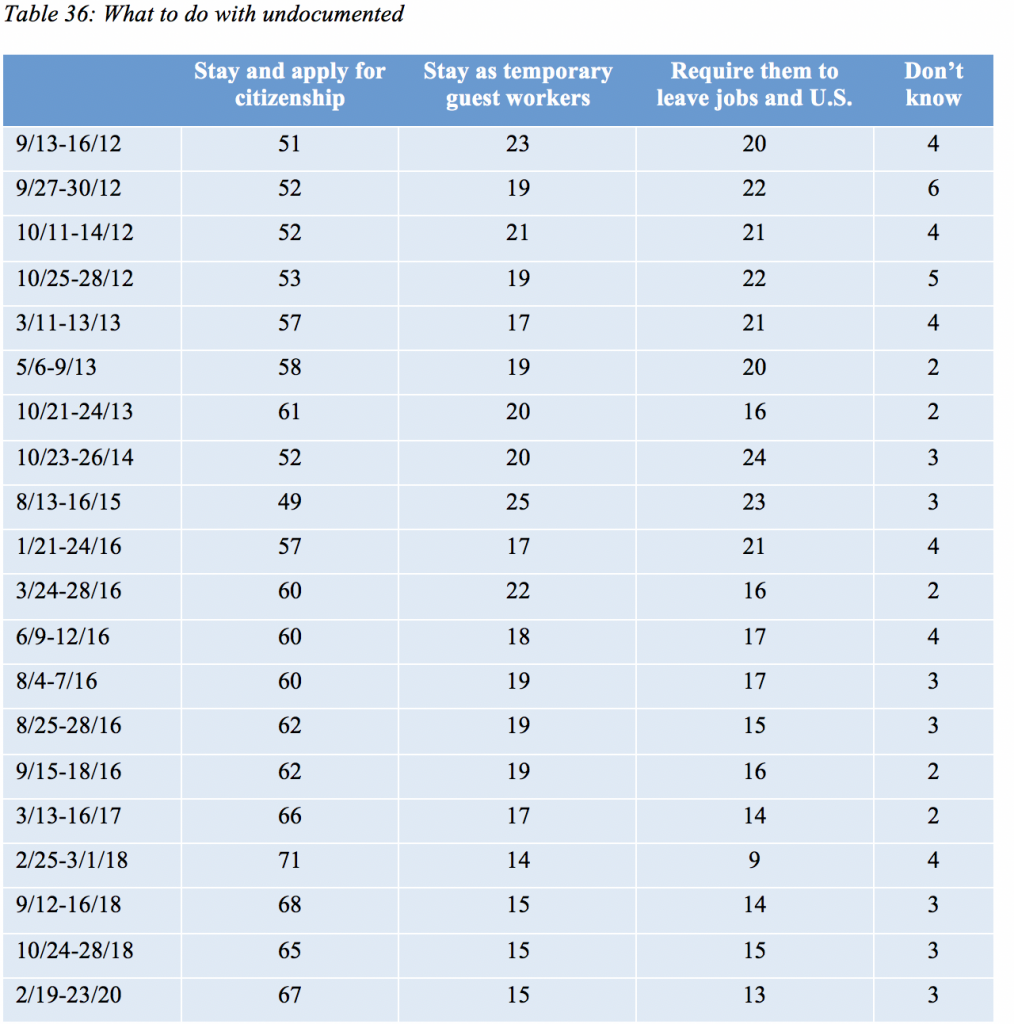
What United States policy should be regarding undocumented immigrants already in the country is another long-running issue. Table 36 shows the trend in opinion on this issue. Over time, there has been majority support for a policy allowing a path to citizenship and this majority has grown in recent years.
The number of those who believe that undocumented immigrants should be required to leave the United States has modestly declined over time.
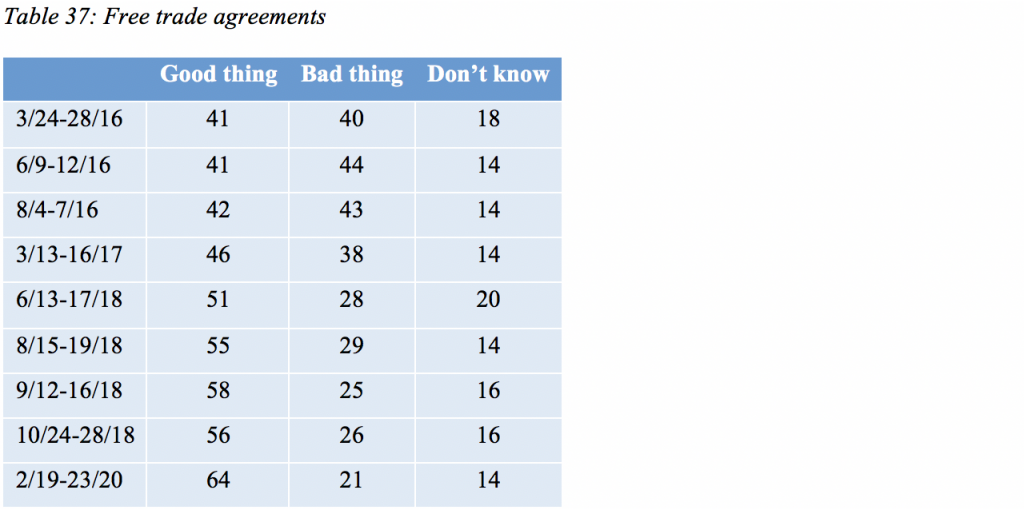
Free-trade agreements have been a focus of recent policy, with the recent adoption of the United States, Mexico, Canada Agreement to replace NAFTA. The percentage who see free-trade agreements as good for the United States has grown in recent years, as shown in Table 37.
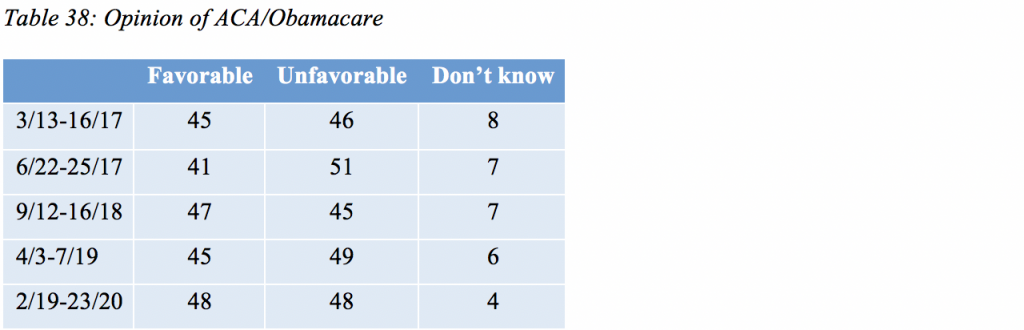
Views of the Affordable Care Act, or Obamacare, have remained about evenly divided since 2017, as shown in Table 38.
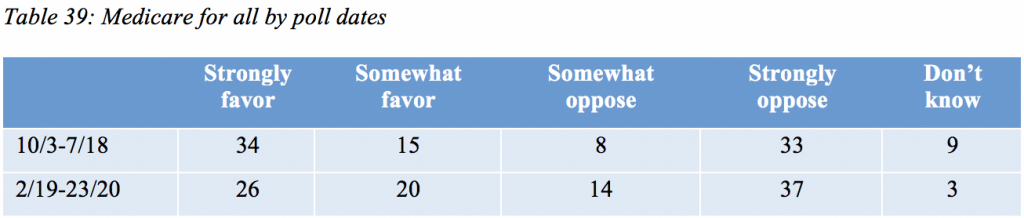
A proposed “Medicare for all” program in which all Americans would receive health coverage through a single government-run Medicare program divides the public, with 46 percent strongly or somewhat in favor of such a program and 51 percent strongly or somewhat opposed. Opposition has risen from 41 percent in October 2018, as shown in Table 39.
An alternative to Medicare for all is the so-called “public option” in which government medical coverage would compete with private insurance and be available for any who chose to sign up for the government alternative. Sixty-one percent support a public option, with 32 percent opposed. The trend is shown in Table 40.

State issues
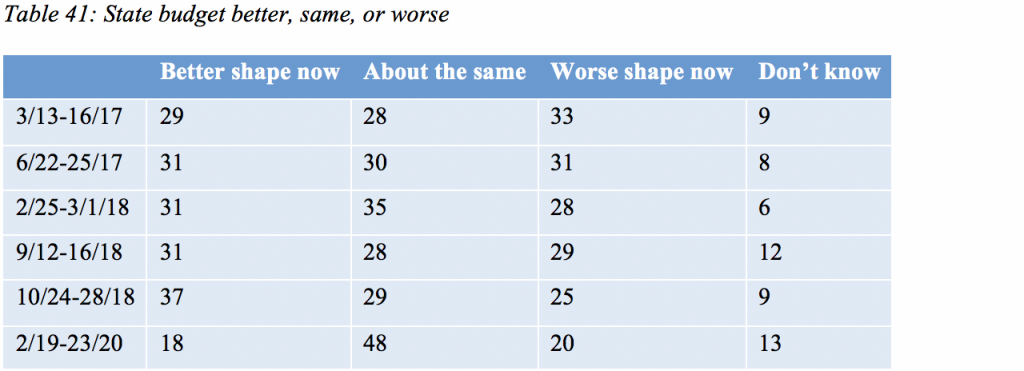
Voters see the state budget as stable, with 48 percent saying the budget is in about the same shape as in recent years, as shown in Table 41. Eighteen percent say it is in better shape, and 20 percent say it is in worse shape, than in recent years.
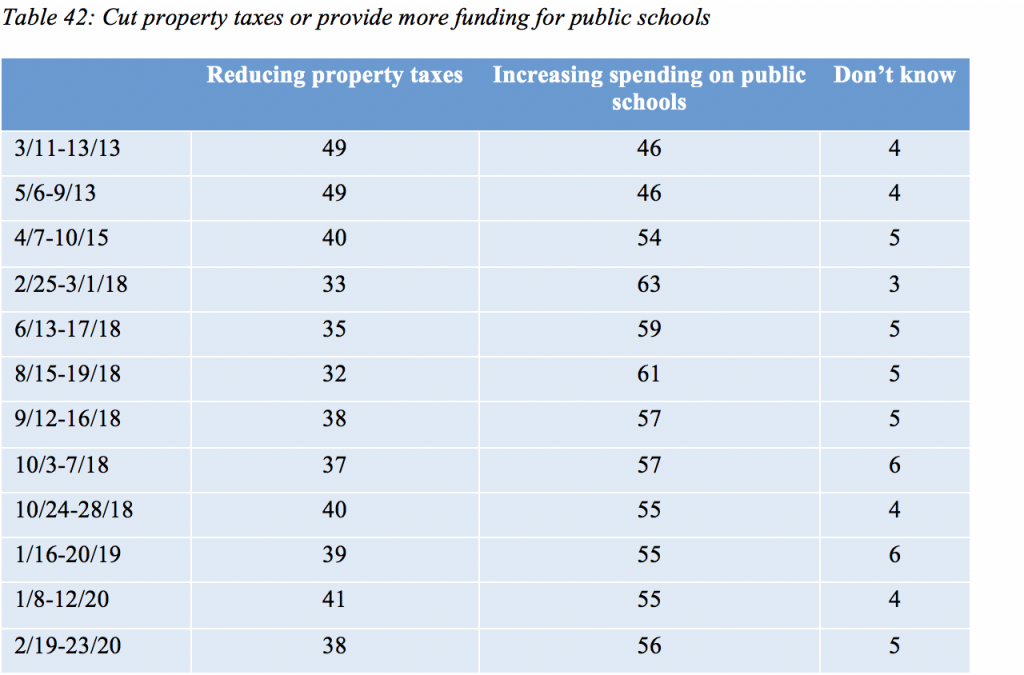
More than half, 56 percent, say it is more important to increase spending on public schools than it is to reduce property taxes, while 38 percent say reducing property taxes is more important. Support for increased school spending peaked in early 2018, while support for cutting property taxes was at its highest in 2013, as shown in Table 42.
A majority of respondents, 57 percent, say that they would be inclined to vote for a local referendum that raised taxes to support public schools, while 34 percent would be inclined to vote against it. This is little changed since the question was last asked in 2016, as shown in Table 43. These results are statewide and are not connected to any specific referendum.

Voters favor a non-partisan approach to redistricting over the current process in which the legislature and governor are responsible for drawing legislative and congressional districts. This item was also asked in January 2019, as shown in Table 44.

Economic outlook and issues
Wisconsin registered voters hold a positive view of the performance of the economy over the past 12 months, with 47 percent saying the economy has improved over the past year, 15 percent saying it has worsened and 36 percent saying it has stayed the same. The trend in economic evaluations is shown in Table 45.

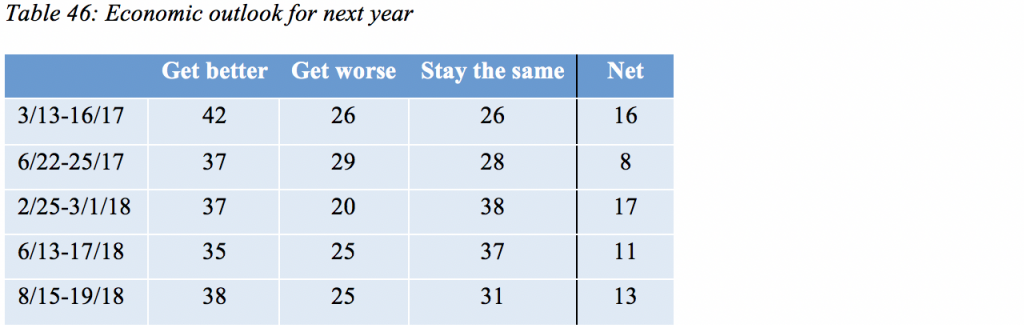
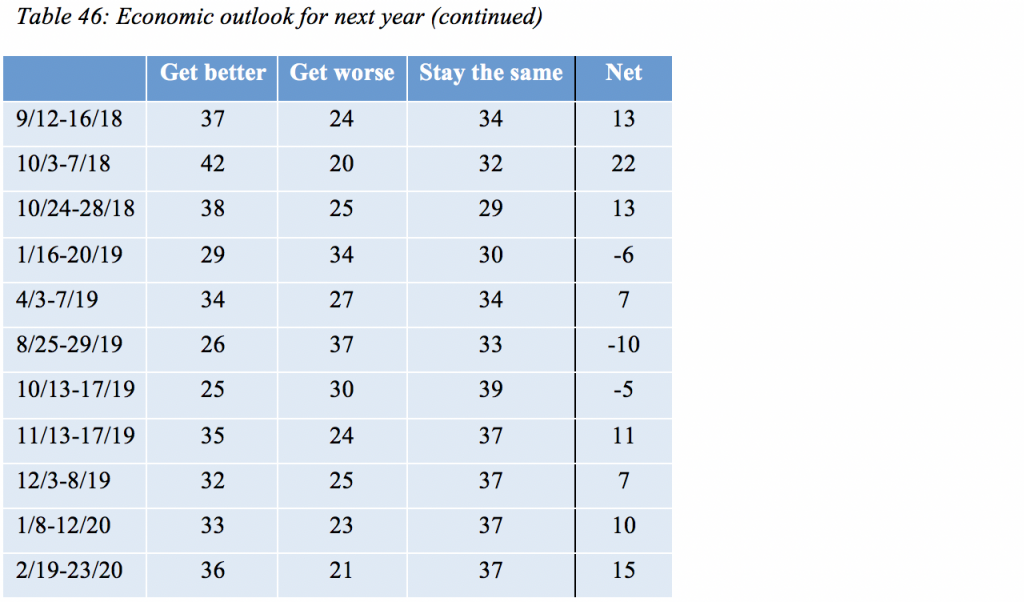
Looking ahead to the next year, 36 percent say the economy will improve, while 21 percent think it will get worse and 37 percent say the economy will remain the same. The trend in economic outlook is shown in Table 46.
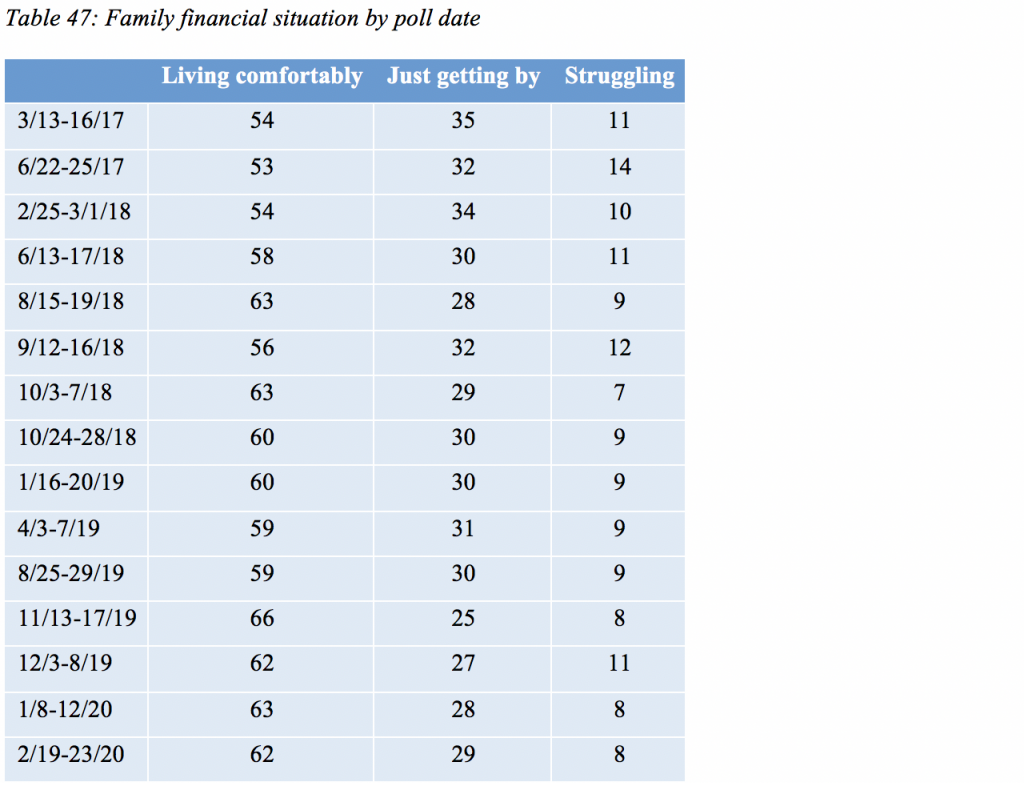
Respondents are asked each survey about their family’s financial situation. In February, 62 percent said they are “living comfortably,” while 29 percent said they are “just getting by,” and 8 percent said they are “struggling.” This trend is shown in Table 47.
State of the state
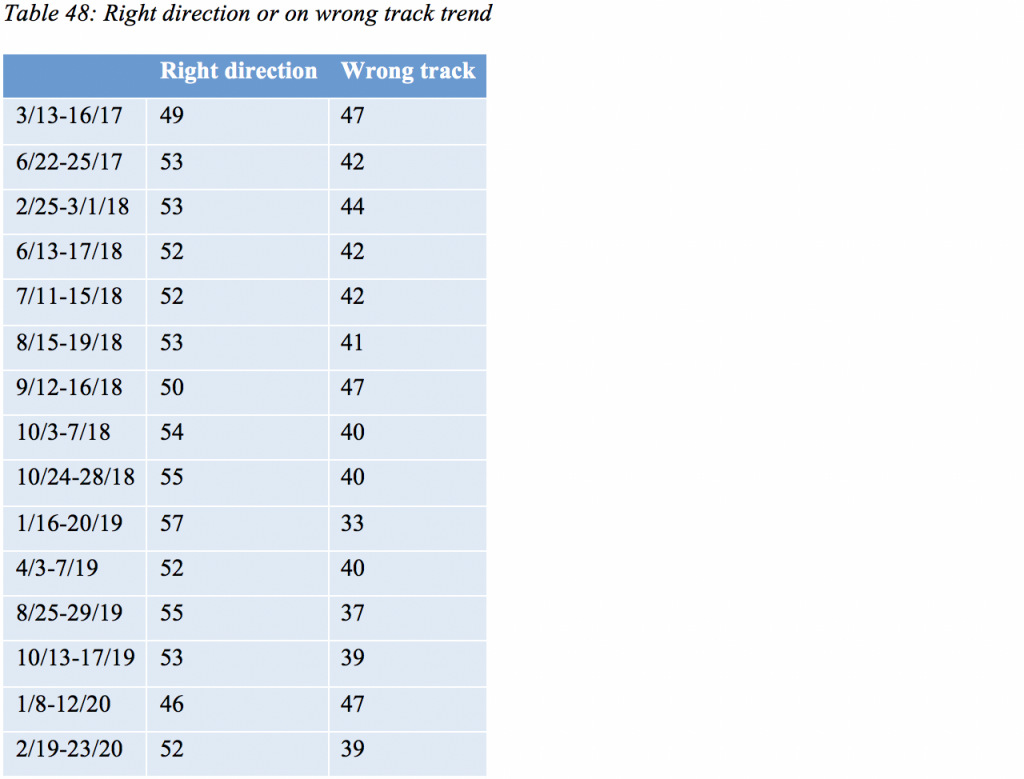
In February, 52 percent say the state is headed in the right direction, while 39 percent say it has gotten off on the wrong track. The trend in opinion is shown in Table 48.
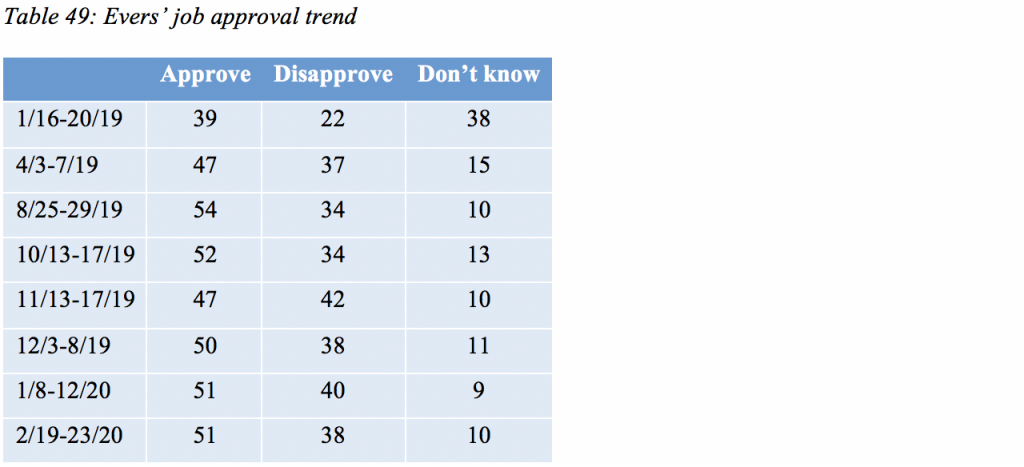
Gov. Tony Evers’ job approval stands at 51 percent, with disapproval at 38 percent. Ten percent say they don’t have an opinion. The trend in job approval of Evers is shown in Table 49.
Approval of the state legislature’s handling of its job stands at 46 percent with disapproval at 40 percent. Thirteen percent say they don’t have an opinion.
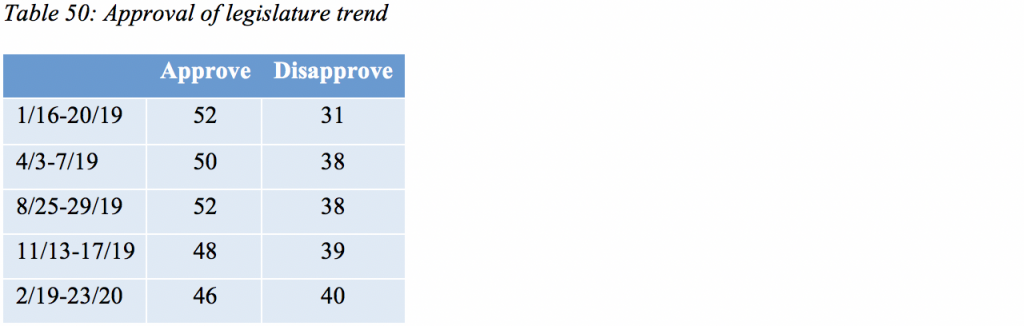
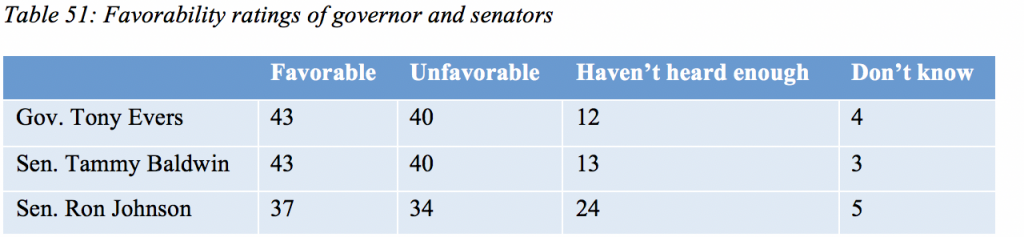
Table 51 presents the favorability ratings of elected officials in Wisconsin and the percentage of respondents who haven’t heard enough or say they don’t know.
About the Marquette Law School Poll
The Marquette Law School Poll is the most extensive statewide polling project in Wisconsin history. This poll interviewed 1,000 registered Wisconsin voters by landline or cell phone from Feb. 19-23, 2020. The margin of error is +/-3.6 percentage points for the full sample.
The Democratic presidential candidate preference items were asked of those who said they would vote in the Democratic primary. That sample size is 464, with a margin of error of +/-5.1 percentage points.
Three questions were asked of half the sample (Form A), and three were asked of the other half-sample (Form B). Questions on Form A have a sample size of 500 and a margin of error of +/- 5.2 percentage points. Questions on Form B have a sample size of 500 and a margin of error of +/- 5.1 percentage points.
Form A questions were approval of the state legislature, condition of the state budget and how to conduct redistricting. Form B questions concerned abortion, undocumented immigrants, and same-sex marriage.
The partisan makeup of the sample, including those who lean to a party, is 45 percent Republican, 44 percent Democratic and 9 percent independent. The partisan makeup of the sample, excluding those who lean to a party, is 31 percent Republican, 29 percent Democratic and 39 percent independent.
Since January 2017, the long-term partisan balance, including those who lean to a party, in the Marquette Law School Poll has been 45 percent Republican and 44 percent Democratic, with 9 percent independent. Partisanship, excluding those who lean, has been 30 percent Republican and 28 percent Democratic, with 40 percent independent.
The entire questionnaire, methodology statement, full results and breakdowns by demographic groups are available at law.marquette.edu/poll/results-and-data.