
New Marquette Law School Poll national survey finds inflation and cost of living the most important issue; economy next most important
Also:
- Concern over Iran war has declined even as assessments of the war have turned more negative
- Views of the cost of living, personal well-being, and the economy are negative, though slightly improved from May
- President Trump’s overall job approval rises 2 points since June, but approval of Trump’s work on inflation, the economy, Iran war, and gas prices at 30% or less
- Democrats have a slight lead on the generic congressional vote among registered voters but a larger advantage with likely voters
- Opinion of Israel and of military aid to Israel is negative, especially among younger adults and Democrats
- People continue to oppose data centers and think AI will be bad for society
MILWAUKEE — A new Marquette Law School Poll national survey finds inflation and the cost of living is rated the most important issue by 35% of the public. This has been the top issue for the public in each Marquette poll this year.
The national economy is the next highest rated, with 15% saying it is the most important issue. The war with Iran is chosen by 10%, a decline from April, when 24% said it was the most important issue. Medicare and Social Security is tied for fourth place with the proposed SAVE America Act dealing with voting procedures, at 9% each. A three-way tie then follows, at 5% each, among health care, immigration and border security, and affordability of housing; the rating of immigration and border security has declined from 14% in January. Rounding out the list, crime is most important to 2% and abortion policy to 1% of adults.
The full list, for each poll this year, is shown in Table 1. (All results in the tables are stated as percentages.)
Table 1: Most important issue
Among adults
| Issue | ||||
| July | May | April | January | |
| Inflation and the cost of living | 35 | 37 | 30 | 38 |
| The economy | 15 | 19 | 15 | 17 |
| The war between Iran, Israel and the United States | 10 | 16 | 24 | NA |
| Medicare & Social Security | 9 | 7 | 6 | 9 |
| The proposed SAVE America Act | 9 | NA | NA | NA |
| Health care | 5 | 5 | 5 | 8 |
| Immigration and border security | 5 | 6 | 7 | 14 |
| Affordability of housing | 5 | NA | NA | NA |
| Crime | 2 | 2 | 3 | 2 |
| Abortion policy | 1 | 2 | 2 | 3 |
| The size of the federal deficit | NA | 2 | 3 | 3 |
| The war between Russia and Ukraine | NA | NA | NA | 1 |
| Marquette Law School Poll, national surveys, latest: July 22-29, 2026 | ||||
| Question: Which one of the following issues matters MOST to you right now? | ||||
The survey was conducted July 22-29, 2026, interviewing 1,076 adults nationwide, with a margin of error of +/-3.2 percentage points. For registered voters, the sample size is 886, with a margin of error of +/-3.5. For likely voters, the sample size is 572, with a margin of error of +/-4.4 percentage points.
The importance of economic issues is apparent when considering what issue people consider their second-most important issue. Once more, inflation and the cost of living, and the economy, top the list of second-most important issues, with the Iran war remaining ranked third on the list. Concern for health care moves up to 11% as the second-greatest concern. Other issues remain in single digits, as shown in Table 2.
Table 2: Most important and second-most important issue
Among adults
| Issue | ||
| Most important | 2nd most important | |
| Inflation and the cost of living | 35 | 21 |
| The economy | 15 | 18 |
| The war between Iran, Israel and the United States | 10 | 14 |
| Medicare & Social Security | 9 | 8 |
| The proposed SAVE America Act | 9 | 4 |
| Health care | 5 | 11 |
| Immigration and border security | 5 | 8 |
| Affordability of housing | 5 | 8 |
| Crime | 2 | 3 |
| Abortion policy | 1 | 3 |
| Marquette Law School Poll, national survey, July 22-29, 2026 | ||
| Question: Which one of the following issues matters MOST to you right now? | ||
| Question: And which is the second-most important issue to you right now? | ||
Changes in multiple measures of economic circumstances since January explain why the cost of living and concern over the economy continue to top the list of most important concerns. Most of these measures also show slight improvements from May to July, although on all measures circumstances are worse than they were in January. An exception to small recent improvement is family financial situation, which worsened from May to July.
Increases in the price of groceries and gasoline are important elements affecting the cost of living, with perceived prices rising over the past six months. Gasoline prices have been especially volatile since the start of the Iran war. In January, prior to the start of the war, 50% said gas prices had gone down either a lot or a little, and only 7% said they had gone up a lot. This changed dramatically in April, with 75% saying gas prices had gone up a lot, and only 2% thinking they had gone down. Perception of rising gas prices peaked in May, with 80% saying they were up a lot. In July, a smaller percentage of people (57%) said prices were up a lot over the last six months, with 11% saying the prices were stable and 8% saying prices had declined. These perceptions track with average prices reported by AAA, which show prices declining from May through early July, though with a new surge in prices as this survey was commencing interviews.
Perception of grocery prices has not been as volatile as for gasoline, but in July, 48% say grocery prices are up a lot over the last 6 months, with 31% saying they are up a little, 15% saying they are stable and 6% thinking they have gone down.
In total on these cost-of-living measures, 81% say the price at the pump is up a little or a lot, and 79% say the price of groceries at the checkout line is up a little or a lot. The perceptions of prices are shown in Table 3.
Table 3: Change in price of gasoline and groceries
Among adults
| Poll dates | Price change | ||||
| Gone down a lot | Gone down a little | Stayed about the same | Gone up a little | Gone up a lot | |
| Gasoline | |||||
| 7/22-29/26 | 1 | 7 | 11 | 24 | 57 |
| 5/20-26/26 | 1 | 1 | 3 | 15 | 80 |
| 4/8-16/26 | 1 | 1 | 5 | 18 | 75 |
| 1/21-28/26 | 14 | 36 | 29 | 14 | 7 |
| Groceries | |||||
| 7/22-29/26 | 1 | 5 | 15 | 31 | 48 |
| 5/20-26/26 | 1 | 3 | 11 | 32 | 53 |
| 4/8-16/26 | 1 | 3 | 14 | 32 | 50 |
| 1/21-28/26 | 2 | 9 | 19 | 30 | 40 |
| Marquette Law School Poll, national surveys, latest: July 22-29, 2026 | |||||
| Question: How has the price you pay for gasoline changed over the last six months? | |||||
| Question: How has the price you pay for groceries changed over the last six months? | |||||
The public has pessimistic expectations of inflation over the next 12 months, with 69% saying inflation will increase, 19% saying it will remain the same, and 13% expecting a decline. Over the course of 2026, the percentage expecting an increase in inflation rose from January through May, with a slight reduction in July, as shown in Table 4.
Table 4: Outlook for inflation in next 12 months
Among adults
| Poll dates | Change in inflation | ||
| Increase | Stay about the same | Decrease | |
| 7/22-29/26 | 69 | 19 | 13 |
| 5/20-26/26 | 71 | 16 | 13 |
| 4/8-16/26 | 70 | 18 | 13 |
| 1/21-28/26 | 61 | 19 | 19 |
| Marquette Law School Poll, national surveys, latest: July 22-29, 2026 | |||
| Question: Over the next 12 months do you think inflation and the cost of living will increase, decrease or stay about the same? | |||
The percentage saying they are better off than a year ago has declined from 28% in January to 19% in July, with those saying their circumstances are about the same as a year ago rising from 37% to 44%. Those saying they are worse off show a small increase from 34% to 37%. This measure of well-being is shown in Table 5.
Table 5: Better or worse off than a year ago
Among adults
| Poll dates | Better or worse | ||
| Better | About the same | Worse | |
| 7/22-29/26 | 19 | 44 | 37 |
| 5/20-26/26 | 19 | 39 | 41 |
| 4/8-16/26 | 20 | 42 | 38 |
| 1/21-28/26 | 28 | 37 | 34 |
| Marquette Law School Poll, national surveys, latest: July 22-29, 2026 | |||
| Question: Would you say you personally are better off, about the same, or worse off than you were a year ago? | |||
People’s description of their family’s financial situation took a negative turn in July, with the percent saying they are living comfortably declining 10 percentage points from 43% in June to 33% in late July. The total is down 7 percentage points since January. Those saying they are struggling also increased to 21% in July, up 6 points from both June and January. Those just getting by has remained relatively stable over Marquette Law School Poll surveys this year, with 46% just getting by in July. These trends are shown in Table 6.
Table 6: Family financial situation
Among adults
| Poll dates | Financial situation | ||
| Living comfortably | Just getting by | Struggling | |
| 7/22-29/26 | 33 | 46 | 21 |
| 6/9-15/26 | 43 | 42 | 15 |
| 5/20-26/26 | 36 | 45 | 18 |
| 4/8-16/26 | 35 | 46 | 19 |
| 1/21-28/26 | 40 | 45 | 15 |
| Marquette Law School Poll, national surveys, latest: July 22-29, 2026 | |||
| Question: Thinking about your family’s financial situation, would you say you are living comfortably, just getting by, or struggling to make ends meet? | |||
Views of the national economy improved slightly from May to July, though they are more negative than in January. In July, 28% say the economy is excellent or good, up from 26% in May but down from 35% in January. Those saying the economy is not so good rose by 1 percentage point from 45% in May to 46% in July. That is up from 40% in January. Those saying the economy is poor rose from January through May, but declined 4 points to 26% in July, as shown in Table 7.
Table 7: State of the economy
Among adults
| Poll dates | Economy | ||
| Excellent/Good | Not so good | Poor | |
| 7/22-29/26 | 28 | 46 | 26 |
| 5/20-26/26 | 26 | 45 | 30 |
| 4/8-16/26 | 25 | 46 | 30 |
| 1/21-28/26 | 35 | 40 | 25 |
| Marquette Law School Poll, national surveys, latest: July 22-29, 2026 | |||
| Question: How would you describe the state of the nation’s economy these days? | |||
Concern for health care is well down the list of most important problems, though it rises to fourth place among the second-most important problems. The expiration of federal tax credits for insurance purchased through Affordable Care Act exchanges is unpopular with the public. Sixty-nine percent say the tax credits should have been extended, while 31% say Congress should have let them expire. Opinion on this has been stable since January, as shown in Table 8.
Table 8: Affordable Care Act tax credit extension
Among adults
| Poll dates | Extend credits | |
| Extend the increased credits | Let the credits expire | |
| 7/22-29/26 | 69 | 31 |
| 5/20-26/26 | 71 | 29 |
| 1/21-28/26 | 71 | 28 |
| Marquette Law School Poll, national surveys, latest: July 22-29, 2026 | ||
| Question: In 2021 Congress increased tax credits that help reduce the cost of health insurance purchased through the Affordable Care Act’s marketplace. Those increased credits expired at the end of 2025. Do you think Congress should extend the increased credits, or should not extend them? | ||
War with Iran
The July Marquette Law School survey finds a public deeply unhappy with the war with Iran. While the percentage of people rating the war as their top concern declined from 24% in April to 10% in July, this has not been accompanied by a more positive view of the war.
Just 12% say the United States has achieved its goals in the Iran war, which is down from 21% in April, while 88% say the goals have not been achieved. Here the public has become steadily less positive in each poll since April, as shown in Table 9.
Table 9: Has U.S. achieved its goals in war with Iran
Among adults
| Poll dates | Achieved goals | |
| Has achieved its goals | Has not achieved its goals | |
| 7/22-29/26 | 12 | 88 |
| 5/20-26/26 | 18 | 81 |
| 4/8-16/26 | 21 | 78 |
| Marquette Law School Poll, national surveys, latest: July 22-29, 2026 | ||
| Question: Has the U.S. achieved its goals in the Iran war? | ||
Seventy-five percent say the Iran war has not been worth the cost, with 25% saying it is worth the cost. This is a slight change from May, as shown in Table 10.
Table 10: Has the Iran war been with the cost
Among adults
| Poll dates | War worth the cost | |
| Worth the cost | Not worth the cost | |
| 7/22-29/26 | 25 | 75 |
| 5/20-26/26 | 28 | 72 |
| Marquette Law School Poll, national surveys, latest: July 22-29, 2026 | ||
| Question: Has the Iran war been worth the cost? | ||
Perception of the degree to which Iran has increased or decreased control over the Strait of Hormuz is less lopsided, with 41% saying Iran has more control than before the war, while 30% think it has less control and 29% say control over the strait has not changed. This question, which has not been previously asked, is shown in Table 11.
Table 11: Does Iran have more or less control of Strait of Hormuz
Among adults
| Poll dates | Amount of control | ||
| More control | Less control | Hasn’t been any change | |
| 7/22-29/26 | 41 | 30 | 29 |
| Marquette Law School Poll, national surveys, latest: July 22-29, 2026 | |||
| Question: Compared to before the war with Iran began, do you think Iran now has (more) control over shipping through the Strait of Hormuz, or (less) control over shipping or hasn’t there been any change? | |||
The on-again-off-again bombing campaign against Iran, together with Iran’s strikes against U.S. and allied targets, is seen as making a peace agreement less likely by 72% of adults, while 28% think the bombing can improve chances of a peace agreement. Table 12 shows these results.
Table 12: Does renewed bombing make peace agreement more or less likely
Among adults
| Poll dates | More or less likely | |
| Make an agreement more likely | Make an agreement less likely | |
| 7/22-29/26 | 28 | 72 |
| Marquette Law School Poll, national surveys, latest: July 22-29, 2026 | ||
| Question: In July, Iran and the United States resumed missile and bombing attacks over control of the Strait of Hormuz. Do you think this renewed fighting will make peace negotiations more likely to reach an agreement, or will the fighting make an agreement less likely? | ||
Presidential approval
The modest improvements in most economic perceptions, including gas and grocery prices, from May to July is accompanied by a modest improvement in approval of how President Donald Trump is handling his job as president. In July, 40% approve and 60% disapprove of how Trump is doing as president. In May, 38% approved and 62% disapproved.
Trump’s approval declined steadily throughout his second term until this improvement in July. His rating started at 48% approval and 52% disapproval in February 2025, with approval falling to the high 30s from April through June, as shown in Table 13.
Table 13: Trump approval
Among adults
| Poll dates | Approval | |
| Approve | Disapprove | |
| 7/22-29/26 | 40 | 60 |
| 6/9-15/26 | 38 | 62 |
| 5/20-26/26 | 38 | 62 |
| 4/8-16/26 | 39 | 60 |
| 1/21-28/26 | 42 | 58 |
| 11/5-12/25 | 43 | 57 |
| 9/15-24/25 | 43 | 57 |
| 7/7-16/25 | 45 | 55 |
| 5/5-15/25 | 46 | 54 |
| 3/17-27/25 | 46 | 54 |
| 1/27-2/6/25 | 48 | 52 |
| Marquette Law School Poll, national surveys, latest: July 22-29, 2026 | ||
| Question: [Donald Trump] Do you have a favorable or an unfavorable opinion of the following people or haven’t you heard enough yet to have an opinion? | ||
The strength with which people approve of Trump has declined through his second term, from 29% strongly approving at the start of his term to 15% in July. Those somewhat approving increased from 19% to 25%. On the disapproval side, there has been a slight increase in somewhat disapproving, as well an increase in strongly disapproving from 40% to 45%, as shown in Table 14. Note the percentages in this table don’t exactly match the previous table due to rounding.
Table 14: Trump strength of approval and disapproval
Among adults
| Poll dates | Approval | |||
| Strongly approve | Somewhat approve | Somewhat disapprove | Strongly disapprove | |
| 7/22-29/26 | 15 | 25 | 14 | 45 |
| 6/9-15/26 | 16 | 22 | 15 | 47 |
| 5/20-26/26 | 16 | 22 | 17 | 45 |
| 4/8-16/26 | 17 | 22 | 12 | 48 |
| 1/21-28/26 | 19 | 23 | 14 | 44 |
| 11/5-12/25 | 21 | 22 | 13 | 44 |
| 9/15-24/25 | 23 | 20 | 16 | 40 |
| 7/7-16/25 | 23 | 22 | 11 | 44 |
| 5/5-15/25 | 24 | 22 | 13 | 41 |
| 3/17-27/25 | 26 | 20 | 13 | 41 |
| 1/27-2/6/25 | 29 | 19 | 12 | 40 |
| Marquette Law School Poll, national surveys, latest: July 22-29, 2026 | ||||
| Question: [Donald Trump] Do you have a favorable or an unfavorable opinion of the following people or haven’t you heard enough yet to have an opinion? | ||||
Approval of how Trump is handling specific issues varies from relatively high approval on border security and immigration to very low approval ratings on inflation and gas prices. Approval has trended downward on all these issues since early in his second term, with less decline on the border and immigration issues and sharper declines on the economy and inflation. Approval of Trump’s handling of foreign policy and tariffs has also declined, while views of his handling of the Iran war and gas prices are too recent to have clear trends. These trends in approval are shown in Figure 1 and in Table 15.
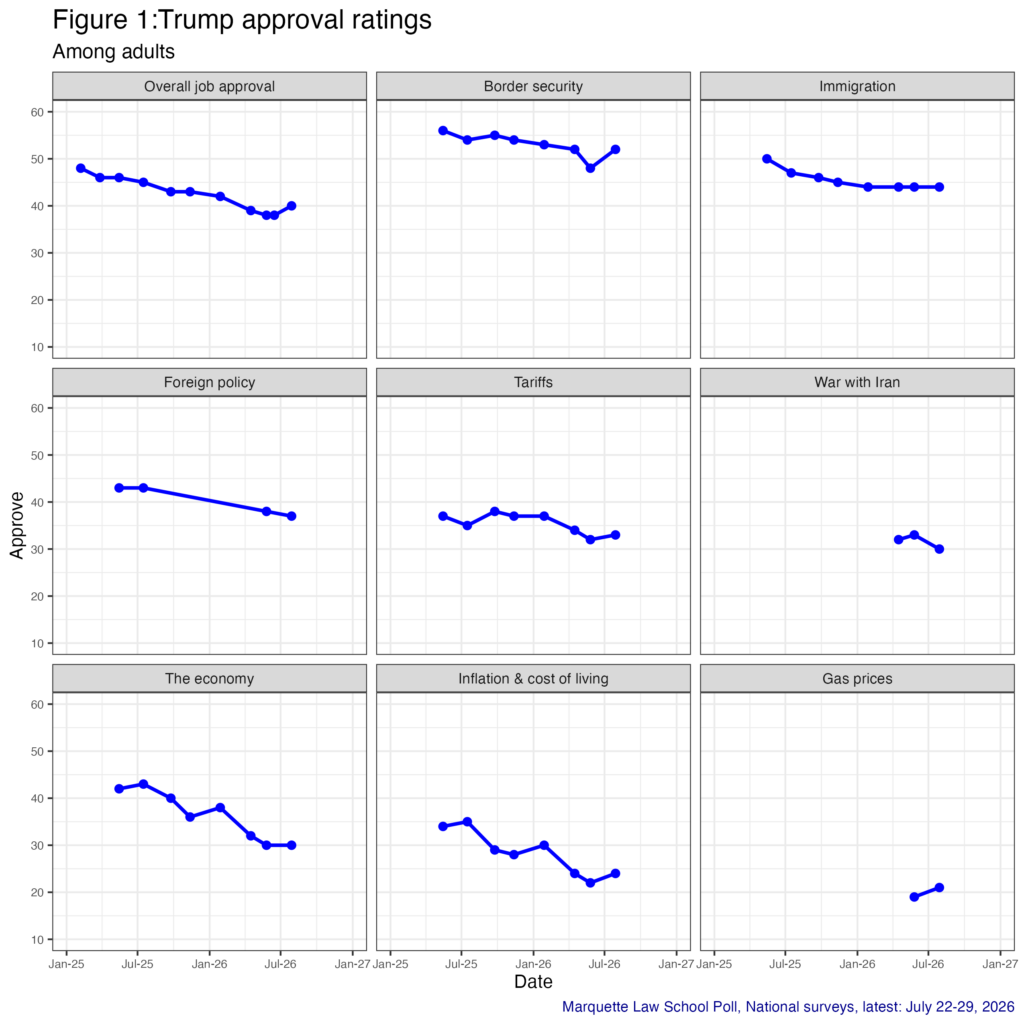
Table 15: Trump approval ratings
Among adults
| Date | Approval percentage | ||||||||
| Overall job approval | The economy | Inflation & cost of living | Immigration | Border security | Tariffs | War with Iran | Gas prices | Foreign policy | |
| 7/22-29/26 | 40 | 30 | 24 | 44 | 52 | 33 | 30 | 21 | 37 |
| 6/9-15/26 | 38 | NA | NA | NA | NA | NA | NA | NA | NA |
| 5/20-26/26 | 38 | 30 | 22 | 44 | 48 | 32 | 33 | 19 | 38 |
| 4/8-16/26 | 39 | 32 | 24 | 44 | 52 | 34 | 32 | NA | NA |
| 1/21-28/26 | 42 | 38 | 30 | 44 | 53 | 37 | NA | NA | NA |
| 11/5-12/25 | 43 | 36 | 28 | 45 | 54 | 37 | NA | NA | NA |
| 9/15-24/25 | 43 | 40 | 29 | 46 | 55 | 38 | NA | NA | NA |
| 7/7-16/25 | 45 | 43 | 35 | 47 | 54 | 35 | NA | NA | 43 |
| 5/5-15/25 | 46 | 42 | 34 | 50 | 56 | 37 | NA | NA | 43 |
| 3/17-27/25 | 46 | NA | NA | NA | NA | NA | NA | NA | NA |
| 1/27-2/6/25 | 48 | NA | NA | NA | NA | NA | NA | NA | NA |
| Marquette Law School Poll, National surveys, latest: July 22-29, 2026 | |||||||||
| Question: Overall, how much do you approve or disapprove of the way Donald Trump is handling his job as president? | |||||||||
| Question: Overall, how much do you approve or disapprove of the way Donald Trump is handling each of the following issues? | |||||||||
Approval of Trump’s handling of his job varies dramatically in line with the news sources to which people turn, due to both the content and the self-selected audience of each news organization. The audience of Newsmax gives the president an 85% job approval rating, followed by the Fox News audience at 68% approval. Among those who get news from podcasts, 58% approve of Trump. All other news source audiences give approval ratings below 50%, ranging from 47% for listeners of local radio to 14% approval from the MS Now (formerly MSNBC) audience. This wide range is a clear portrayal of how much news audiences are segmented along partisan lines. The full results are shown in Table 16.
Table 16: Trump approval, by news source
Among adults
| News source | Approval | ||
| Monthly audience | Approve | Disapprove | |
| Among all adults | NA | 40 | 60 |
| Newsmax | 6 | 85 | 15 |
| Fox news | 29 | 68 | 32 |
| Podcasts | 10 | 58 | 42 |
| Local radio station | 24 | 47 | 53 |
| Local TV news | 51 | 41 | 59 |
| Social media | 41 | 39 | 61 |
| Local newspaper | 26 | 35 | 65 |
| CBS News | 17 | 34 | 66 |
| NBC News | 18 | 29 | 71 |
| ABC News | 21 | 28 | 72 |
| National newspapers | 15 | 26 | 74 |
| CNN | 20 | 23 | 77 |
| BBC | 11 | 22 | 78 |
| NPR/PBS | 16 | 20 | 80 |
| MS Now (MSNBC) | 9 | 14 | 86 |
| Marquette Law School Poll, national survey July 22-29, 2026 | |||
| Question: Overall, how much do you approve or disapprove of the way Donald Trump is handling his job as president? | |||
| Question: Which of the following, if any, have you read, watched, or listened to in the past month for information about political news and current affairs? | |||
As the ranking of inflation as the most important issue has remained the public’s top concern, views of the effects of Trump’s policies on inflation have turned sharply down since his election in 2024. In December 2024, before he returned to office, 41% thought Trump’s policies would decrease inflation. This has declined to 21% in July, while the number of those thinking his policies increase inflation has climbed from 45% in late 2024 to 61% in July. These changes are shown in Table 17.
Table 17: Effect of Trump policies on inflation
Among adults
| Poll dates | Effect on inflation | ||
| Decrease inflation | Increase inflation | Have no effect on inflation | |
| 7/22-29/26 | 21 | 61 | 18 |
| 5/20-26/26 | 22 | 61 | 18 |
| 4/8-16/26 | 23 | 62 | 15 |
| 1/21-28/26 | 25 | 60 | 15 |
| 11/5-12/25 | 27 | 60 | 13 |
| 9/15-24/25 | 25 | 60 | 15 |
| 7/7-16/25 | 28 | 60 | 12 |
| 5/5-15/25 | 28 | 61 | 10 |
| 3/17-27/25 | 30 | 58 | 12 |
| 1/27-2/6/25 | 36 | 49 | 15 |
| 12/2-11/24 | 41 | 45 | 14 |
| Marquette Law School Poll, national surveys, latest: July 22-29, 2026 | |||
| Question: Do you think Trump’s policy proposals will decrease inflation, increase inflation, or have no effect on inflation? | |||
While approval of Trump’s handling of most specific issues, including inflation and the economy, has declined through the second term, general trust in him to make the right decisions for the country has shifted by only 5 percentage points, from 45% in May 2025 to 40% in July. The percentage of people who do not trust his decisions has risen from 55% to 60%. These numbers are in keeping with his overall job approval rating. This is shown in Table 18.
Table 18: Trust Trump to make the right decisions for the country
Among adults
| Poll dates | Trust Trump’s decisions | |
| Completely/mostly trust | Completely/mostly do not trust | |
| 7/22-29/26 | 40 | 60 |
| 5/20-26/26 | 40 | 60 |
| 4/8-16/26 | 39 | 61 |
| 11/5-12/25 | 42 | 58 |
| 9/15-24/25 | 43 | 57 |
| 7/7-16/25 | 45 | 55 |
| 5/5-15/25 | 45 | 55 |
| Marquette Law School Poll, national surveys, latest: July 22-29, 2026 | ||
| Question: Regardless of specific policies, how much do you trust Donald Trump to make the right decisions for the country? | ||
Topics in the news
In July, the public was hearing the most news about the war with Iran, closely followed by the World Cup, with 69% and 67% respectively hearing a lot about these two topics. Less than 10% heard nothing about either.
For other topics, much less news was consumed. Thirty-four percent heard a lot about the end of Graham Platner’s campaign for the Senate in Maine, and 33% heard a lot about the SAVE America Act, which Trump has attempted to get passed by Congress. Attention falls to 28% who heard a lot about the Trump family making some $2.2 billion in 2025. Of the bipartisan congressional achievement, passing a housing bill, only 20% heard a lot, as Trump cancelled a signing ceremony and ultimately let the bill become law without his signature. The bill had been expected to be a centerpiece achievement cited in congressional campaigns in the fall, but 45% heard nothing at all about it. These results are shown in Table 19.
Table 19: Attention to topics in the news
Among adults
| Item | Heard or read | ||
| A lot | A little | Nothing at all | |
| The U.S. war with Iran | 69 | 26 | 5 |
| The World Cup | 67 | 25 | 8 |
| Maine U.S. Senate candidate Graham Platner withdrew from the race following reports he sexually assaulted a woman in 2021 | 34 | 29 | 37 |
| The proposed SAVE America Act | 33 | 36 | 31 |
| Reports that the Trump family made $2.2 billion in 2025 | 28 | 31 | 40 |
| Congress passed a housing bill which President Trump declined to sign, but did not veto, so the bill became law | 20 | 35 | 45 |
| Marquette Law School Poll, national survey: July 22-29, 2026 | |||
| Question: Here are some recent topics in the news. How much have you heard or read about each of these? | |||
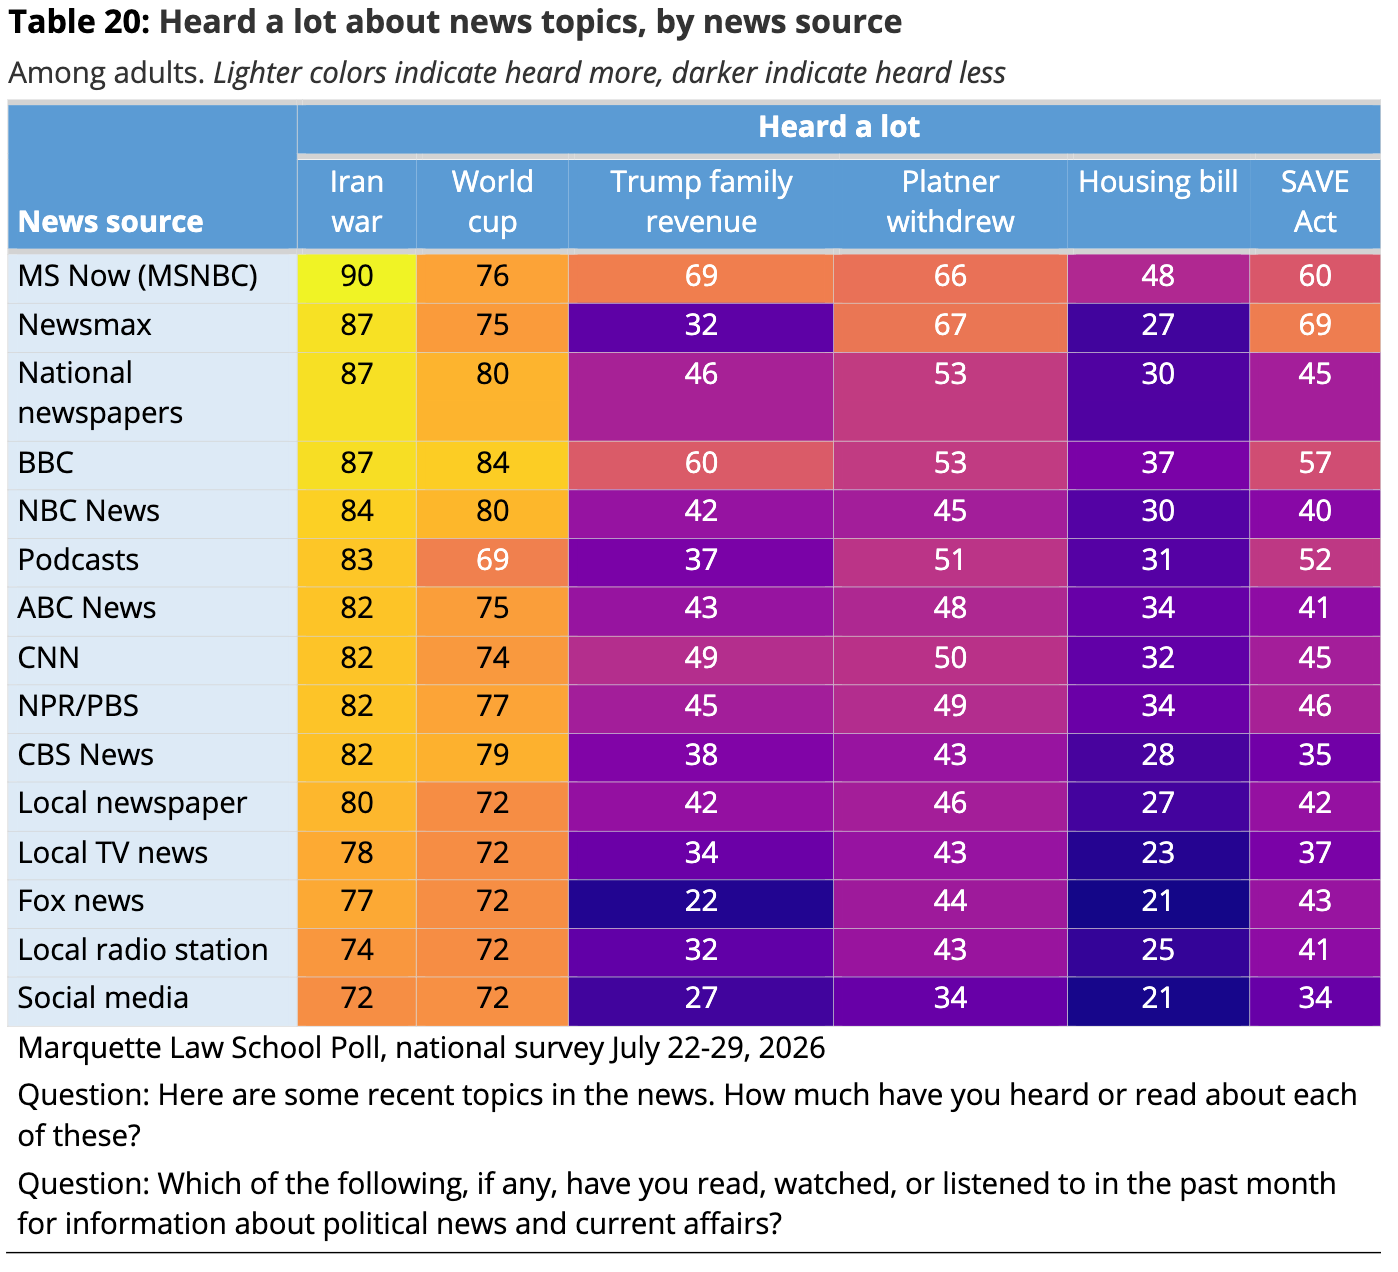
Which topics receive a lot of attention varies with news source. Regardless of news source, the Iran war and the World Cup were much more visible to the public than any of the other topics. Still, in some instances, there was little variation across source; for example, 90% of the MS Now audience heard a lot about the Iran war, as did 87% of the Newsmax audience. These two audiences are far apart in Table 16 in approval of Trump but are very close when it comes to attention to the Iran war coverage and some other topics. Audiences for local TV news, Fox News, local radio, and social media heard less about the war. The audiences heard similar amounts about the World Cup regardless of source, with the notable exception that viewers of the BBC said they heard the most.
There is more variation in the amount heard about other topics across news sources.
- Trump family income reports were most likely to be heard by the MS Now audience, and least likely to be heard by the Fox News audience, with quite a bit of variation in between.
- Platner’s withdrawal received the most attention from the audiences of MS Now and Newsmax, and least from those getting their news from social media.
- The housing bill received little attention by the audiences for every news source. The most attention was among the MS Now audience, with the Fox News and social media audiences hearing the least.
- Attention to the SAVE Act varies considerably, with audiences of Newsmax and MS Now hearing the most and social media the least.
These data are shown in Table 20, with the cells shaded to make differences more apparent.
Congressional generic ballot
In the November congressional elections among registered voters, 46% say they will vote for the Democratic candidate and 44% for the Republican candidate. Among likely voters, those who say they are certain they will vote, the Democratic advantage expands to 51% to 45% for the Republican candidate. This difference between registered and likely voters has been a persistent feature of the congressional vote throughout the year, with variation in the size of the margins, as seen in Table 21.
Table 21: Congressional generic ballot
Among registered and likely voters
| Poll dates | Generic ballot | ||||
| Dem minus Rep margin | Democratic candidate | Republican candidate | Neither | Would not vote | |
| Registered voters | |||||
| 7/22-29/26 | 2 | 46 | 44 | 8 | 2 |
| 6/9-15/26 | 2 | 47 | 45 | 6 | 2 |
| 5/20-26/26 | 1 | 46 | 45 | 7 | 1 |
| 4/8-16/26 | 4 | 48 | 44 | 6 | 1 |
| 1/21-28/26 | 4 | 48 | 44 | 7 | 1 |
| Likely voters | |||||
| 7/22-29/26 | 6 | 51 | 45 | 4 | 0 |
| 6/9-15/26 | 8 | 53 | 45 | 2 | 0 |
| 5/20-26/26 | 1 | 49 | 48 | 4 | 0 |
| 4/8-16/26 | 10 | 53 | 43 | 4 | 0 |
| 1/21-28/26 | 7 | 52 | 45 | 3 | 0 |
| Marquette Law School Poll, national surveys, latest: July 22-29, 2026 | |||||
| Question: If the election for Congress were held today, would you vote for the (Democratic) candidate in your district or the (Republican) candidate in your district? | |||||
Partisan differences in reported certainty of voting account for the differences in vote percentages for Democrats and Republicans. In the July poll, 70% of Democrats say they are certain to vote, compared to 65% of Republicans and just 40% of independents. These differences have been present in each Marquette Law School Poll survey conducted in 2026 but have varied in size, as shown in Table 22.
Table 22: Likelihood of voting (turnout gap)
Among registered voters
| Party ID | Likelihood of voting | |||
| Absolutely certain to vote | Very likely to vote | Chances are 50-50 | Don’t think will vote | |
| 7/22-29/26 | ||||
| Republican | 65 | 21 | 12 | 2 |
| Independent | 40 | 22 | 23 | 13 |
| Democrat | 70 | 16 | 11 | 2 |
| 6/9-15/26 | ||||
| Republican | 68 | 16 | 12 | 4 |
| Independent | 38 | 25 | 21 | 14 |
| Democrat | 76 | 14 | 8 | 3 |
| 5/20-26/26 | ||||
| Republican | 70 | 18 | 10 | 1 |
| Independent | 38 | 28 | 26 | 8 |
| Democrat | 72 | 20 | 8 | 0 |
| 4/8-16/26 | ||||
| Republican | 65 | 20 | 11 | 4 |
| Independent | 33 | 25 | 32 | 9 |
| Democrat | 77 | 14 | 8 | 1 |
| 1/21-28/26 | ||||
| Republican | 70 | 18 | 11 | 1 |
| Independent | 41 | 26 | 26 | 7 |
| Democrat | 72 | 17 | 7 | 4 |
| Marquette Law School Poll, national surveys, latest: July 22-29, 2026 | ||||
| Question: What are the chances that you will vote in the November 2026 general election for congressional and state offices– are you absolutely certain to vote, very likely to vote, are the chances 50-50, or don’t you think you will vote? | ||||
Similarly, Democrats report greater enthusiasm about the November elections than do Republicans or independents. This enthusiasm also boosts the likelihood of voting and is giving Democrats an edge in the upcoming vote. As with certainty of voting, the enthusiasm gap has varied across polls this year and may shift more as general election campaigns come to dominate advertising and news in the fall. The changes in enthusiasm by party are shown in Table 23.
Table 23: Enthusiastic to vote
Among registered voters
| Party ID | Enthusiasm | |||
| Very enthusiastic | Somewhat enthusiastic | Not too enthusiastic | Not at all enthusiastic | |
| 7/22-29/26 | ||||
| Republican | 30 | 37 | 28 | 5 |
| Independent | 10 | 36 | 39 | 15 |
| Democrat | 38 | 35 | 22 | 4 |
| 5/20-26/26 | ||||
| Republican | 36 | 38 | 20 | 6 |
| Independent | 13 | 30 | 31 | 25 |
| Democrat | 44 | 31 | 21 | 4 |
| 4/8-16/26 | ||||
| Republican | 33 | 38 | 23 | 7 |
| Independent | 13 | 28 | 47 | 12 |
| Democrat | 50 | 29 | 17 | 3 |
| Marquette Law School Poll, national surveys, latest: July 22-29, 2026 | ||||
| Question: How enthusiastic are you about voting in the elections this November for congressional and state offices? | ||||
Views of the parties
Approval of how each party is handling its job in Congress is substantially negative, as it has been all year, with 37% approving of the Republican Party’s performance and 34% approving of the Democrats. Republican approval has held steady since April, while Democratic approval has edged up slightly over the year, as shown in Table 24.
Table 24: Congressional party approval
Among adults
| Poll dates | Approval | ||
| Net approval | Approve | Disapprove | |
| Republicans in Congress | |||
| 7/22-29/26 | -26 | 37 | 63 |
| 5/20-26/26 | -26 | 37 | 63 |
| 4/8-16/26 | -25 | 37 | 62 |
| 1/21-28/26 | -21 | 39 | 60 |
| Democrats in Congress | |||
| 7/22-29/26 | -32 | 34 | 66 |
| 5/20-26/26 | -40 | 30 | 70 |
| 4/8-16/26 | -39 | 30 | 69 |
| 1/21-28/26 | -42 | 29 | 71 |
| Marquette Law School Poll, national surveys, latest: July 22-29, 2026 | |||
| Question: Overall, how much do you approve or disapprove of the way (Republicans)(Democrats) in Congress are handling their job? | |||
Favorability ratings of the parties show similarly negative ratings for both parties, though favorable ratings of the Republican Party have been quite stable through the year. Favorable views of the Democratic Party have increased modestly, reducing the size of the Republican advantage in net favorability since January, as shown in Table 25.
Table 25: Party favorability
Among adults
| Poll dates | Favorability | ||
| Net favorable | Favorable | Unfavorable | |
| The Republican Party | |||
| 7/22-29/26 | -19 | 39 | 58 |
| 5/20-26/26 | -22 | 38 | 60 |
| 4/8-16/26 | -20 | 38 | 58 |
| 1/21-28/26 | -19 | 38 | 57 |
| The Democratic Party | |||
| 7/22-29/26 | -23 | 37 | 60 |
| 5/20-26/26 | -25 | 36 | 61 |
| 4/8-16/26 | -28 | 34 | 62 |
| 1/21-28/26 | -30 | 33 | 63 |
| Marquette Law School Poll, national surveys, latest: July 22-29, 2026 | |||
| Question: Do you have a. favorable or an unfavorable opinion of the following or haven’t you heard enough yet to have an opinion? | |||
About a quarter of adults have unfavorable views of both parties. This percentage has varied modestly over the second Trump term, from a low of 22% to a high of 29%, standing at 25% in July. In each survey except one, more voters have been favorable to the Republicans and unfavorable to the Democrats than have been positive to Democrats and negative to Republicans. A small percentage say they like both parties. These results are shown in Table 26.
Table 26: Dislike of both parties
Among adults
| Poll dates | Views of both parties | |||
| Fav Dem, Fav Rep | Fav Dem, Unfav Rep | Unfav Dem, Fav Rep | Unfav Dem, Unfav Rep | |
| 7/22-29/26 | 4 | 32 | 35 | 25 |
| 5/20-26/26 | 5 | 30 | 32 | 29 |
| 4/8-16/26 | 5 | 28 | 33 | 29 |
| 1/21-28/26 | 3 | 29 | 35 | 27 |
| 11/5-12/25 | 4 | 35 | 35 | 22 |
| 9/15-24/25 | 6 | 27 | 37 | 27 |
| 7/7-16/25 | 6 | 27 | 34 | 28 |
| 5/5-15/25 | 4 | 27 | 37 | 26 |
| 3/17-27/25 | 8 | 26 | 38 | 24 |
| Marquette Law School Poll, national surveys, latest: July 22-29, 2026 | ||||
| Question: Do you have a favorable or an unfavorable opinion of the following or haven’t you heard enough yet to have an opinion? | ||||
Favorability to the MAGA movement has declined through Trump’s second term, with unfavorable views rising. Thirty-five percent have favorable views of MAGA, a little worse than Trump’s 40% job approval, and just slightly worse than the 38% who have a favorable view of Trump. The percentage is also below the 39% favorability of the Republican Party. The results are shown in Table 27.
Table 27: Favorability to MAGA
Among adults
| Poll dates | Favorability | ||
| Net favorable | Favorable | Unfavorable | |
| 7/22-29/26 | -26 | 35 | 61 |
| 5/20-26/26 | -27 | 35 | 62 |
| 4/8-16/26 | -28 | 34 | 62 |
| 1/21-28/26 | -25 | 35 | 60 |
| 11/5-12/25 | -18 | 39 | 57 |
| 9/15-24/25 | -21 | 37 | 58 |
| 7/7-16/25 | -19 | 38 | 57 |
| 5/5-15/25 | -15 | 40 | 55 |
| 3/17-27/25 | -14 | 41 | 55 |
| Marquette Law School Poll, national surveys, latest: July 22-29, 2026 | |||
| Question: [The MAGA movement} Do you have a favorable or an unfavorable opinion of the following or haven’t you heard enough yet to have an opinion? | |||
The rise of democratic socialist candidates in Democratic primaries this year has boosted the prominence of this political identification. Previous Marquette Law School Poll surveys have found that almost a third of adults say they don’t know enough about the Democratic Socialists of America (DSA) organization to say if they have a favorable or unfavorable view. This fell to 22% without an opinion in the July poll, following recent democratic socialist victories in primaries in New York and Colorado. In July, 24% have a favorable opinion of DSA, while 54% are unfavorable.
As more candidates describe themselves as democratic socialists, without necessarily saying they are members of, or represent, the DSA organization, this poll sought to see whether voters respond differently to the DSA organization than to the “democratic socialist” identification of a candidate. To do so, the sample was divided into two random half-samples, with one half asked about “Democratic Socialists of America” and the other half asked about “democratic socialist candidates.” More people offer an opinion of democratic socialist candidates than of the DSA organization and are a bit more favorable to the candidate label than to the DSA organization, 31% to 24%. As such candidates become more common and voters more familiar with the label, the percentages holding either positive or negative views are likely to increase. The comparison of the candidate label and the DSA is shown in Table 28, along with the trend in opinion of DSA.
Table 28: Favorability to democratic socialists
Among adults
| Poll dates | Favorablity | |||
| Net favorable | Favorable | Unfavorable | Haven’t heard enough | |
| Democratic socialist candidates | ||||
| 7/22-29/26 | -22 | 31 | 53 | 16 |
| Democratic Socialists of America | ||||
| 7/22-29/26 | -30 | 24 | 54 | 22 |
| 5/20-26/26 | -27 | 21 | 48 | 31 |
| 4/8-16/26 | -28 | 20 | 48 | 32 |
| Marquette Law School Poll, national surveys, latest: July 22-29, 2026 | ||||
| Question: [Democratic socialist candidates] Do you have a favorable or an unfavorable opinion of the following or haven’t you heard enough yet to have an opinion? | ||||
| Question: [Democratic Socialists of America] Do you have a favorable or an unfavorable opinion of the following or haven’t you heard enough yet to have an opinion? | ||||
Favorability toward several Democratic Party figures from the progressive or socialist wing of the party is shown in Table 29. Net favorability is highest for Vermont Sen. Bernie Sanders, who is also the best known, followed by New York Mayor Zohran Mamdani, though considerably more people lack an opinion of him. Former Transportation Secretary Pete Buttigieg is least well known and has slightly higher net favorability rating than New York Rep. Alexandria Ocasio-Cortez. All four have net negative favorability ratings, as is increasingly common for national political figures of both parties.
Table 29: Favorability to Democratic political figures
Among adults
| Political figure | Favorability | |||
| Net favorability | Favorable | Unfavorable | Haven’t heard enough | |
| Bernie Sanders | -2 | 45 | 47 | 8 |
| Zohran Mamdani | -6 | 33 | 39 | 28 |
| Pete Buttigieg | -10 | 27 | 37 | 37 |
| Alexandria Ocasio-Cortez | -11 | 32 | 43 | 25 |
| Marquette Law School Poll, national survey, July 22-29, 2026 | ||||
| Question: Do you have a favorable or an unfavorable opinion of the following people or haven’t you heard enough yet to have an opinion? | ||||
Favorability ratings of Republican administration officials are also all net negative, with variation in how well known these figures are. Trump and Vice President JD Vance are best known, and share the same 38% favorable rating, though Vance is seen less unfavorably than Trump. Secretary of Defense Pete Hegseth is the least well known, despite his role in the Iran war, with 32% saying they lack an opinion of him. Nonetheless he ties with Trump for the most-negative net favorability. Secretary of State Marco Rubio has the best net favorability rating, at -11 percentage points, but is also unfamiliar to 21% of adults. These ratings are shown in Table 30.
Table 30: Favorability to Republican political figures
Among adults
| Political figure | Favorability | |||
| Net favorability | Favorable | Unfavorable | Haven’t heard enough | |
| Marco Rubio | -11 | 34 | 45 | 21 |
| JD Vance | -16 | 38 | 54 | 8 |
| Donald Trump | -22 | 38 | 60 | 2 |
| Pete Hegseth | -22 | 23 | 45 | 32 |
| Marquette Law School Poll, national survey, July 22-29, 2026 | ||||
| Question: Do you have a favorable or an unfavorable opinion of the following people or haven’t you heard enough yet to have an opinion? | ||||
Opinions concerning Israel
Opinions of Israel have turned substantially negative since March 2025, with net favorability falling from an even balance of 0 to a -24 net rating. Unfavorable opinion has increased from 43% to 55% in the wake of the war in Gaza and the Iran war. This is shown in Table 31.
Table 31: Favorability to Israel
Among adults
| Poll dates | Favorability | |||
| Net favorability | Favorable | Unfavorable | Haven’t heard enough | |
| 7/22-29/26 | -24 | 31 | 55 | 14 |
| 4/8-16/26 | -21 | 33 | 54 | 14 |
| 11/5-12/25 | -13 | 35 | 48 | 17 |
| 9/15-24/25 | -13 | 36 | 49 | 15 |
| 3/17-27/25 | 0 | 43 | 43 | 14 |
| Marquette Law School Poll, national survey, July 22-29, 2026 | ||||
| Question: Do you have a favorable or an unfavorable opinion of the following or haven’t you heard enough yet to have an opinion? | ||||
Underlying the declining opinion of Israel are striking differences between the parties and by age within each party. Within each age group, Republicans are more favorable to Israel than independents, who in turn are more favorable than Democrats. At the same time, there is a very large difference in opinion by age within each party, with younger people much less favorable than are older people. Within the Democratic Party, unfavorable opinions of Israel have become dominant across all age groups, with only 16% of Democrats over 60 holding a favorable opinion and just 5% favorable among those under 30. While favorability is higher among Republicans, there is a very large 48-percentage-point gap between Republicans under 40, at 29% favorable, and those 60 and older, who have a 77% favorable rating. These comparisons are shown in Table 32.
Table 32: Favorability to Israel, by age and party identification
Among adults
| Age | Favorability | ||
| Favorable | Unfavorable | Haven’t heard enough | |
| Republican | |||
| 18-29 | 29 | 58 | 13 |
| 30-44 | 38 | 49 | 13 |
| 45-59 | 52 | 38 | 10 |
| 60+ | 77 | 20 | 3 |
| Independent | |||
| 18-29 | 0 | 65 | 35 |
| 30-44 | 7 | 61 | 33 |
| 45-59 | 32 | 36 | 32 |
| 60+ | 35 | 49 | 16 |
| Democrat | |||
| 18-29 | 5 | 84 | 12 |
| 30-44 | 10 | 76 | 13 |
| 45-59 | 15 | 65 | 19 |
| 60+ | 16 | 74 | 10 |
| Marquette Law School Poll, national surveys, latest: July 22-29, 2026 | |||
| Question: Do you have a favorable or an unfavorable opinion of the following or haven’t you heard enough yet to have an opinion? | |||
Negative opinions of Israel are also apparent on the question of military aid to that country. Just over half, 52% of adults, say the U.S. is giving too much military aid to Israel, with 32% saying it is the right amount and 16% saying too little. For comparison, a different question asked about U.S. support to Israel during the Gaza conflict. Here the percentage saying the U.S. was giving too much support rose from 28% in November 2023 to 41% in November 2025, when the question was last asked. These comparisons are shown in Table 33.
Table 33: Aid to Israel
Among adults
| Poll dates | Amount of aid | ||
| Too much | Too little | About the right amount | |
| Military aid | |||
| 7/22-29/26 | 52 | 16 | 32 |
| Support for U.S. aid during war in Gaza | |||
| 11/5-12/25 | 41 | 17 | 41 |
| 9/15-24/25 | 42 | 23 | 34 |
| 12/2-11/24 | 40 | 24 | 36 |
| 5/6-15/24 | 41 | 24 | 35 |
| 3/18-28/24 | 37 | 24 | 39 |
| 2/5-15/24 | 42 | 21 | 38 |
| 11/2-7/23 | 28 | 17 | 33 |
| Marquette Law School Poll, national survey, July 22-29, 2026 | |||
| Question: Do you think the United States is providing too much military aid to Israel, not enough aid to Israel, or about the right amount of aid to Israel? | |||
| Question: When it comes to Israel’s war with Hamas in Gaza, do you think the United States is providing too much support to Israel, not enough support to Israel, or about the right amount of support to Israel? | |||
As with favorability, more young people say the U.S. is giving too much military aid to Israel. Republicans are less skeptical of aid than independents and Democrats. But, among Republicans, the percentage saying there is too much military aid reaches 54% among those under 30 and declines to just 16% for those 60 and older. There are only slight age differences among independents, with just about half in each age group saying there is too much aid. Among Democrats, all age groups have large majorities saying there is too much military aid, with modestly more of the young saying so. These results are shown in Table 34.
Table 34: Military aid to Israel, by age and party identification
Among adults
| Age | Amount of aid | ||
| Too much | Too little | About the right amount | |
| Republican | |||
| 18-29 | 54 | 13 | 33 |
| 30-44 | 43 | 20 | 37 |
| 45-59 | 37 | 21 | 41 |
| 60+ | 16 | 18 | 66 |
| Independent | |||
| 18-29 | 52 | 30 | 18 |
| 30-44 | 54 | 17 | 29 |
| 45-59 | 49 | 19 | 32 |
| 60+ | 53 | 22 | 25 |
| Democrat | |||
| 18-29 | 75 | 15 | 10 |
| 30-44 | 75 | 14 | 11 |
| 45-59 | 67 | 14 | 20 |
| 60+ | 69 | 7 | 24 |
| Marquette Law School Poll, national surveys, latest: July 22-29, 2026 | |||
| Question: Do you think the United States is providing too much military aid to Israel, not enough aid to Israel, or about the right amount of aid to Israel? | |||
Data centers
Public doubt about the costs of data centers remains high, as it has been since January in Marquette Law School Poll national surveys. In July, 73% say the costs of data centers outweigh the benefits, with 27% believing the benefits are greater. Since January, there has been an 11-percentage-point increase in those saying the costs are greater than the benefits. A majority of Republicans, 66%, say the costs outweigh the benefits, rising to 72% among independents and 80% among Democrats. The trend in opinion is shown in Table 35.
Table 35: Costs and benefits of data centers
Among adults
| Poll dates | Costs and benefits | |
| Benefits outweigh costs | Costs outweigh benefits | |
| 7/22-29/26 | 27 | 73 |
| 5/20-26/26 | 29 | 71 |
| 4/8-16/26 | 30 | 69 |
| 1/21-28/26 | 37 | 62 |
| Marquette Law School Poll, national survey, July 22-29, 2026 | ||
| Question: Companies are investing billions of dollars around the country in construction of data centers to run artificial intelligence and other applications. Which comes closer to your opinion, even if neither is exactly right: | ||
There is also considerable doubt about whether artificial intelligence, AI, will be good for society, with 70% saying it will be bad. This is closely linked to opinion of data centers. Among those who think AI will be good for society, 59% say the benefits outweigh the costs of data centers. Among those who think AI will be bad for society, 87% say the costs are greater. The recent trend in views of AI is shown in Table 36.
Table 36: Is AI good or bad for society
Among adults
| Poll dates | Good or bad | |
| A good thing | A bad thing | |
| 7/22-29/26 | 30 | 70 |
| 5/20-26/26 | 35 | 65 |
| 4/8-16/26 | 30 | 70 |
| Marquette Law School Poll, national survey, July 22-29, 2026 | ||
| Question: Do you think the development of artificial intelligence (AI) is a good thing for society or a bad thing? | ||
In this survey, 64% say they have used AI in the past month, while 36% say they do not use AI. AI users are more likely than non-users to say AI will be good for society, but, even among users, only 39% say AI will be good and 61% say it will be a bad thing. Among those who do not use AI, 14% think it will be a good thing and 86% say it will be bad for society.
About the Marquette Law School Poll
The survey was conducted July 22-29, 2026, interviewing 1,076 adults nationwide, with a margin of error of +/-3.2 percentage points. For registered voters, the sample size is 886, with a margin of error of +/-3.5. For likely voters, the sample size is 572 with a margin of error of +/-4.4 percentage points.
Interviews were conducted using the SSRS Opinion Panel, a national probability sample with interviews conducted online. Certain other data from this survey (focusing on public views of the Supreme Court) are held for release on Aug. 6. The detailed methodology statement, survey instrument, topline results, and crosstabs for this release are available on the Marquette Law Poll website.