New Marquette Law School Poll national survey finds upturn in approval of U.S. Supreme Court
Majorities support the Court’s decision that states cannot remove Trump from the ballot and oppose a possible Court ruling that would restrict abortion medication drug mifepristone
MILWAUKEE – A new Marquette Law School Poll national survey finds that 47% of adults approve of the job the U.S. Supreme Court is doing, while 53% disapprove. This is the highest approval of the Court since January 2023, when it was also 47% with 53% disapproving. The last time approval was greater than 50% was March 2022, when it was 54%.
In the most recent previous survey, in February 2024, 40% approved and 60% disapproved.
The trend in approval since 2020 is shown in Figure 1 and Table 1. (All results in the tables are stated as percentages; the precise wording of the questions can be found in the online link noted above.)
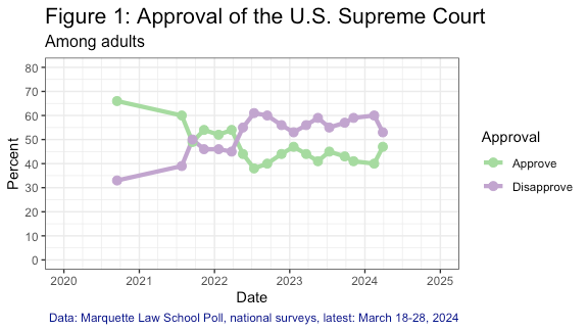
Table 1: U.S. Supreme Court approval
Among adults
| Poll dates | Approval | |
| Approve | Disapprove | |
| 3/18-28/24 | 47 | 53 |
| 2/5-15/24 | 40 | 60 |
| 11/2-7/23 | 41 | 59 |
| 9/18-25/23 | 43 | 57 |
| 7/7-12/23 | 45 | 55 |
| 5/8-18/23 | 41 | 59 |
| 3/13-22/23 | 44 | 56 |
| 1/9-20/23 | 47 | 53 |
| 11/15-22/22 | 44 | 56 |
| 9/7-14/22 | 40 | 60 |
| 7/5-12/22 | 38 | 61 |
| 5/9-19/22 | 44 | 55 |
| 3/14-24/22 | 54 | 45 |
| 1/10-21/22 | 52 | 46 |
| 11/1-10/21 | 54 | 46 |
| 9/7-16/21 | 49 | 50 |
| 7/16-26/21 | 60 | 39 |
| 9/8-15/20 | 66 | 33 |
| Marquette Law School Poll, national surveys, latest March 18-28, 2024 | ||
| Question: Overall, how much do you approve or disapprove of the way the U.S. Supreme Court is handling its job? | ||
In the latest poll, approval rose by 10 percentage points among independents, by 7 points among Republicans, and by 4 points among Democrats. Approval by party is shown in Table 2. (Party identification here and subsequently includes independents who lean to a party as partisans.)
Table 2: Approval of the U.S. Supreme Court, by party identification, February and March 2024
Among adults
| Poll dates | Court approval | |
| Approve | Disapprove | |
| 3/18-28/24 | ||
| Republican | 64 | 36 |
| Independent | 38 | 62 |
| Democrat | 31 | 69 |
| 2/5-15/24 | ||
| Republican | 57 | 43 |
| Independent | 28 | 72 |
| Democrat | 27 | 73 |
| Marquette Law School Poll, national surveys, Feb. 5-15, 2024, and March 18-28, 2024 | ||
| Question: Overall, how much do you approve or disapprove of the way the U.S. Supreme Court is handling its job? | ||
The latest Marquette Law School Poll national Supreme Court survey was conducted March 18-28, 2024. The survey interviewed 1,000 adults nationwide and has a margin of error of +/-4 percentage points.
Cases before the Court
On March 4, the Court ruled that states cannot remove or ban former President Donald Trump from the ballot based on the 14th Amendment’s insurrection clause. The Court was unanimous in the judgment, though divided on the reasoning. A majority of respondents, 56%, favored the Court’s decision, while 39% opposed it and 5% did not know.
To test if unanimity influenced public reaction, a random half of the respondents were asked a question that included “ruled unanimously” and half asked a version that omitted “unanimously.” The wording was:
“On March 4, the U.S. Supreme Court ruled (unanimously) that states cannot bar Donald Trump from election ballots based on the 14th Amendment’s insurrection clause. How much do you favor or oppose this decision?”
The version with “unanimously” had a slightly higher percentage favoring the Court’s decision (3% more), but also saw a higher level of those opposed (6% more), as the percentage saying “don’t know” was 0%, as opposed to 9% in the other version, as shown in Table 3. A majority favored the Court’s ruling, whether the word “unanimously” was included in the question or not.
Table 3: States cannot ban Trump from ballot, by “unanimously” mentioned or not
Among adults
| Favor or oppose decision | |||
| Unanimously mentioned or not | Favor | Oppose | Don’t know |
| Unanimously mentioned | 58 | 42 | 0 |
| Unanimously not mentioned | 55 | 36 | 9 |
| Marquette Law School Poll, national survey, March 18-28, 2024 | |||
| Question: On March 4, the U.S. Supreme Court ruled unanimously that states cannot bar Donald Trump from election ballots based on the 14th Amendment’s insurrection clause. How much do you favor or oppose this decision? | |||
| Question: On March 4, the U.S. Supreme Court ruled that states cannot bar Donald Trump from election ballots based on the 14th Amendment’s insurrection clause. How much do you favor or oppose this decision? | |||
Because the differences are small, we combine the two wordings for an overall measure of approval of this decision. A large majority of Republicans favored the decision, as did a bare majority of independents. Just more than two-thirds of Democrats opposed the decision, as shown in Table 4.
Table 4: States cannot ban Trump from ballot, by party identification
Among adults
| Party ID | Favor or oppose Court’s decision | ||
| Favor | Oppose | Don’t know | |
| Total | 56 | 39 | 5 |
| Republican | 87 | 11 | 2 |
| Independent | 50 | 41 | 9 |
| Democrat | 26 | 69 | 6 |
| Marquette Law School Poll, national survey, March 18-28, 2024 | |||
| Question: On March 4, the U.S. Supreme Court ruled (unanimously) that states cannot bar Donald Trump from election ballots based on the 14th Amendment’s insurrection clause. How much do you favor or oppose this decision? | |||
| Combined percentage from questions mentioning ‘unanimously’ and not mentioning it. | |||
On March 26, the Court heard oral arguments on a lower court decision which would restrict access to mifepristone, a drug used in medication abortions. Sixty percent of people in this survey preferred that the Court keep the current access to the drug by overturning the lower court ruling, while 25% preferred that the Court uphold the lower court ruling and 15% said they don’t know. Views on this issue differed by party, as shown in Table 5. Republicans were nearly evenly divided, while more independents and many more Democrats favored maintaining current access to the drug. Substantial percentages in each partisan group, especially independents, said they did not know.
Table 5: Restrict access to mifepristone, by party identification
Among adults
| Party ID | Preference | ||
| The Court should rule to keep the current access to the medication abortion drug, thus overturning the lower court decision | The Court should rule that the lower court was correct in its decision, thus restricting access to the medication abortion drug | Don’t know | |
| Total | 60 | 25 | 15 |
| Republican | 43 | 41 | 16 |
| Independent | 49 | 18 | 33 |
| Democrat | 81 | 9 | 10 |
| Marquette Law School Poll, national survey, March 18-28, 2024 | |||
| Question: The U.S. Supreme Court is reviewing a lower court decision that would significantly restrict (but not eliminate altogether) access to a drug used in medication abortions, mifepristone. Which comes closer to your view? | |||
| Response option: The Court should rule to keep the current access to the medication abortion drug, thus overturning the lower court decision | |||
| Response option: The Court should rule that the lower court was correct in its decision, thus restricting access to the medication abortion drug | |||
The Court has set April 25 for oral arguments on whether former presidents enjoy immunity from criminal prosecution for conduct alleged to involve official acts during their tenure in office, a case arising from prosecutions of Trump involving the 2020 election and Jan. 6, 2021, events at the U.S. Capitol.
Our national survey asked about presidential immunity in a randomized experiment. Half of respondents were asked if “former presidents” should have immunity, and half were asked if “former President Donald Trump” should have immunity. Of those asked about “former presidents,” 20% said former presidents should have immunity, while 62% said they should not. Of those asked about “former President Donald Trump,” 28% said he should have immunity, while 56% said he should not. Eighteen percent of those asked the “former presidents” question said they “don’t know,” as did 17% of those asked the “former President Donald Trump” question. Those are notably high rates of “don’t know” responses given the volume of news coverage of the former president’s court cases. These results are shown in Table 6.
Table 6: Presidential immunity, by question wording
Among adults
| Question wording | Immunity opinion | ||
| Should be immune from criminal prosecution for their official acts | Should not have immunity from criminal prosecution for their official acts | Don’t know | |
| “Former presidents” wording | 20 | 62 | 18 |
| “Former President Donald Trump” wording | 28 | 56 | 17 |
| Marquette Law School Poll, national survey, March 18-28, 2024 | |||
| Question: The U.S. Supreme Court is considering a case concerning whether former presidents have immunity from criminal prosecution for official actions while in office. Which comes closer to your view? | |||
| Question: The U.S. Supreme Court is considering a case concerning whether former President Donald Trump has immunity from criminal prosecution for official actions while president. Which comes closer to your view? | |||
The difference in responses is largely due to Republicans who, on balance, oppose immunity for “former presidents” but shift to over half supporting immunity for Trump. The results by question wording and party identification are shown in Table 7. Republican support for immunity goes from 32% for “former presidents” to 55% for “former President Donald Trump,” while the number of those Republicans opposed to immunity moves from 49% for ”former presidents” to 27% for “former President Donald Trump.” The percent saying “don’t know” remains substantial in both wording half-samples, at nearly one-in-five. Shifts among independents and Democrats are quite small between the two question wordings, with support for immunity decreasing by 3 percentage points among independents and by 5 percentage points among Democrats when Trump is named.
Table 7: Presidential immunity, by question wording and party identification
Among adults
| Party ID | Immunity opinion | ||
| Should be immune from criminal prosecution for their official acts | Should not have immunity from criminal prosecution for their official acts | Don’t know | |
| Former presidents wording | |||
| Republican | 32 | 49 | 19 |
| Independent | 14 | 46 | 40 |
| Democrat | 9 | 81 | 10 |
| Former President Donald Trump wording | |||
| Republican | 55 | 27 | 18 |
| Independent | 11 | 44 | 45 |
| Democrat | 4 | 89 | 7 |
| Marquette Law School Poll, national survey, March 18-28, 2024 | |||
| Question: The U.S. Supreme Court is considering a case concerning whether former presidents have immunity from criminal prosecution for official actions while in office. Which comes closer to your view? | |||
| Question: The U.S. Supreme Court is considering a case concerning whether former President Donald Trump has immunity from criminal prosecution for official actions while president. Which comes closer to your view? | |||
On Feb. 26, the Court heard arguments in two cases dealing with how much social media companies can control the content that users posting on the companies’ sites as well as the extent to which governments can regulate those decisions. We asked this question:
“The U.S. Supreme Court is considering a case concerning laws that regulate how large social media companies like Facebook and YouTube control content posted on their sites. Which comes closer to your view? 1. The Court should rule that the companies have a First Amendment right to make decisions about what content may be presented on their sites. 2. The Court should rule that the companies cannot decide what views users may express on the sites.”
A plurality, 46%, say social media companies have a right to make decisions regarding content on their sites, while 38% say they should not be able to restrict content and 16% say they don’t know.
Opinion on social media restrictions varies by political ideology, with conservatives more opposed to social media company control over content and liberals more in favor of such control by social media companies, as shown in Table 8.
Table 8: Social media restrictions, by political ideology
Among adults
| Preference | |||
| Political ideology | Companies can control content | Companies cannot control content | Don’t know |
| Total | 46 | 38 | 16 |
| Conservative | 35 | 51 | 13 |
| Moderate | 49 | 36 | 16 |
| Liberal | 59 | 22 | 19 |
| Marquette Law School Poll, national survey, March 18-28, 2024 | |||
| Question: The U.S. Supreme Court is considering a case concerning laws that regulate how large social media companies like Facebook and YouTube control content posted on their sites. Which comes closer to your view? | |||
| Response option: The Court should rule that the companies have a First Amendment right to make decisions about what content may be presented on their sites | |||
| Response option: The Court should rule that the companies cannot decide what views users may express on the sites | |||
Those who are the heaviest users of the internet, saying they are “almost constantly” online, are more supportive of restrictions by social media companies and less likely to say they don’t know. Those who use the internet less often are less in favor of restrictions by social media companies but are much more likely to lack an opinion. Opposition to social media restrictions varies little by frequency of use of the internet, as shown in Table 9.
Table 9: Restrictions by social media companies, by internet use
Among adults
| Internet use | Preference | ||
| Companies can control content | Companies cannot control content | Don’t know | |
| Total | 46 | 38 | 16 |
| Almost constantly | 51 | 38 | 11 |
| Several times a day | 44 | 39 | 18 |
| Once a day or less | 37 | 35 | 28 |
| Marquette Law School Poll, national survey, March 18-28, 2024 | |||
| Question: The U.S. Supreme Court is considering a case concerning laws that regulate how large social media companies like Facebook and YouTube control content posted on their sites. Which comes closer to your view? | |||
| Response option: The Court should rule that the companies have a First Amendment right to make decisions about what content may be presented on their sites | |||
| Response option: The Court should rule that the companies cannot decide what views users may express on the sites | |||
On Nov. 7, the Court heard arguments as to whether a federal law that prohibits the possession of a firearm by persons subject to a domestic violence restraining order violates the Second Amendment right to keep and bear arms.
We asked:
“The U.S. Supreme Court is considering a case concerning the constitutionality of a federal law that prohibits people subject to domestic violence restraining orders from possessing firearms. Which comes closer to your view? 1. The Court should uphold the law prohibiting gun possession by those subject to restraining orders. 2. The Court should strike down the law as a violation of the Second Amendment right to bear arms.”
A substantial majority, 72%, say the Court should uphold the federal law, while 17% say the Court should strike down the law in favor of the right to bear arms and 11% say they don’t know.
On this issue, more than 60% of Republicans and independents say the Court should uphold the law, as do 83% of Democrats, as shown in Table 10.
Table 10: Law prohibiting firearm possession, by party identification
Among adults
| Party ID | Preference | ||
| Uphold law prohibiting firearm possession | Strike down law prohibiting firearm possession | Don’t know | |
| Total | 72 | 17 | 11 |
| Republican | 63 | 25 | 12 |
| Independent | 67 | 11 | 22 |
| Democrat | 83 | 9 | 8 |
| Marquette Law School Poll, national survey, March 18-28, 2024 | |||
| Question: The U.S. Supreme Court is considering a case concerning the constitutionality of a federal law that prohibits people subject to domestic violence restraining orders from possessing firearms. Which comes closer to your view? | |||
| Response option: The Court should uphold the law prohibiting gun possession by those subject to restraining orders | |||
| Response option: The Court should strike down the law as a violation of the Second Amendment right to bear arms | |||
Attention to news about the Court
Table 11 shows the trend in attention to news about the Court from September 2023 to March 2024. Few respondents had heard a lot about the Court in the past month in either September or November, but attention increased in 2024 as the Court heard arguments in some major cases. Still, in each survey, half or more said they have heard “just a little.”
Table 11: Attention to news about the Court
Among adults
| Poll dates | How much heard or read | ||
| A lot | A little | Nothing at all | |
| 3/18-28/24 | 30 | 50 | 19 |
| 2/5-15/24 | 24 | 56 | 20 |
| 11/2-7/23 | 15 | 60 | 25 |
| 9/18-25/23 | 17 | 61 | 22 |
| Marquette Law School Poll, national surveys, latest: March 18-28, 2024 | |||
| Question: Thinking about the last month only, how much have you heard or read about the U.S. Supreme Court? | |||
Confidence in institutions
Confidence in several institutions is summarized in Table 12. Juries in criminal cases enjoy the highest confidence among the five institutions and the lowest percentage of those expressing little or no confidence. Each of the other institutions has more respondents expressing little or no confidence than a great deal or quite a lot of confidence. The U.S. Supreme Court has the second highest level of confidence, followed closely by the presidency and the U.S. Department of Justice, with small differences in those saying little or no confidence. Congress suffers the lowest confidence rating, with 13% expressing a great deal or a lot of confidence and 51% saying they have little or no confidence in Congress.
Table 12: Confidence in institutions
Among adults
| Institution | Confidence | ||
| Great deal/a lot | Some | Little/None | |
| Juries that decide criminal cases | 39 | 44 | 17 |
| U.S. Supreme Court | 30 | 37 | 33 |
| The Presidency | 28 | 31 | 40 |
| The U.S. Department of Justice | 27 | 37 | 36 |
| Congress | 13 | 36 | 51 |
| Marquette Law School Poll, national survey, March 18-28, 2024 | |||
| Question: Here is a list of institutions in American society. How much confidence do you have in each one? | |||
Those expressing a great deal or a lot of confidence in the Court increased to 30% in March from 25% in February, while those saying they have little or no confidence decreased to 33% in March from 40% in February. While there has not been a great deal of variation in confidence, this is the first time high confidence has reached 30% since July 2023, and it is the smallest level of low confidence since March 2023. The full trend is shown in Table 13.
Table 13: Confidence in the U.S. Supreme Court
Among adults
| Poll dates | Confidence | ||
| Great deal/a lot | Some | Little/None | |
| 3/18-28/24 | 30 | 37 | 33 |
| 2/5-15/24 | 25 | 35 | 40 |
| 11/2-7/23 | 28 | 36 | 36 |
| 9/18-25/23 | 28 | 37 | 35 |
| 7/7-12/23 | 31 | 32 | 37 |
| 5/8-18/23 | 25 | 36 | 39 |
| 3/13-22/23 | 28 | 40 | 32 |
| 1/9-20/23 | 31 | 38 | 31 |
| 11/15-22/22 | 30 | 36 | 34 |
| 9/7-14/22 | 30 | 34 | 36 |
| 7/5-12/22 | 28 | 28 | 44 |
| 9/8-15/20 | 39 | 45 | 16 |
| 9/3-13/19 | 37 | 42 | 20 |
| Marquette Law School Poll, national surveys, latest: March 18-28, 2024 | |||
| Question: The U.S. Supreme Court: Here is a list of institutions in American society. How much confidence do you have in each one? | |||
Those who say that the justices’ decisions are based mainly on politics dipped slightly in March to 50% from 54% in February. The percentage saying decisions are based mainly on the law rose to 50% in March from 46% the previous month. The full trend is shown in Table 14.
Table 14: Are justices’ decisions motivated mainly by the law or mainly by politics?
Among adults
| Poll dates | Perceived motivation | |
| Mainly politics | Mainly the law | |
| 3/18-28/24 | 50 | 50 |
| 2/5-15/24 | 54 | 46 |
| 11/2-7/23 | 55 | 45 |
| 9/18-25/23 | 52 | 48 |
| 7/7-12/23 | 58 | 42 |
| 1/9-20/23 | 49 | 51 |
| 7/5-12/22 | 52 | 48 |
| 1/10-21/22 | 47 | 53 |
| 11/1-10/21 | 30 | 70 |
| 9/7-16/21 | 39 | 61 |
| 7/16-26/21 | 29 | 71 |
| 9/8-15/20 | 37 | 62 |
| 9/3-13/19 | 35 | 64 |
| Marquette Law School Poll, national surveys, latest: March 18-28, 2024 | ||
| Question: In general, what most often motivates Supreme Court justices’ decisions? | ||
Perceived ideological leaning of the Court
In March, 25% say they would describe the Supreme Court as “very conservative,” 32% would describe it as “somewhat conservative,” and 33% would call the Court “moderate,” while 8% see the Court as “somewhat liberal” and 3% believe it is “very liberal.”
Perceptions of the Court’s ideological leaning have shifted to the right since 2019, with far fewer seeing the Court as moderate, as shown in Table 15.
Table 15: Perceived ideological leaning of the Court, 2019-2024
Among adults
| Poll dates | Perceived ideology | ||||
| Very conservative | Somewhat conservative | Moderate | Somewhat liberal | Very liberal | |
| 3/18-28/24 | 25 | 32 | 33 | 8 | 3 |
| 2/5-15/24 | 21 | 34 | 33 | 7 | 5 |
| 11/2-7/23 | 21 | 35 | 32 | 7 | 5 |
| 9/18-25/23 | 20 | 37 | 32 | 7 | 3 |
| 7/7-12/23 | 27 | 35 | 28 | 7 | 3 |
| 5/8-18/23 | 24 | 33 | 30 | 10 | 3 |
| 3/13-22/23 | 23 | 35 | 34 | 6 | 2 |
| 1/9-20/23 | 22 | 37 | 31 | 8 | 2 |
| 11/15-22/22 | 25 | 36 | 32 | 6 | 2 |
| 9/7-14/22 | 29 | 35 | 27 | 5 | 3 |
| 7/5-12/22 | 34 | 33 | 21 | 7 | 3 |
| 5/9-19/22 | 23 | 33 | 34 | 8 | 2 |
| 3/14-24/22 | 15 | 37 | 36 | 10 | 2 |
| 1/10-21/22 | 17 | 38 | 35 | 8 | 2 |
| 11/1-10/21 | 15 | 35 | 39 | 8 | 1 |
| 9/7-16/21 | 16 | 35 | 40 | 7 | 2 |
| 7/16-26/21 | 13 | 37 | 42 | 6 | 1 |
| 9/8-15/20 | 5 | 30 | 54 | 9 | 2 |
| 9/3-13/19 | 5 | 33 | 50 | 9 | 3 |
| Marquette Law School Poll, national surveys, latest: March 18-28, 2024 | |||||
| Question: In general, would you describe each of the following… The U.S. Supreme Court | |||||
About the Marquette Law School Poll
The survey was conducted March 18-28, 2024, interviewing 1,000 adults nationwide, with a margin of error of +/-4 percentage points. Interviews were conducted using the SSRS Opinion Panel, a national probability sample, with interviews conducted online. The detailed methodology statement, survey instrument, topline results, and crosstabs for this release are available on the Marquette Law Poll website. Some items from this survey are held for later release.