New Marquette Law School Poll finds reduced but majority support for COVID-19 restrictions, while partisan divisions increase
MILWAUKEE – A new Marquette Law School Poll surveying Wisconsin registered voters finds increased division over response to the coronavirus pandemic, although majorities continue to support social distancing and other restrictions.
In the May survey, 69 percent say that it was appropriate to close schools and businesses and restrict public gatherings, while 26 percent say this was an overreaction to the pandemic. In late March, 86 percent said closures were appropriate, and 10 percent said this was an overreaction.
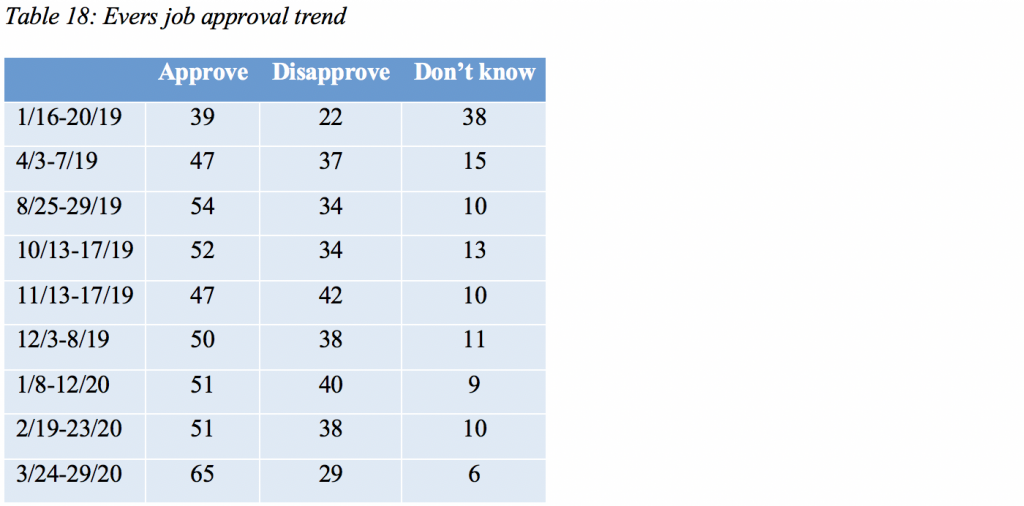
Approval of Gov. Tony Evers’ handling of the coronavirus issue has also declined, with 64 percent approving and 32 percent disapproving. In March, 76 percent approved and 17 percent disapproved.
Approval of President Donald Trump’s handing of the coronavirus outbreak has also declined to 44 percent, with 51 percent disapproval, compared to March when approval was 51 percent and disapproval 46 percent.
Concern about the pandemic has also lessened, with 50 percent saying they are very concerned, 31 percent saying somewhat concerned, 12 percent saying not very concerned, and 7 percent saying not at all concerned. The number who are very concerned has decreased by 18 percentage points since March when 68 percent were very concerned, 25 percent somewhat concerned, 5 percent not very concerned and 2 percent not at all concerned.
Similarly, worry over personal risk from COVID-19 has declined. Twenty-five percent say they are very worried and 35 percent are somewhat worried, while 20 percent are not very worried and 19 percent say they are not at all worried. In March, 30 percent were very worried, 40 percent somewhat worried, 18 percent not very worried, and 11 percent not at all worried.
The poll was conducted May 3-7, 2020. The sample included 811 registered voters in Wisconsin, interviewed by cell phone or landline, with a margin of error of +/- 4 percentage points.
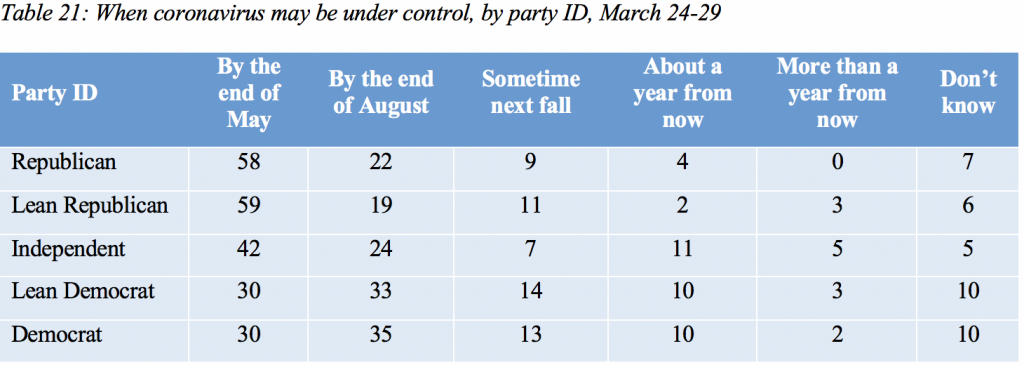
While concern over the virus and support for policies to reduce the spread of the disease have declined over the last six weeks, Wisconsin voters nonetheless now expect a much longer epidemic before things return to normal. Eighteen percent now think the coronavirus outbreak will be under control by the end of May, 20 percent say by the end of August, and 15 percent by sometime next fall. Twenty-six percent say it will take about a year and 10 percent say it will take more than a year to control the epidemic. In March, many more, 44 percent, thought the epidemic would be under control by the end of May and 27 percent said by the end of August. Eleven percent said the epidemic would be under control sometime next fall, while 7 percent thought it would take about a year and 2 percent said more than a year. Table 1 shows the responses for March and May polls.

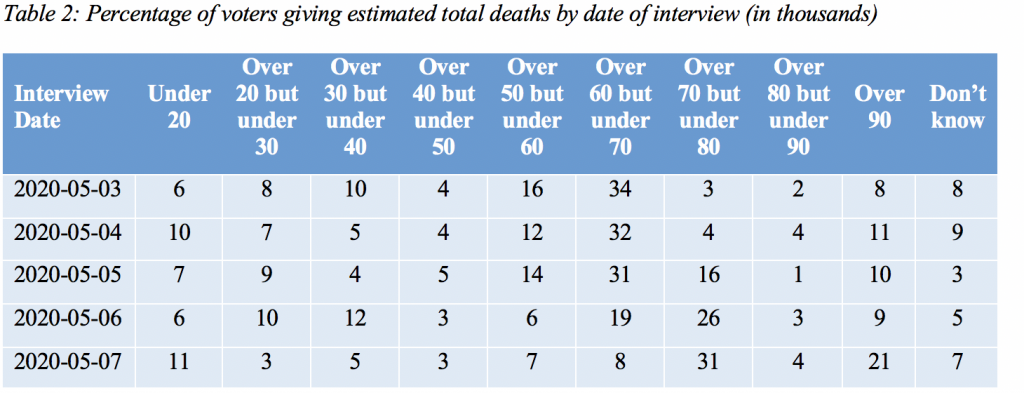
There is substantial awareness of how many deaths have resulted from the COVID-19 epidemic. As of the first day of polling, May 3, the New York Times reported 67,784 deaths in the United States. That total passed 70,000 on the third day of polling, May 5, when it reached 71,077. On the last day of polling, May 7, the reported total deaths were 75,744. This means the “correct” number of deaths varied by day of interview. If we consider answers of over 60,000, but below 80,000, to be correct, 40 percent gave an approximately correct answer. Another 12 percent underestimated by saying the number was between 50,000 and 60,000, while 27 percent substantially underestimated, saying there had been fewer than 50,000 deaths. Fourteen percent said the toll had been greater than 80,000, and 7 percent said they didn’t know how many had died.
Awareness of the number of deaths responded to the changing estimates of deaths over the five days of the survey as shown in Table 2. The percentage saying “over 60,000 but under 70,000” dropped as the actual total moved over 70,000, and the percentage choosing the 70,000 to 80,000 category was small until the total reached this level, at which point the percentage choosing this category rose.
Views on reopening
A majority of Wisconsin voters, 53 percent, say they trust the governor more than the legislature to decide when to begin reopening and relaxing restrictions on public gatherings, while 33 percent say they trust the legislature more to make these decisions.
Recent demonstrations calling for reopening of the state are supported by 31 percent and are opposed by 63 percent of registered voters.
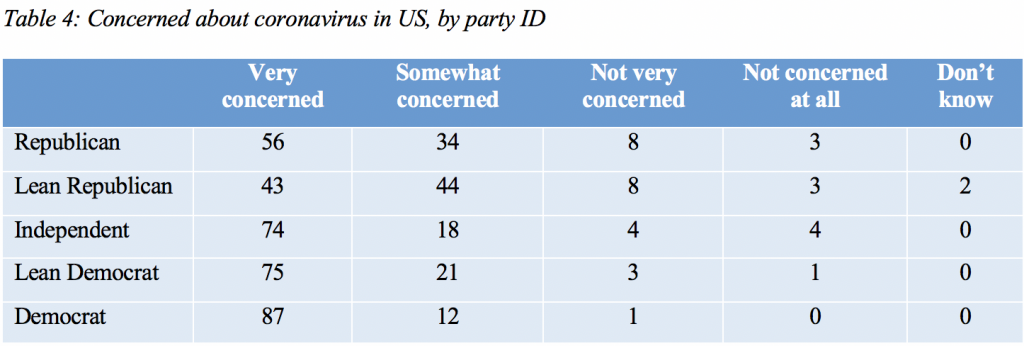
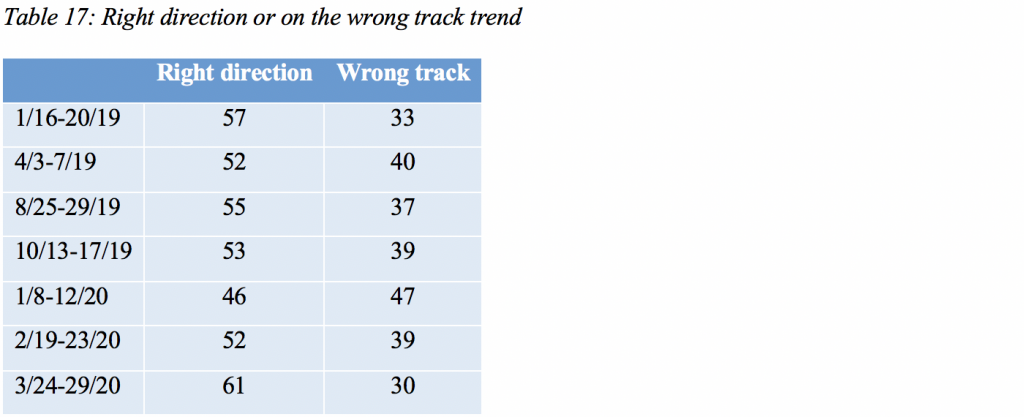
Both of these opinions are sharply divided on partisan grounds, as shown in Tables 3 and 4 below.


More people, 56 percent, say they are more concerned that Wisconsin will reopen too soon than say they are more concerned that the state will not reopen soon enough, 40 percent.
There is considerable variation in what activities people say they would be comfortable doing if the “Safer at Home” order were lifted “tomorrow.” A substantial 77 percent say they would be comfortable visiting a friend or family member’s home, while 21 percent would not be comfortable doing this.
Fifty-six percent say they would be comfortable shopping at a mall or large retail store such as Target or Walmart, although 42 percent would not be comfortable shopping.
Forty-five percent would be comfortable attending worship services, while 52 percent would be uncomfortable.
Eating out at a restaurant is something 42 percent would be comfortable with, while 57 percent would not be comfortable with that.
Most people would be uncomfortable with attending sports events, such as baseball, basketball, or football, or a concert or play: 25 percent would be comfortable and 73 percent would not be comfortable attending large gatherings of these kinds.
Vote by mail
Looking ahead to the November election, 36 percent favor having all voting done by mail, but a majority, 57 percent, say it is important to have in-person voting along with a vote-by-mail absentee option.
As for how people think they personally will vote, 43 percent say they will vote absentee by mail, 11 percent say they will vote early in-person, and 39 percent say they plan to vote in-person on election day.
Economic impact
Reported job loss is higher in the May survey than in late March, with 15 percent saying they have lost a job. Thirty-three percent say someone in their family, other than themselves, has suffered a job loss. In March, 9 percent reported having lost a job and 26 percent said someone else in their family had lost a job. The two polls are compared in Table 5.

Work hours have been reduced for 24 percent of those polled. Forty-three percent say some other family member has had work hours reduced. These results are little changed from March, as shown in Table 6.

Twenty-seven percent say they have had to work from home, and 47 percent say this has happened to some other family member. These results have not changed much since March, as shown in Table 7.

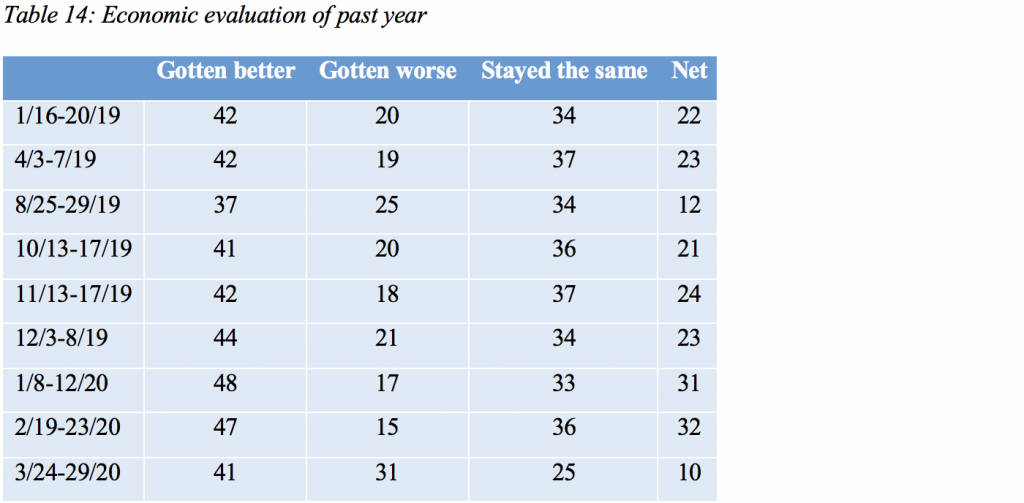
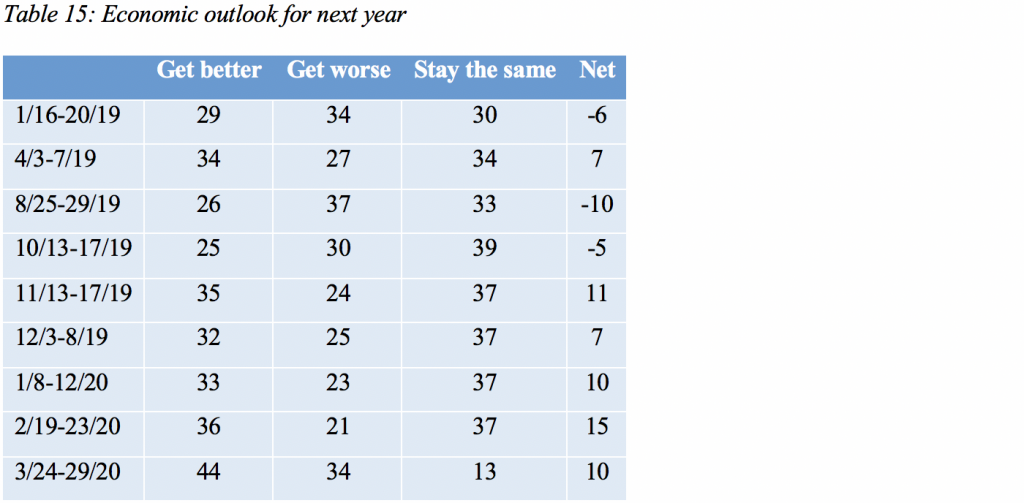
Views of the direction of the economy have turned sharply down, with many more people saying the economy has gotten worse over the past year. But voters’ outlook for the next 12 months remains positive and has not changed since March. Tables 8 and 9 show the recent trends in these measures.


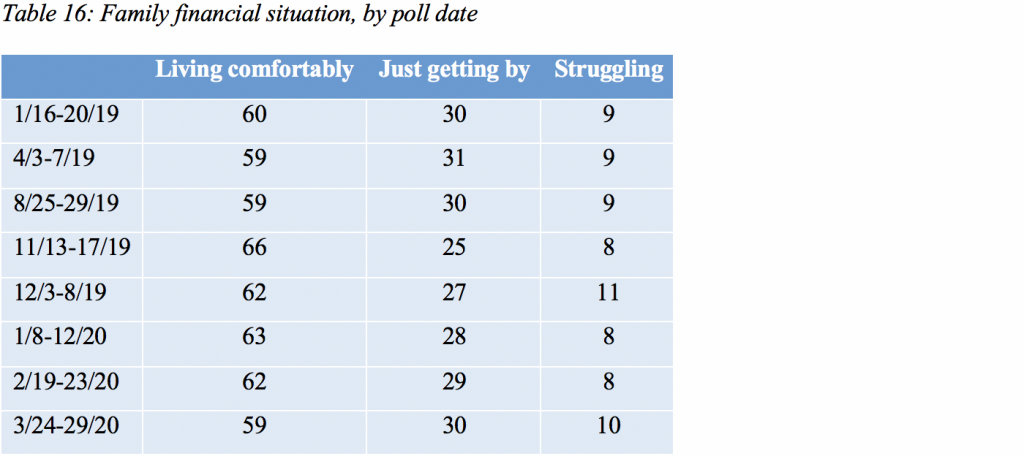
While many respondents have lost jobs or had working hours cut, there has not been a surge in reports of financial distress. However, those who have lost jobs or had family members lose jobs report substantially higher levels of financial insecurity as shown in Tables 10 and 11.


Those who have had work hours reduced also report less financial security than those who have not had hours reduced. This result is shown in Table 12.

Black people have been especially hard hit by the economic consequences of the pandemic. Combining the March and May polling, 29 percent have lost a job and an additional 48 percent have had a family member other than themselves lose a job.
These job losses have pushed the financial situation of blacks into greater insecurity. In January and February, 41 percent of blacks said they were living comfortably, 48 percent said they were just getting by, and 10 percent said they were struggling. In the combined March and May data, the percentage living comfortably was only a little lower, 38 percent, but those just getting by fell to 37 percent and those struggling rose to 25 percent.
Blacks in Wisconsin have also suffered disproportionately high COVID-19 infection and death rates compared to other groups, and this is reflected in higher concern about the coronavirus pandemic and personal worry about being affected by the disease. Among blacks in the combined March and May data, 75 percent say they are very concerned about the pandemic and 46 percent are very worried about the consequences of being infected with COVID-19. Among whites, 58 percent are very concerned, and 27 percent are very worried.
Home life
Forty-seven percent say their life has been disrupted a lot by the coronavirus epidemic, and 34 percent say it has been disrupted some, while 15 percent say only a little and 4 percent say there has been no disruption at all.
Of those with children under 18 living at home, almost half, 47 percent, say handling childcare has been very easy during the coronavirus outbreak, and 23 percent say it has been somewhat easy, while 20 percent say childcare has been somewhat difficult and 5 percent say it has been very difficult.
Of those with school-age children, 74 percent say their child has continued to receive instruction during the coronavirus closure. Nineteen percent say there has been limited instruction, and 4 percent say their child has not received any instruction. An additional 2 percent say their child has been home-schooled.
Differences in opinion by partisanship
Partisan differences have substantially increased from March to May. In March, three-quarters or more of every partisan group said that closing schools and businesses was an appropriate response to the pandemic. By May, Republicans were about evenly divided, with over 40 percent saying this was an overreaction.


Partisan division over Evers’ general handling of the pandemic has also increased sharply. In March, over 60 percent of all partisan groups approved of his handling of the response to the virus, but, by May, over 60 percent of Republicans disapproved.


Approval of how Trump has handled the coronavirus epidemic is sharply partisan, as it was in March, but with some decline in approval among Republicans, independents who lean Republican, and independents with no partisan leaning. Democrats who were strongly disapproving in March are slightly more so in May.


The levels of concern over coronavirus in the United States show significant partisan differences. However, declining concern about the pandemic has occurred across all partisan categories from March to May.


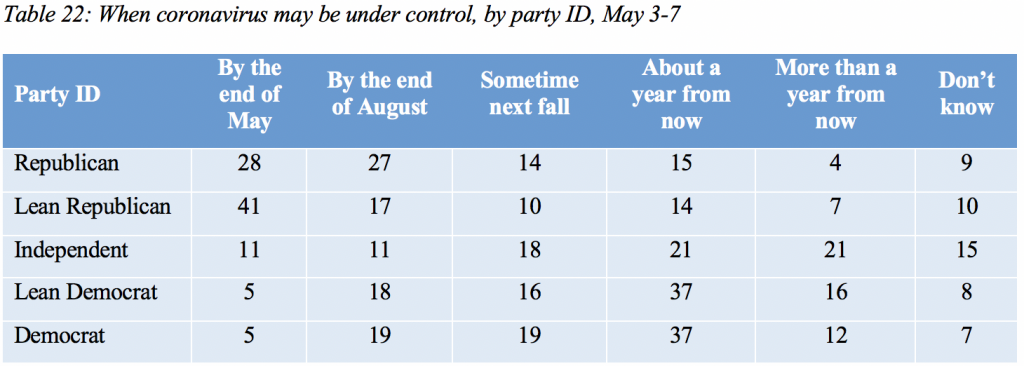
The outlook for when the virus may be under control and things return to normal also shows partisan differences. Across all partisan groups, there is a substantial shift away from believing that the pandemic will be under control by August or sooner, and an increase in the percentage that believe the outbreak will continue into the fall or beyond.
General-election matchup
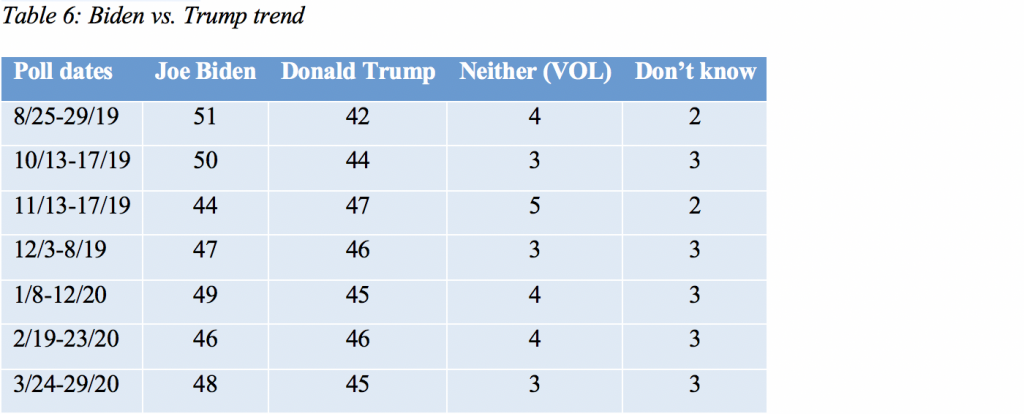
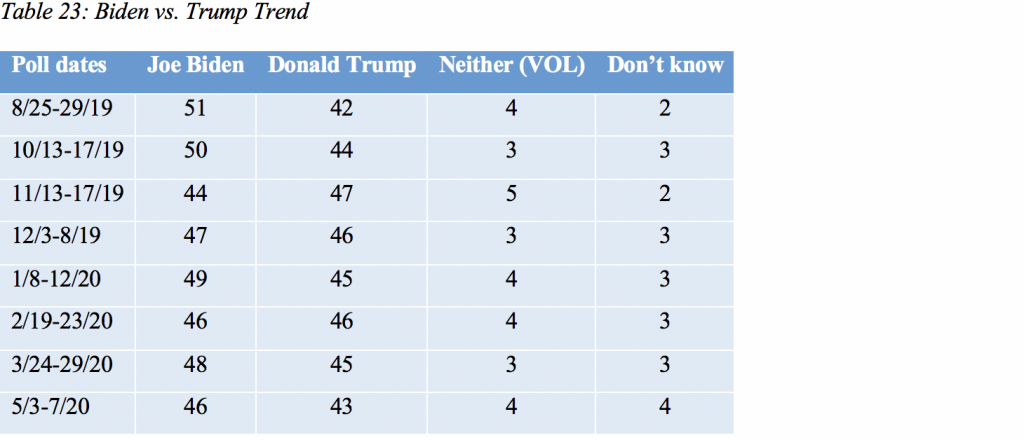
A general-election matchup between Trump and presumptive Democratic nominee former Vice President Joe Biden indicates a close race. In the May poll Biden receives 46 percent and Trump receives 43 percent. In March, Biden had the same edge with 48 percent to Trump’s 45 percent.
The full trend in general-election support is shown in Table 23 for Biden vs. Trump.
Biden holds an advantage over Trump among the youngest voters, 18-29 years old, and the oldest, 60 years or older, while those 30-59 years old favor Trump, a pattern that has held in most of the Marquette Law School polls since August 2019. Vote by age is shown in Table 24 for the May survey.

Differences by sex and education among white voters have been particularly pronounced in approval of Trump and in vote choice. Table 25 shows the vote choice by sex, education, and race. There are too few non-white respondents to allow breaking those groups out by sex and education.

In 2016, according to exit polls, Trump won a substantial majority of voters who had a negative opinion of both Hillary Clinton and Trump. In the four Marquette Law School polls conducted in 2020, a different pattern is apparent. Among those with a favorable opinion of both Biden and Trump, Trump receives 61 percent to Biden’s 27 percent. For voters with unfavorable views of both candidates, Biden receives 62 percent to 15 percent for Trump. Four percent hold favorable views of both candidates, and 12 percent have unfavorable views of both. Unsurprisingly, those with favorable views of one and unfavorable views of the other candidate give the favored candidate over 97 percent of their votes.
Trump Job Approval
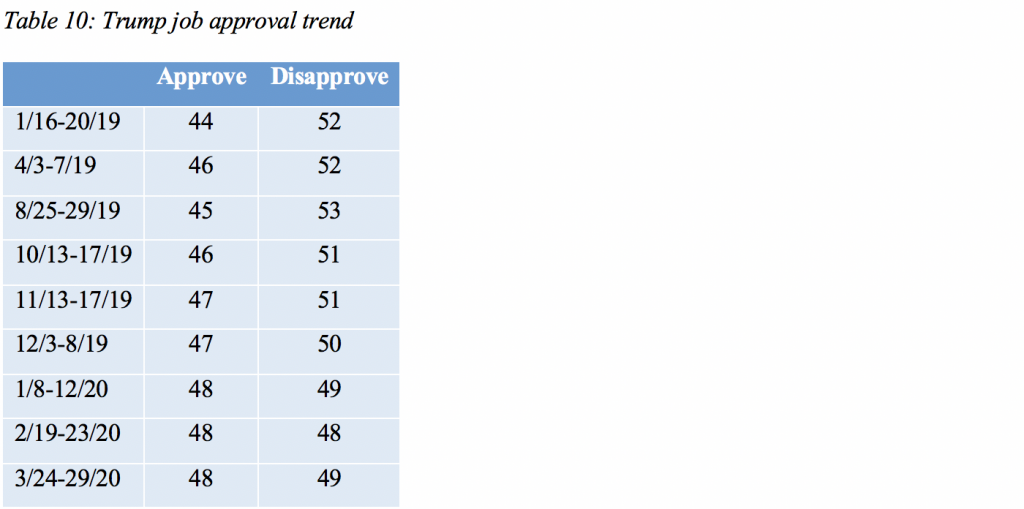
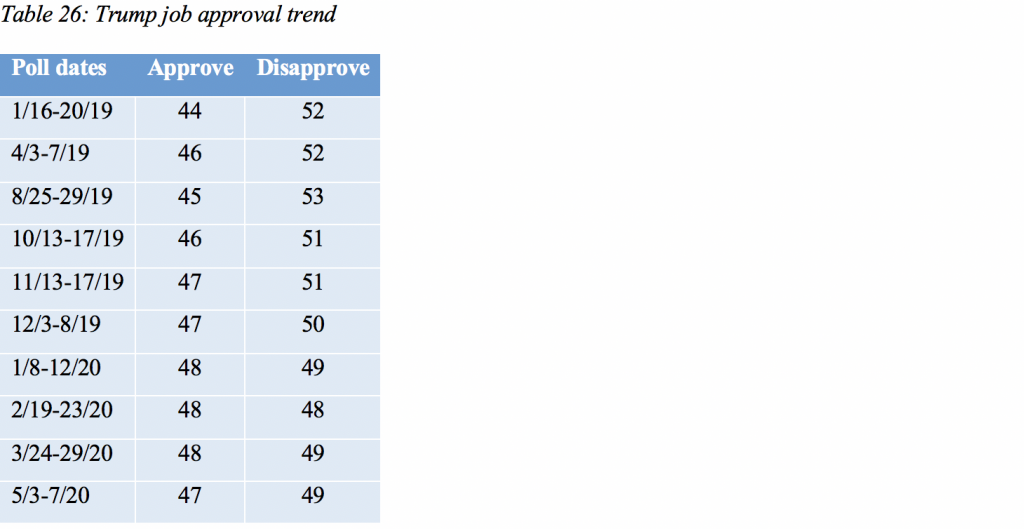
Forty-seven percent approve of the job Trump is doing as president, with 49 percent disapproving. That is little changed from March, when 48 percent approved and 49 percent disapproved.
Trump’s recent job approval trend is shown in Table 26.
Trump’s job approval is high among Republicans and low among Democrats, with a majority of independents approving, as shown in Table 27.

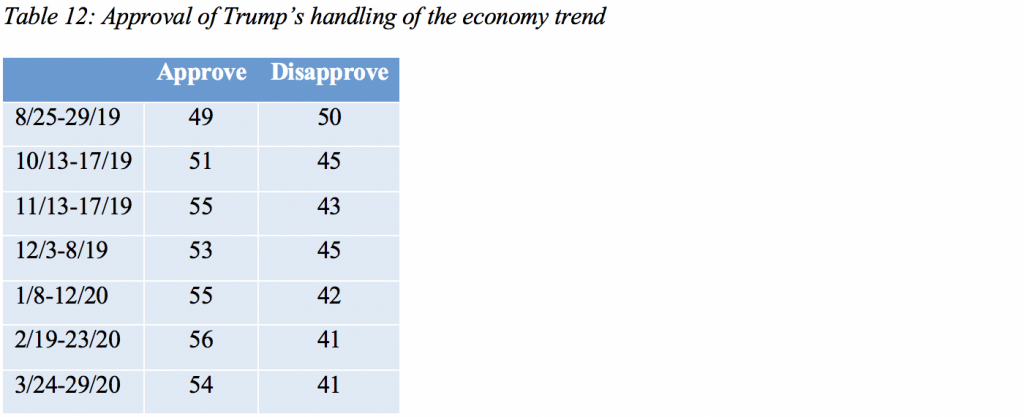
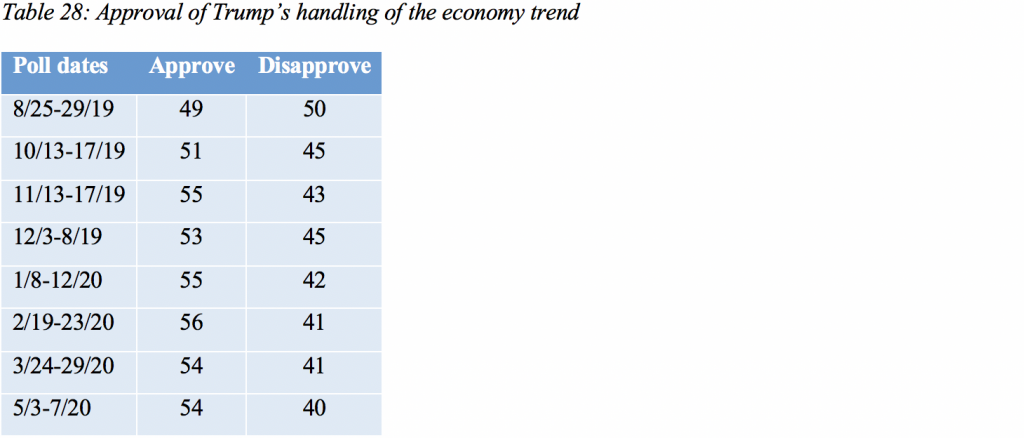
Fifty-four percent of those polled approve of Trump’s handling of the economy, while 40 percent disapprove. In March, 54 percent approved and 41 percent disapproved.
The trend in approval of Trump’s handling of the economy is shown in Table 28.
Governor and legislature job approval
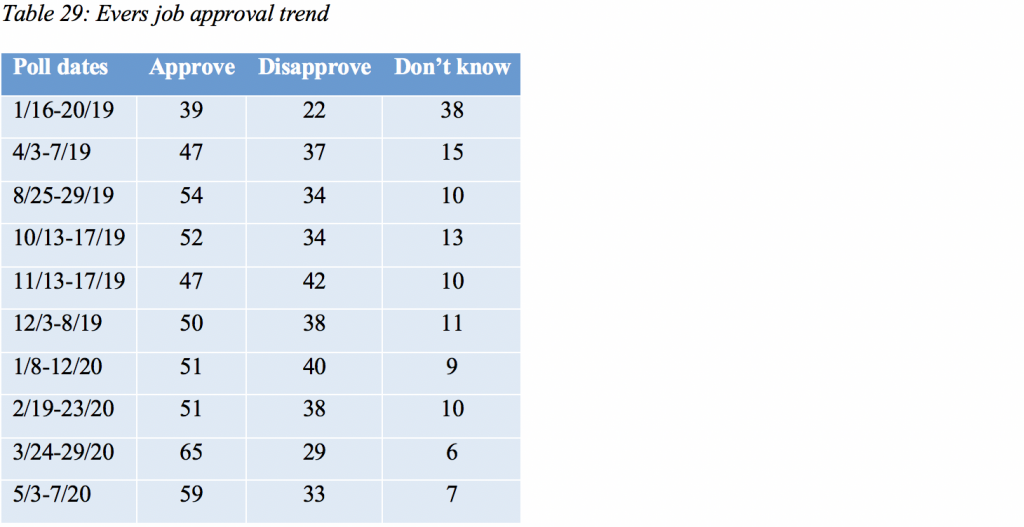
Evers’ job approval stands at 59 percent, with disapproval at 33 percent. Seven percent say they don’t have an opinion. In March, 65 percent approved and 29 percent disapproved.
The trend in job approval of the governor is shown in Table 29.
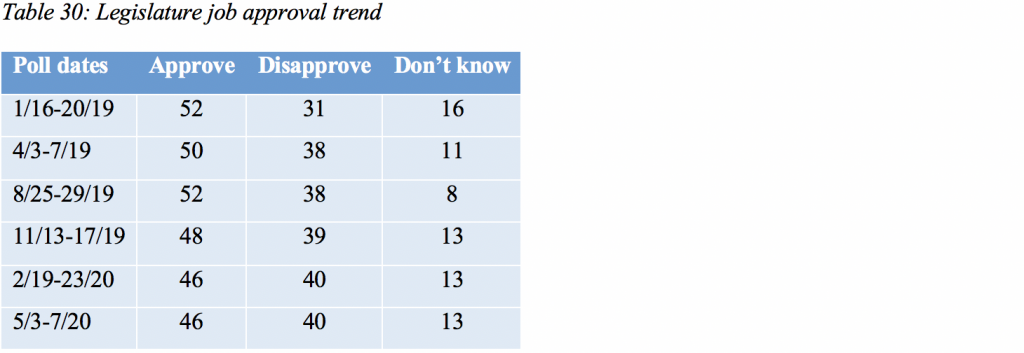
The trend in approval of the legislature, which is not asked in every survey, is shown in Table 30.
Favorability of Evers, Johnson and Baldwin
Tables 31-33 present the recent favorability ratings of Evers, Democratic Sen. Tammy Baldwin, and Republican Sen. Ron Johnson.


About the Marquette Law School Poll
The Marquette Law School Poll is the most extensive statewide polling project in Wisconsin history. This poll interviewed 811 registered Wisconsin voters by landline or cell phone from May 3-7, 2020. The margin of error is +/-4 percentage points for the full sample.
The partisan makeup of the sample, including those who lean to a party, is 44 percent Republican, 45 percent Democratic, and 9 percent independent. The partisan makeup of the sample, excluding those who lean to a party, is 29 percent Republican, 28 percent Democratic, and 41 percent independent.
Since January 2017, the long-term partisan balance, including those who lean to a party, in the Marquette Law School Poll has been 45 percent Republican and 45 percent Democratic, with 9 percent independent. Partisanship exuding those who lean has been 30 percent Republican and 29 percent Democratic, with 40 percent independent.
The entire questionnaire, methodology statement, full results and breakdowns by demographic groups are available at law.marquette.edu/poll/results-and-data.


