Among the eleven biggest Midwestern cities, Chicago has experienced the largest drop in homicide rates over the past quarter-century, while Cincinnati has experienced the largest increase. The other nine cities are scattered between the biggest loser and the biggest gainer, reflecting a range of markedly different urban experiences with lethal violence since the mid-1980s.
This rather messy graph indicates the annual number of homicides (murder and other nonnegligent manslaughter) per 100,000 residents for each of the eleven Midwestern jurisdictions with a population of more than 250,000:
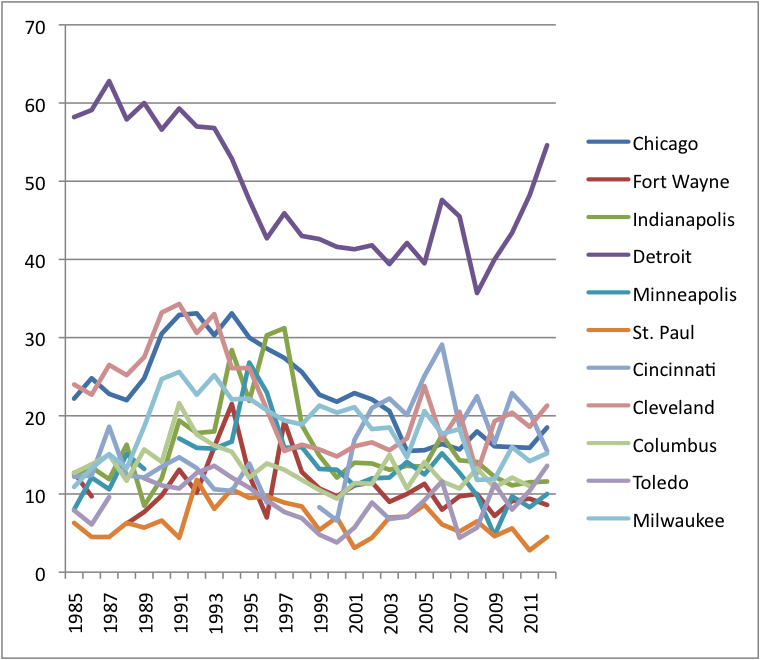
Other than Detroit’s position as the region’s perennial homicide champ, it is hard to discern any patterns in the mass of lines.
The following table provides a clearer picture of each city’s trajectory. Since homicides are relatively rare crimes and often vary a great deal year-to-year, I’ve compared three-year averages from the start of the period (1985-1987) and the end of the period (2010-2012).
| Chicago | -28% |
| Fort Wayne | -19% |
| Detroit | -19% |
| Cleveland | -18% |
| Columbus | -17% |
| St. Paul | -16% |
| Indianapolis | -10% |
| Minneapolis | -9% |
| Milwaukee | 16% |
| Toledo | 36% |
| Cincinnati | 36% |
Another way of thinking about change over time is to focus on rankings. Although the absolute homicide rates have changed quite a bit, each city’s relative position has remained fairly consistent. The table below ranks the cities by homicide rate, from highest rate (11) to lowest (1).
| 1985-87 | 2010-12 | |
| Detroit | 11 | 11 |
| Cleveland | 10 | 10 |
| Chicago | 9 | 8 |
| Cincinnati | 8 | 9 |
| Columbus | 7 | 6 |
| Milwaukee | 6 | 7 |
| Indianapolis | 5 | 5 |
| Fort Wayne | 4 | 2 |
| Minneapolis | 3 | 3 |
| Toledo | 2 | 4 |
| St. Paul | 1 | 1 |
The biggest changes have been Fort Wayne’s modest jump from fourth to second place and Toledo’s equally modest drop. This suggests that ranking is largely a function of relatively fixed aspects of city life; new policing strategies and other violence-reduction initiatives at the local level may not be capable of making a lot of difference on this front. Homicide rates do, of course, exhibit long-term up or down trends, but much of this may result from broader regional or national social forces that touch peer cities, too, and thus leave relative position largely unchanged.
One of the cross-regional dynamics that may be at play is a tendency for outliers to gravitate toward the center. (I’ve also noted this phenomenon in earlier posts in this series.) The overall regional trend has been for homicide rates to come down, but the cities that started with the highest homicide rates in the mid-1980s tended to experience the biggest drops. For instance, the four cities with the highest rates in 1985-1987 averaged a seven-percent net reduction over the next quarter-century, while the four cities with the lowest rates in 1985-1987 averaged only a two-percent net reduction.
Do state-level policies matter? Perhaps not much. Ohio provides an interesting case study. The Buckeye State’s four cities have been on quite different trajectories over the past quarter-century, with Cincinnati and Toledo appearing at the very top of the list of biggest gainers, while Cleveland and Columbus have been among the biggest losers.