A new report from the UWM Employment and Training Institute shows that Wisconsin leads the nation in incarcerating black males. Based on data from the 2010 U.S. census, Wisconsin incarcerates about one in every eight of its black men between the ages of 18 and 64. This includes individuals held in state and local correctional facilities. The Badger State’s black incarceration rate is, in fact, about one-third higher than that of the second-place state, Oklahoma, and nearly double the national average.
Wisconsin also leads the nation in incarcerating Native-American males, but its white-male incarceration rate (one-tenth of the black rate) closely tracks the national average. Wisconsin’s Hispanic incarceration rate is actually below the national average.
The Milwaukee County data are particularly striking: more than half of the County’s black males between the ages of 30 and 44 have been or currently are housed in a state correctional institution.
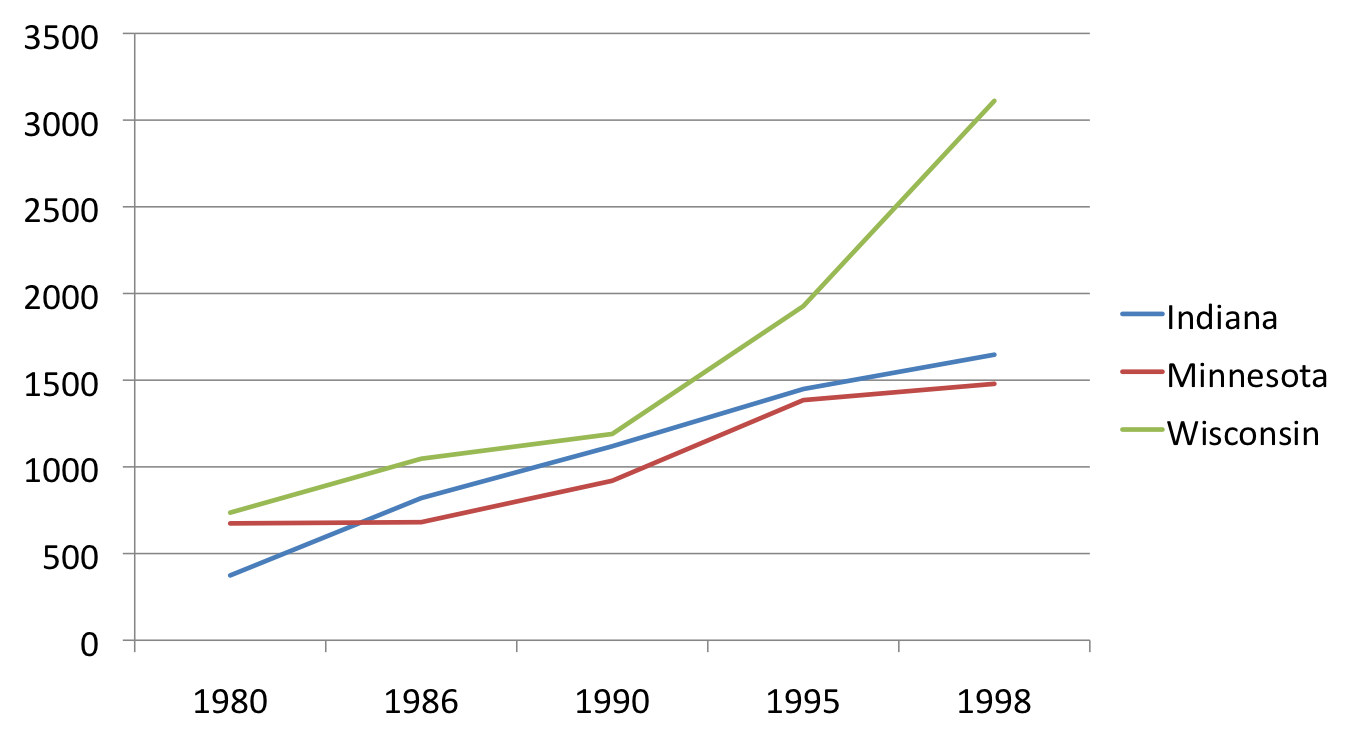
Is this a recent phenomenon? I’ve taken a look at some historical data on racial disparities for my three-states research. The following graph indicates that Wisconsin has been above Indiana and Minnesota for some time in black imprisonment (that is, prisoners per 100,000 residents), but that the current wide gap did not really open up until after 1990:
Black incarceration rates tend to take on added significance when compared to white. The next graph indicates the ratio of black to white imprisonment rates:
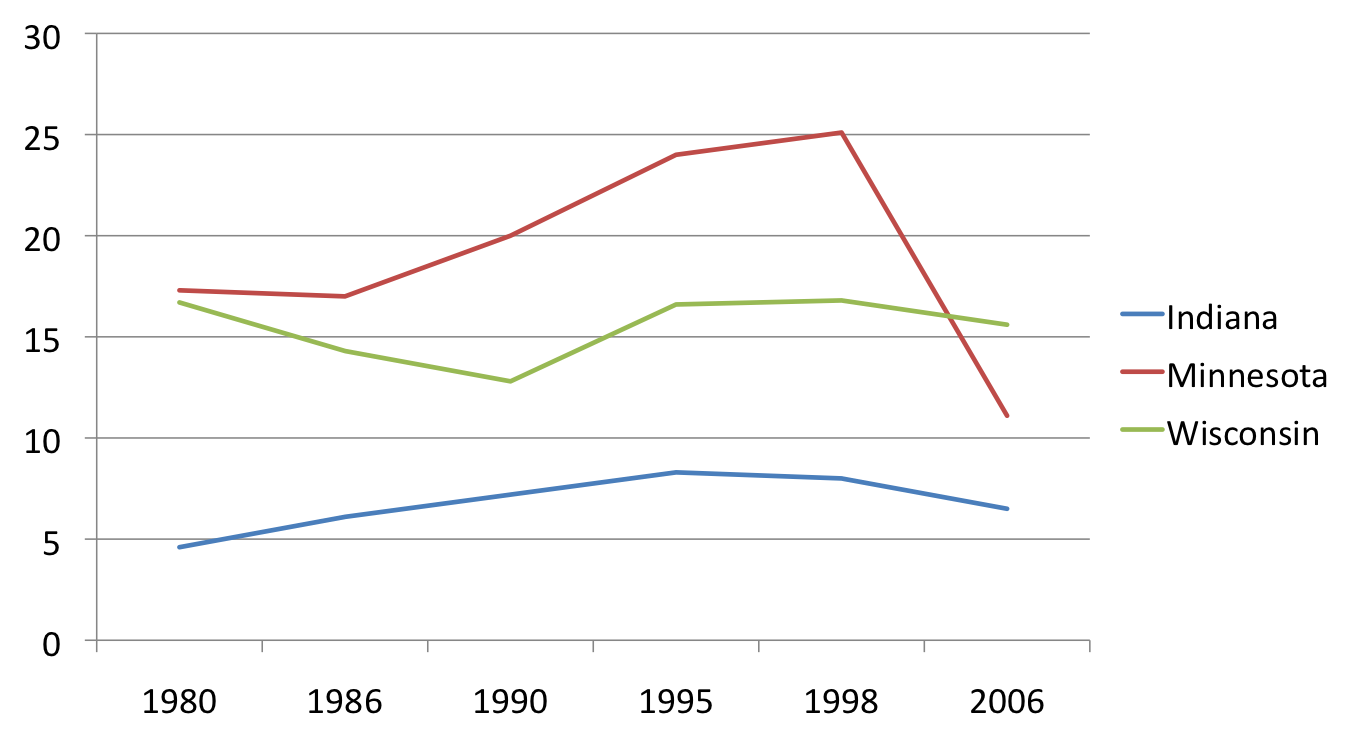
This graph, too, indicates that the 1990s were a key decade; although Wisconsin’s imprisonment binge in that era had a big impact on all racial groups, blacks were disproportionately affected, as disparity gains in the 1980’s were wiped away.
The real curiosity, though, is how Minnesota managed to reduce its disparities so markedly after 1998.
In the interest of getting an even longer view on black incarceration rates in Wisconsin, I consulted the U.S. Bureau of Justice Statistics’ compendium Race of Prisoners Admitted to State and Federal Institutions, 1925-86. Here are Wisconsin’s black and white prison admissions per 100,000 residents at (roughly) ten-year intervals (there are, unfortunately, some gaps in the BJS data):
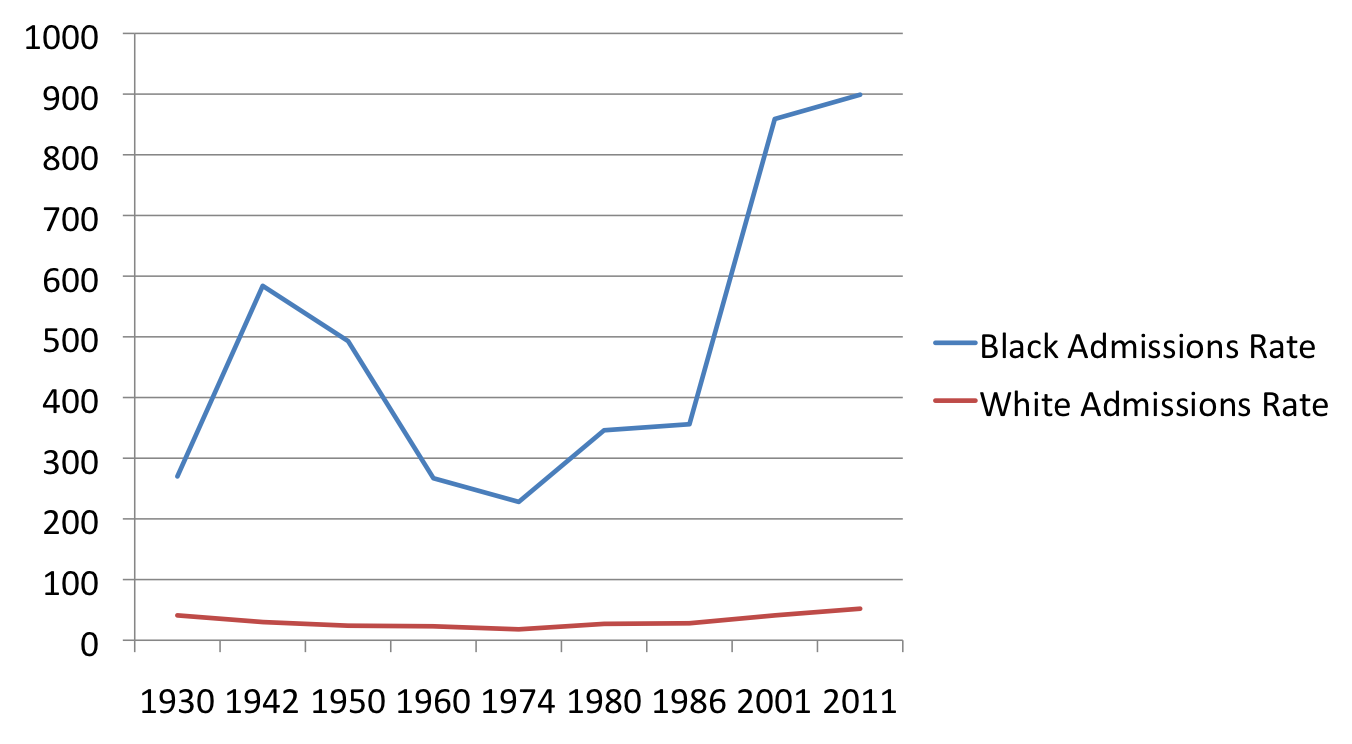
Racial disparities in prisons admissions are quite pronounced throughout the time period, going back even before the great post-war black migration to Wisconsin, when the state’s black population was comparatively tiny. But, while the disparities seem always present, the gap has gotten bigger and smaller over the decades. We do seem to be in a remarkably high period right now, though, with the black imprisonment rate far exceeding the earlier peak in the 1940’s. Again, there are indications that the 1990’s were a period of extraordinary growth for black incarceration. With some more recent signs of a leveling off, one wonders if the current peak will also be followed by a trough, as occurred after the 1940’s peak.
[A couple of technical notes on the graph. I used 1940 census numbers as the denominator to calculate the 1942 admissions rates. For the 2001 admissions figures, I used one-half of the cumulative 2001-2002 number reported by the Legislative Fiscal Bureau in its 2003 informational paper on adult corrections. I used an analogous estimate for 2011 based on the 2013 informational paper.]
Hat tip to Rick Romell for bringing the UWM report to my attention.
Cross posted at Life Sentences.