Despite their geographical proximity and economic and cultural similarities, the states of the Midwest have had very different rates of violent crime over the past five decades. Moreover, through periods of dramatic increases and decreases in violent crime, the relative positions of the states have remained fairly stable. The low-violence states in 1960 remain at the low end today, while the high-violence states in 1960 remain at the high end today. However, the gap between the high states and low states has been slowly diminishing for many years. In another decade, the state that has historically had the highest rate of violence, Illinois, may conceivably fall to about the same level as the state that has historically had the lowest, Iowa.
Readers of this Blog may know that I have previously written a series of posts on crime and punishment in three midwestern states, Indiana, Minnesota, and Wisconsin (e.g., here and here). With this post, I begin a new series that will explore regional trends more broadly. With violent crime such a staple of local news coverage, I think it’s helpful to be able to place the crime du jour within a wider spatial and temporal context; perhaps this bigger-picture view may lessen the tendency to adopt hastily conceived policy responses to whatever happens to be the latest outrage.
Here are the rates of reported violent crime (per 100,000 residents) in the midwestern states and the U.S. as a whole since 1960:
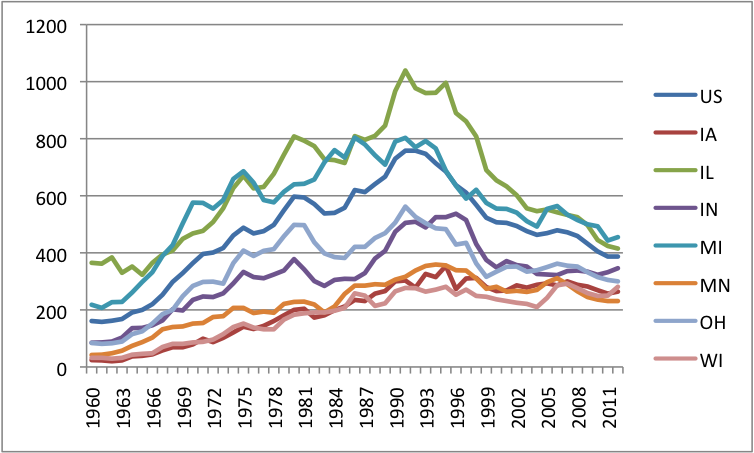 As indicated in the chart, a vast gap separated Illinois and Iowa in 1960: Illinois’s rate of violence was more than fifteen times that of its neighbor to the west. The other five midwestern states were scattered at various intervals between Iowa and Illinois.
Then, in about 1963, violence spiked sharply up across the whole region. Recently, we’ve seen a tremendous outpouring of media attention to the fiftieth anniversary of President Kennedy’s assassination, but I’ve not yet seen any coverage of the fiftieth anniversary of an event that was perhaps even more consequential: The Great Crime Wave, which continued, with some ups and downs, roughly thirty years. Indeed, this was a national phenomenon that fundamentally reshaped criminal justice systems across the country.
Throughout the Crime Wave, though, and indeed right up to the present, distinct patterns of state groupings are apparent: Iowa, Minnesota, and Wisconsin have similar rates of violence on the low end; Michigan and Illinois occupy the high end; and Ohio and Indiana define the center.
But, while relative positions have remained stable, different states experienced very different rates of growth in violence during the Crime Wave. Likewise, in the period of falling violence since the early 1990s, rates of decline have also varied. Interestingly, the states that had the biggest increases in violence before 1993 have also tended to have the smallest drops since then. Here are the percentage changes in each state over the two periods:
| 1963-1993 | 1993-2012 | |
| IA | 1258% | -19% |
| IL | 163% | -57% |
| IN | 475% | -29% |
| MI | 263% | -43% |
| MN | 743% | -35% |
| OH | 500% | -40% |
| WI | 725% | 6% |
There is another striking dimension to these numbers that becomes apparent if you recall which states were doing the best with violent crime in 1960. In the table below, the second column ranks the states from lowest to highest rates of violence in 1960, the third column ranks by rate of growth from 1963 to 1993 from highest to lowest, and the fourth column ranks by rate of growth from 1993 to 2012.
| IA | 1 | 1 | 2 |
| IL | 7 | 7 | 7 |
| IN | 5 | 5 | 3 |
| MI | 6 | 6 | 6 |
| MN | 3 | 2 | 4 |
| OH | 4 | 4 | 5 |
| WI | 2 | 3 | 1 |
There is remarkable consistency across the columns. Simply put, the states that were doing the best in 1960 have had the worst trajectories since then, and vice versa. Thus, while the top trio from 1960 (Iowa, Wisconsin, and Minnesota) still have lower violence rates than the bottom duo (Illinois and Michigan), the long-term trend seems toward convergence. For instance, Illinois’s violence rate is now less than twice Iowa’s — a remarkable drop from that fifteen-fold gap in 1960.
Here’s another way of depicting the convergence story. The chart below shows each state’s violent crime rate in relation to the overall national average. 1.0 means that a state’s violence level is equal to that of the nation as a whole.
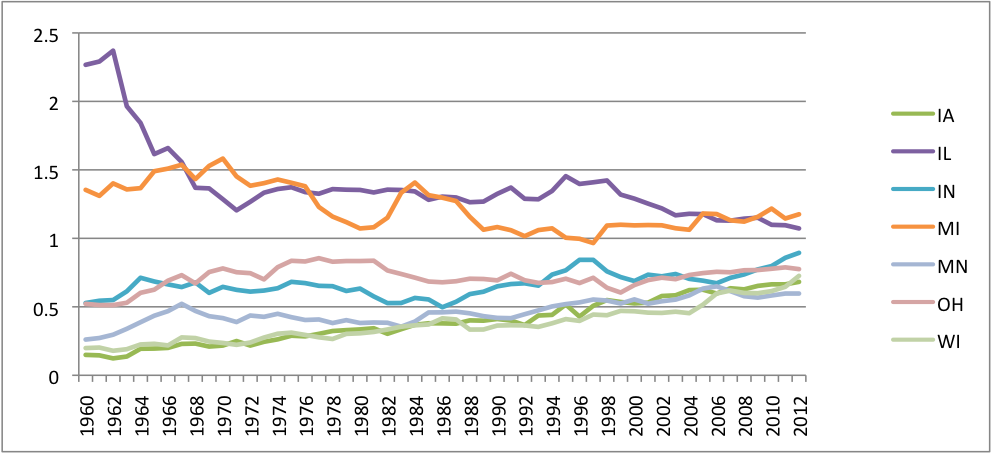
Notwithstanding a few blips along the way, the overall, fifty-year trend seems to be that the individuals states are slowly gravitating toward the national average.
These comparisons put a new gloss on Wisconsin’s stubbornly high rates of violent crime, relative to the state’s historical norms. Although national rates of violence have dropped precipitously since the early 1990s, Wisconsin has not really participated in this happy trend. Indeed, as indicated above, Wisconsin is the only one of the seven midwestern states to experience a net increase in its rate of violent crime since 1993. However, given a general trend of movement toward the national average, Wisconsin’s experience since 1993 is more-or-less what one would expect. If Illinois has done much better in reducing its rate of violent crime, that seems to have something to do with the fact that Illinois has historically had much higher rates of violence than Wisconsin.
Why the midwestern states seem to be converging on the national average is not immediately clear to me, but I suspect it may have something to do, at least in part, with the extraordinary and ever-increasing mobility of our society — mobility of people, ideas, guns, drugs, law enforcement tactics, and patterns of behavior generally. Anyone who has traveled around the country for a number of years can probably appreciate that every place seems increasingly to look like every other place. If the people of Milwaukee, Indianapolis, Cleveland, and Minneapolis are all buying the same goods and services from the same chain retailers, why should we be surprised to learn that they are committing the same crimes with the same frequency, too?
Cross posted at Life Sentences Blog.