To judge by some of the political rhetoric last fall, violent crime must be surging in our nation’s cities. Is that true? The answer may depend on which city you are talking about, and which neighborhood within that city.
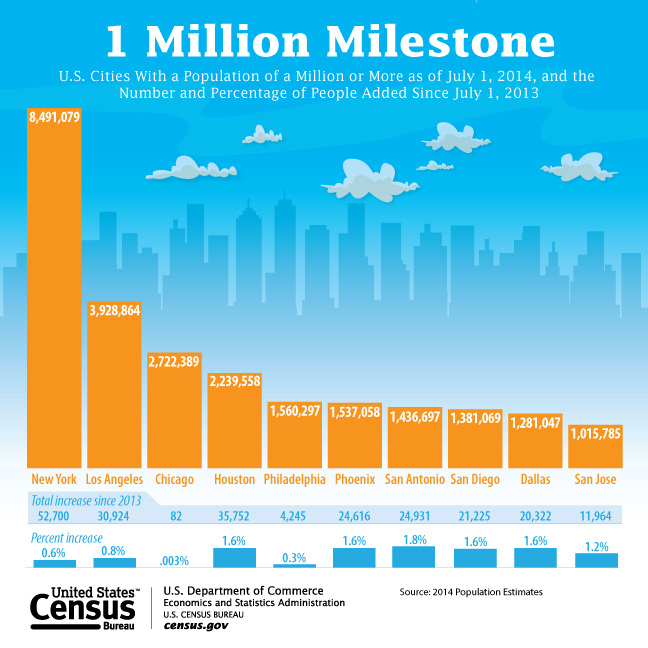
Consider the contrast between Chicago and New York. The Windy City had about 762 homicides in 2016, while the Big Apple had just 334. The difference is shocking, especially when you consider that New York has three times Chicago’s population.
To some extent, the contrasting figures from 2016 reflect longstanding trends. Although murders did spike in Chicago last year, New York has been doing better than Chicago on this score for a long time. The two cities had essentially identical per capita homicide rates in the late 1980s, but New York’s fell much faster and further than Chicago’s in the 1990s. New York has maintained a wide advantage ever since.
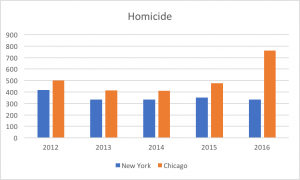
Still, the dramatic widening of that advantage in 2016 should be of great concern to Chicagoans. The chart below indicates the trends in recent years, based on FBI data. Note that the two cities moved in sync from 2013 through 2015: homicides down the first year, basically unchanged the next, and then up a little in 2015. However, in 2016, even as Chicago’s homicides shot up, New York’s dropped back down to where they had been in 2013 and 2014.
One should not get the sense, however, that one faces a dramatically elevated risk of violence throughout the Windy City.
Instead, maps of homicide rates in Chicago reveal that many neighborhoods have few if any killings, especially those on the city’s North Side. On the other hand, as the New York Times has reported, “the South and West Sides are on par with the world’s most dangerous countries, like Brazil and Venezuela, and have been for many years.” These same neighborhoods also tend to be the city’s most racially segregated and are marked by high levels of poverty.
The persistent differences between New York and Chicago likely have a variety of causes. A Times article from last year highlights a few: New York expanded the size of its police force much more aggressively in the 1990s, coinciding with the time that New York’s homicide rate dropped below Chicago’s; guns seem easily available in Chicago, with penalties for illegal possession more lenient than in New York; gang problems seem to be worse in Chicago at present; and racial segregation is far worse.
What about Milwaukee? The MPD reports 131 homicides in 2016. With a population of about 600,000, that amounts to nearly 22 homicides per 100,000 residents. This beats Chicago’s rate of 28 per 100,000, but falls short of New York’s 4.
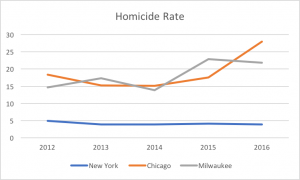
The chart below depicts trends in recent years. Milwaukee’s numbers have generally mirrored Chicago’s, albeit fortunately without the great homicide surge of 2016. Both cities, it should be noted, have tended to have homicide rates far lower than that of a number of other American cities, including New Orleans, St. Louis, and Detroit.
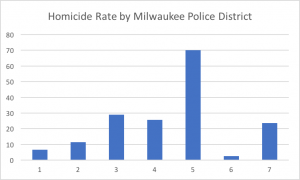
As with Chicago, different neighborhoods in Milwaukee present very different risks of lethal violence. The final chart below depicts the 2016 homicide rate by police district in the city. Not surprisingly, District Five, on the city’s near north side, had the highest rate. This area of Milwaukee presents some of the same features of concentrated disadvantage that one can find in some of the Chicago neighborhoods with the highest homicide rates.