In a recent article for the Milwaukee Journal Sentinel, Craig Gilbert described how Scott Walker’s 2018 election loss was the result of declining support across all kinds of populous villages and cities in Wisconsin.[1] Walker averaged a 10% decline in places with at least 30,000 people, a 9% decline in places with 10,000 to 30,000, a 6% decline in places with 5,000 to 10,000, and a 3% decline in places with 2,000 to 5,000 residents.
Things improved for Walker in Wisconsin’s numerous small communities. His performance fell by just 0.6% in municipalities with 1,000 to 2,000, and he actually improved over 2014 in communities with less than 1,000 residents.
The overall trend is shown in the graph below.
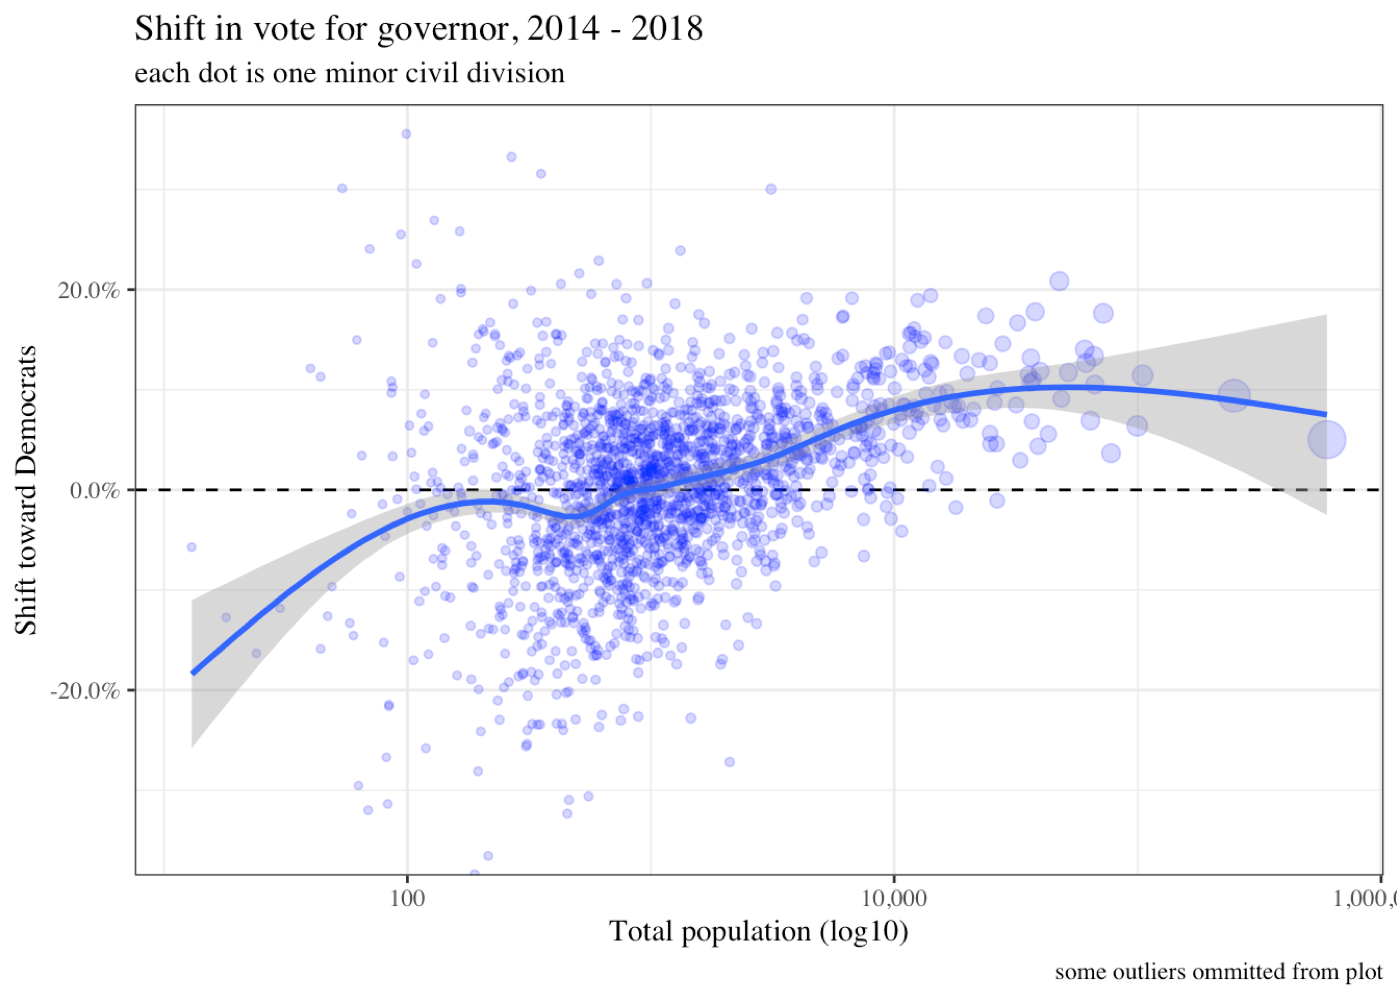
Even though Walker beat his 2014 performance in over 40% of Wisconsin communities, these places only represent 16% of the state’s adult citizens.
An uneven Democratic wave
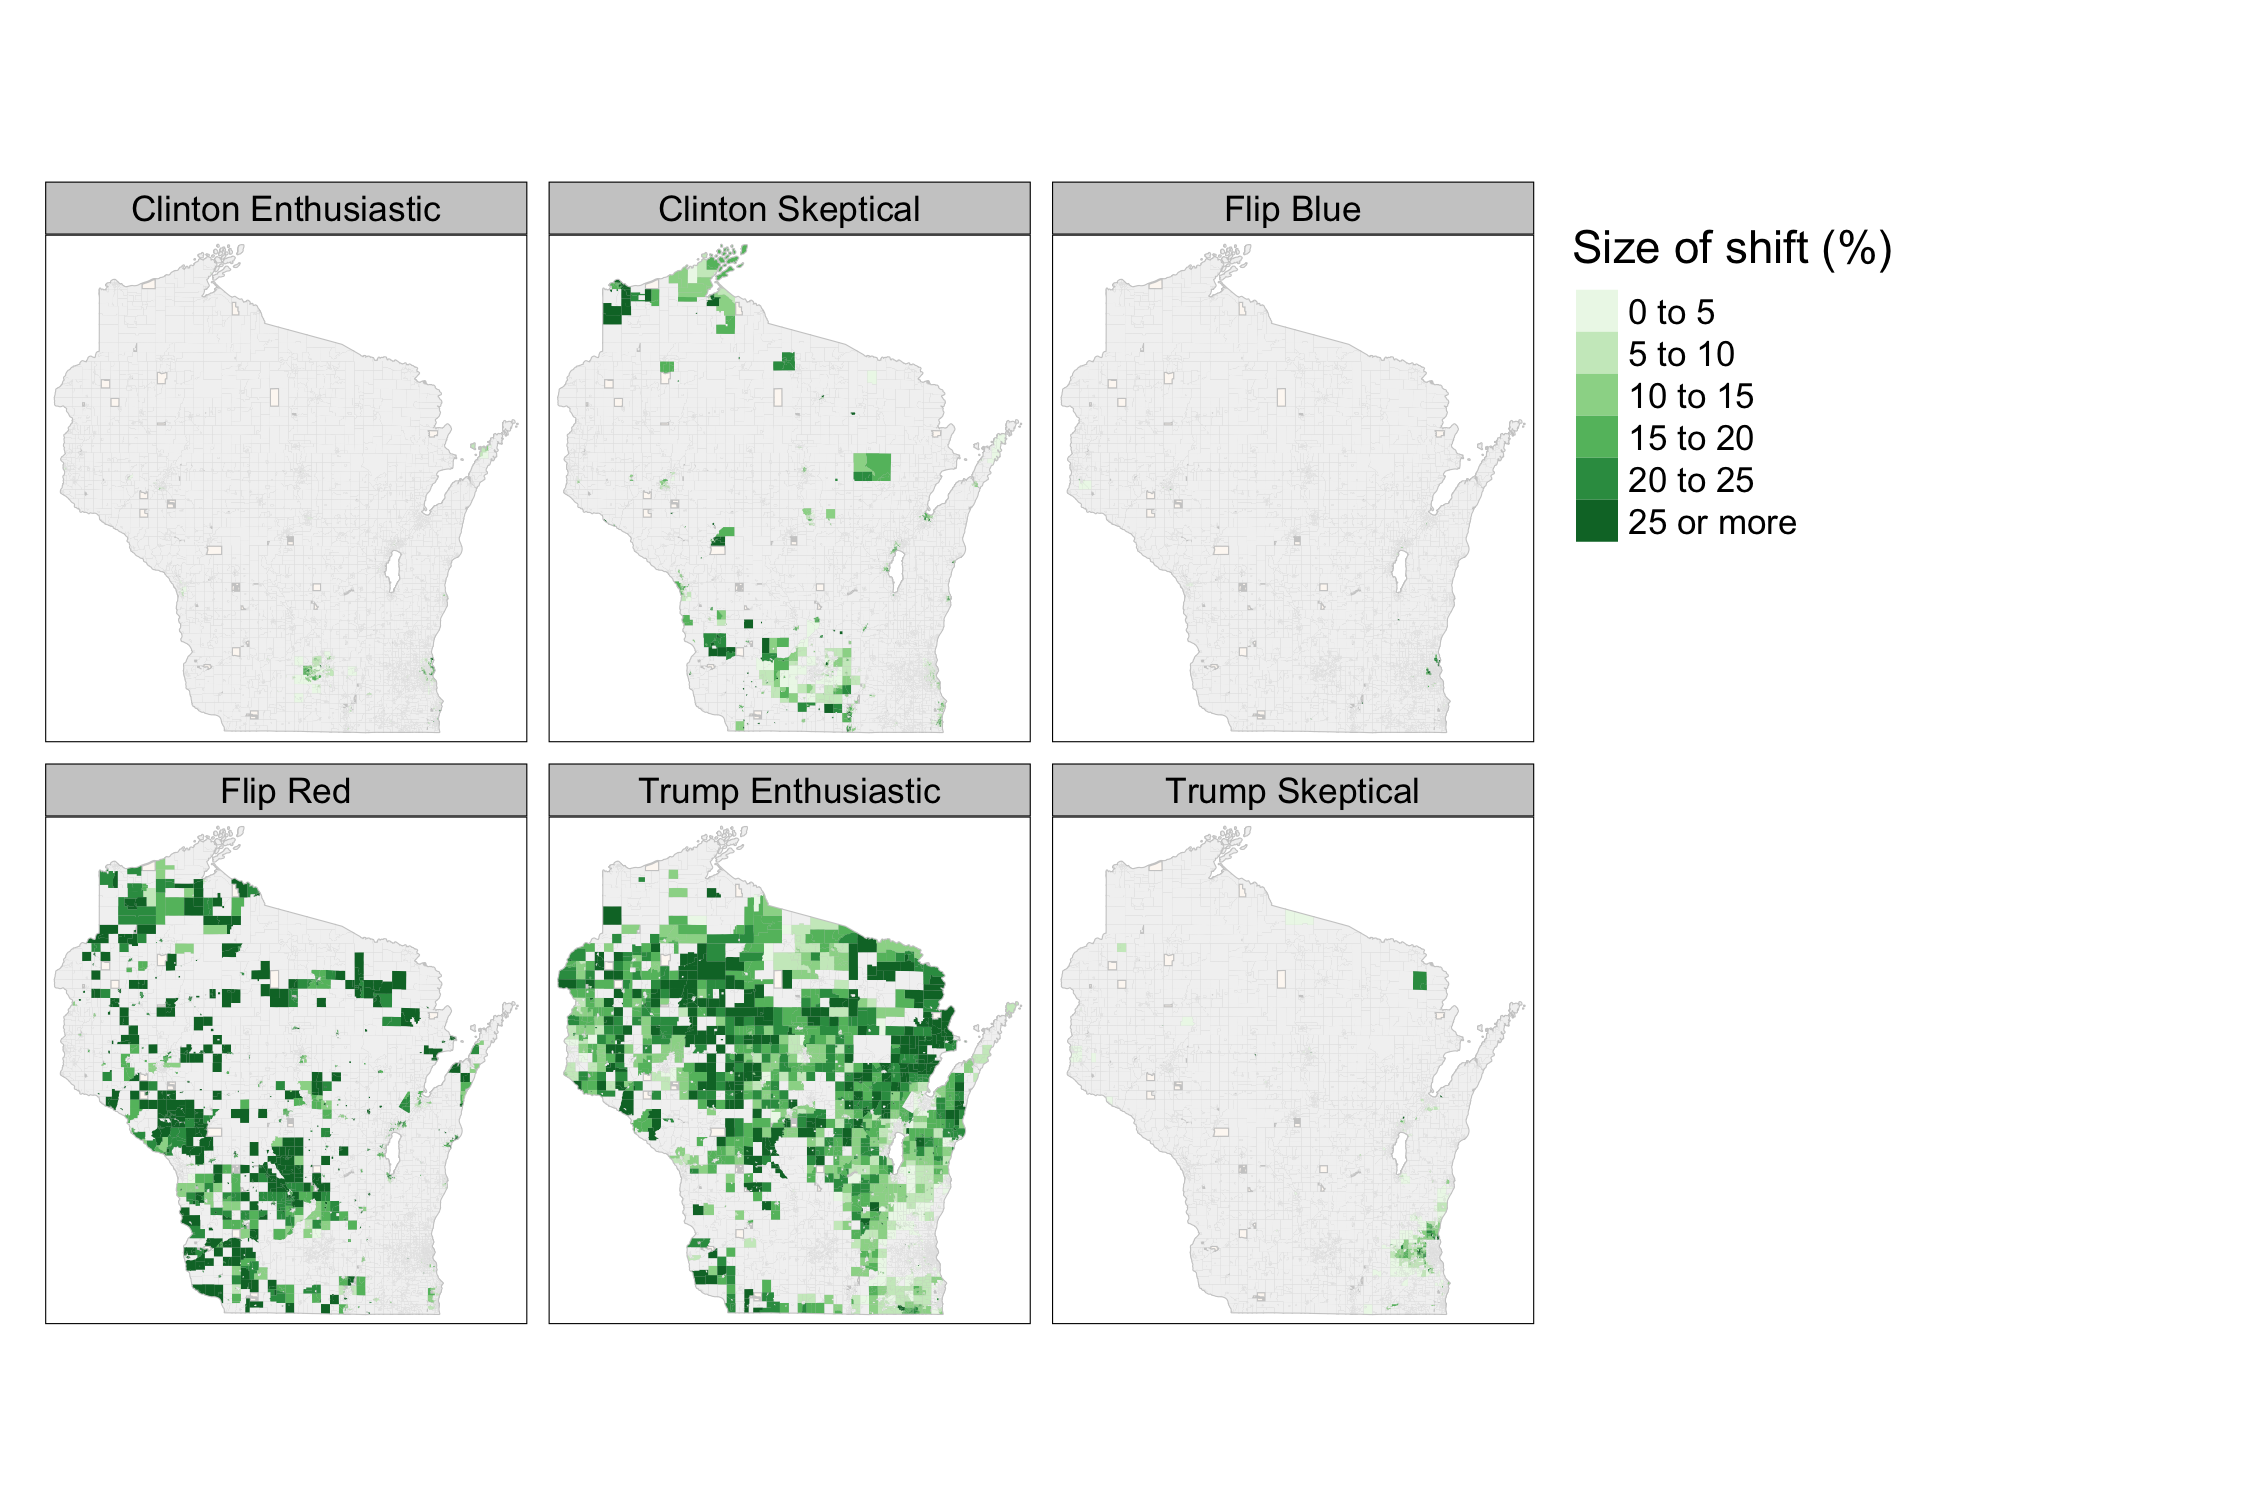
I divide the state’s communities into 6 categories based on their shift between the 2012 and 2016 presidential elections.[2]
- FLIP BLUE: 5 communities turned blue in 2016 (pop. 17,000).
- FLIP RED: 543 communities turned red (pop. 847,000).
- TRUMP ENTHUSIASTIC: 977 communities voted for Romney and Trump, and gave Trump an even larger victory (pop. 1,631,000)
- TRUMP SKEPTICAL: 85 communities voted for Romney and Trump, but gave Trump a narrower victory (pop. 700,000).
- CLINTON ENTHUSIASTIC: 46 communities voted for Obama and Clinton, and gave Clinton an even larger victory (pop. 582,000).
- CLINTON SKEPTICAL: 213 communities voted for Obama and Clinton, but gave Clinton a narrower victory (pop. 1,937,000).
Clinton Enthusiastic places include Madison and some of the mostly-wealthy Madison and Milwaukee suburbs. Clinton Skeptical areas include the more peripheral Madison-area suburbs as well as some of the traditional northwestern Democratic strongholds. The only two places of any size which flipped blue are River Falls and Hudson–both located in the St. Paul suburbs.
Communities which flipped red are strewn across the western half of the state with concentrations in the southwestern Driftless Area as well as the northwestern Lake Superior coastal counties of Douglas, Bayfield, and Ashland. Trump Enthusiastic areas cover most of the remaining rural northern half of the state. Trump Skeptical areas are predominantly located outside of Milwaukee in suburban Waukesha and Ozaukee counties.
 2018 was a Democratic wave year, and Evers improved over Mary Burke’s margin in every type of community. However, the 2012-2016 shifts described above still had enduring consequences for the 2018 gubernatorial race.
Summarizing the entire vote in each category reveals that Walker won the vote in communities which flipped red in 2016 while Evers narrowly won in places which flipped blue. But the largest and most notable shifts relative to 2014 occurred in Clinton Enthusiastic and Trump Skeptical places, which shifted 13% and 12% toward the Democrats, respectively. These categories represent the two partisan poles of the state. Evers won Clinton Enthusiastic places by 47%; he lost Trump Skeptical places by 29%. But the trend in each place was nearly identical–a double-digit swing toward the Democrats.
In other words, the areas which shifted the most away from the Republican candidate in 2016 were the most Republican parts of the state. Communities which were the most supportive of the pre-Trump Republican Party were the least satisfied with Trump. At least to some extent, that dissatisfaction carried over to 2018. Likewise, support for the Democrats only intensified in communities which were already enthusiastic about Clinton.
2018 governor’s vote trends by category
| MCD count | Population | % of Pop. | Evers’ margin | Clinton’s margin | Burke’s margin | Shift from 2016 | Shift from 2014 | |
| Clinton Enthusiastic | 46 | 582086 | 10.2 | 47.2 | 45.8 | 34.4 | 1.5 | 12.8 |
| Clinton Skeptical | 213 | 1937002 | 33.9 | 29.8 | 25.6 | 23.2 | 4.1 | 6.6 |
| Flip Blue | 5 | 17447 | 0.3 | 0.2 | 1.2 | -9.0 | -1.1 | 9.2 |
| Flip Red | 543 | 847386 | 14.8 | -6.0 | -11.8 | -7.2 | 5.7 | 1.1 |
| Trump Enthusiastic | 977 | 1630848 | 28.5 | -27.8 | -29.3 | -31.1 | 1.6 | 3.3 |
| Trump Skeptical | 85 | 700210 | 12.3 | -29.2 | -22.8 | -41.1 | -6.4 | 11.9 |
Most of Wisconsin’s wards (52%) experienced flip-flopping trends between the last two races for president and governor. They voted more for Trump than for Romney, but supported Evers more than Burke. Twenty-nine percent of wards shifted in a Republican direction each time. Nineteen percent of wards moved toward both Clinton and Evers. Virtually nowhere moved Democratic in presidential voting and Republican in gubernatorial races.

These divisions have a strong geographic component. Imagine a diagonal line stretching across the state from Green Bay to where the Wisconsin River meets the Mississippi. Trump/Walker trending places are strongly concentrated north of that line.
Clinton/Evers places, by contrast, are mostly south of that line. They include Madison and some suburbs, Milwaukee’s suburbs (but not the city itself), and a few communities in the Fox Valley. A handful of more rural population centers in the northern and western parts of the state are also trending Democratic. Most notably, Democrats have been gaining ground consistently in the Wisconsin suburbs of St. Paul.
The flip-floppers are spread across the state. They make up most of the populous south-eastern half of the state apart from the Clinton/Evers communities.

In another post-election column, Craig Gilbert observed that despite the partisan changes taking place around Wisconsin, “the state persists as a partisan battleground because all those regional shifts over the past two decades have somehow canceled each other out.”[3] Judging by the past two gubernatorial and presidential election cycles, Wisconsin can currently be divided into three general regions. Republican-trenders, Democratic-trenders, and a sizeable third group which moves whither the political winds blow.
[1] https://www.jsonline.com/story/news/blogs/wisconsin-voter/2018/12/22/loss-support-broad-set-cities-suburbs-walkers-undoing/2386626002/
[2] 42 minor civil divisions have missing data and are excluded from the analysis.
[3] https://www.jsonline.com/story/news/blogs/wisconsin-voter/2018/11/30/wisconsin-undergoes-political-shifts-while-somehow-staying-purple/2160683002/
[4] Ward analysis is conducted using the LTSB’s disaggregated ward files.