The dramatic consequences of the late 2000s subprime mortgage crisis on Milwaukee neighborhoods are well known, but specific data on foreclosures has been remarkably difficult to come by.
Previous studies have documented plummeting homeownership across the city (particularly on the north side), followed by a surge in out-of-state investment. But researchers have lacked public data on how many foreclosures occurred, who initiated them, which properties experienced them, and the subsequent ownership history of those parcels. To fill that gap, I have assembled a novel dataset of residential foreclosures matched to city parcel records for the years 1995 through 2022. This includes all detached single family homes, condos, duplexes, and triplexes. See the data note at the end of this article for details.
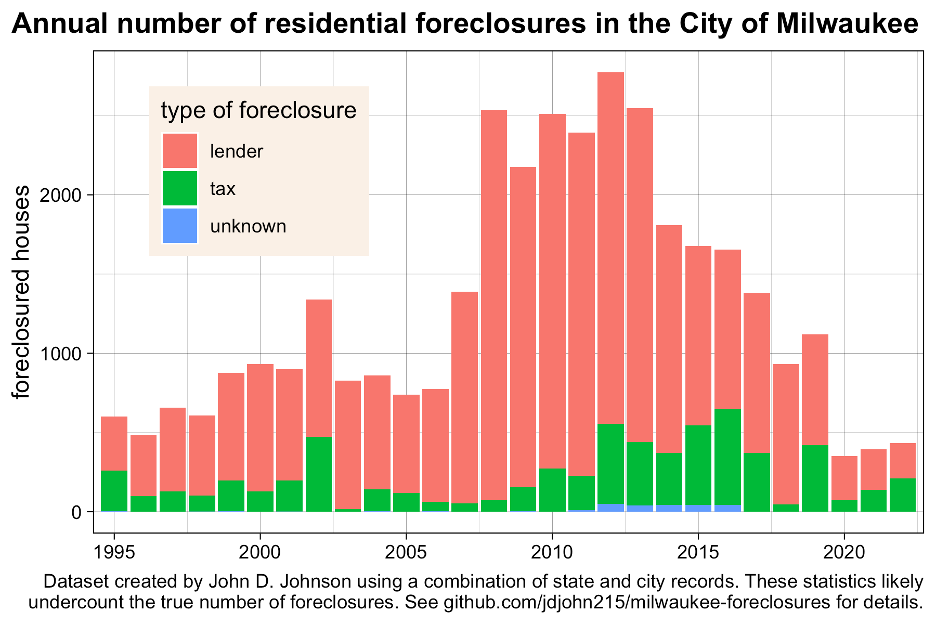
From 1995 through 2006, the city saw an average of 800 house foreclosures a year. Then, in 2007, there were over 1,300 foreclosures. That jumped again to almost 2,500 in 2008. During the decade of 2007-2016 my records show a total of 21,500 foreclosures.
The pandemic, with its attendant boom in home values, saw foreclosures drop to their lowest levels since at least 1995. I found records of 351 foreclosed homes in 2020, 393 in 2021, and 434 in 2022.
Over the past 3 years, foreclosures by lenders have declined, likely because rising home values mean that few homeowners find their mortgages underwater. A homeowner struggling to make their mortgage payment can often avoid foreclosure by selling the house for a profit.
By contrast, foreclosures over delinquent taxes grew from 72 in 2020 to 138 in 2021, and 211 last year. As property values increase, the number of owners struggling to pay their tax bill may be increasing.
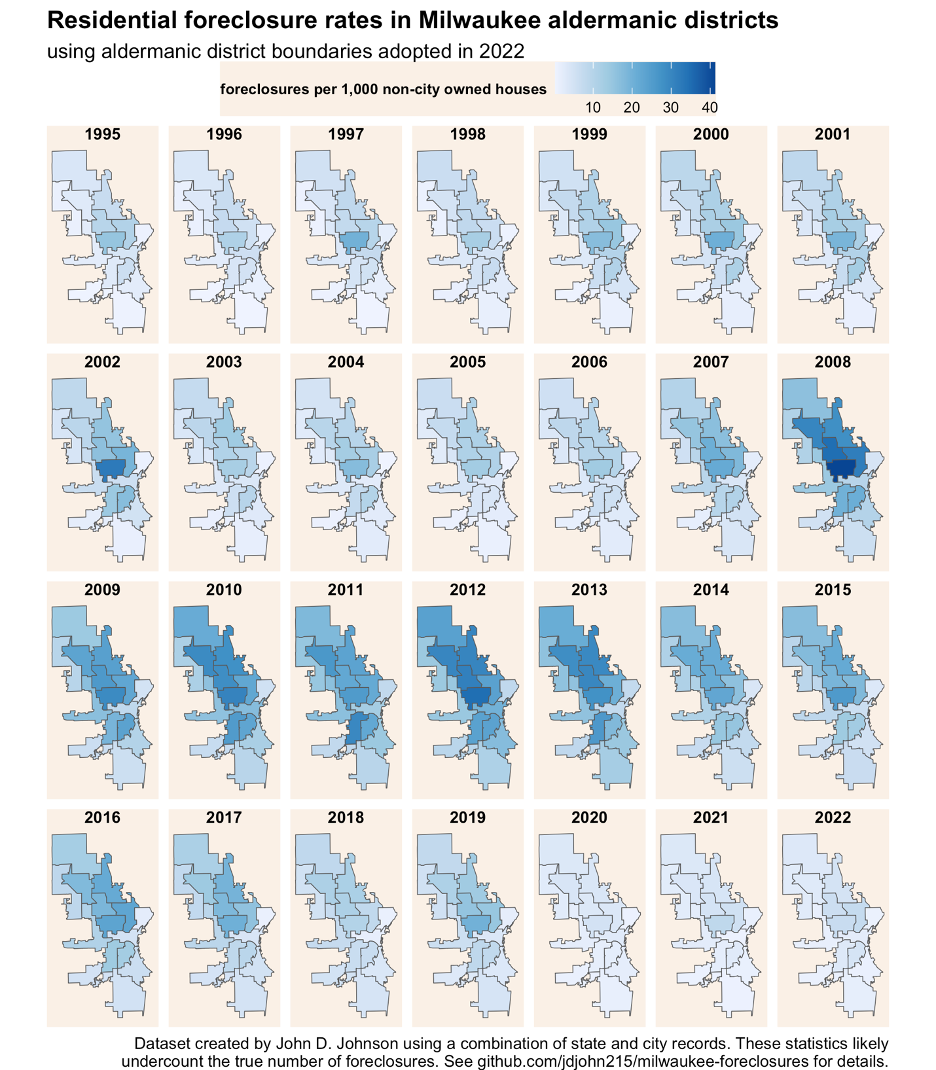
The wave of foreclosures during the housing crisis was geographically concentrated in poor and majority nonwhite neighborhoods. In 2012, for instance, the 3rd aldermanic district (covering the east side) experienced 54 foreclosures, or a rate of 8 per 1,000 houses. The neighboring 6th district simultaneously saw 217 foreclosures, a rate of 24 per 1,000. Meanwhile, homes in the 15th district (covering parts of the near west and near north sides) were foreclosed on at a rate of 35 per 1,000 just in 2012 alone.
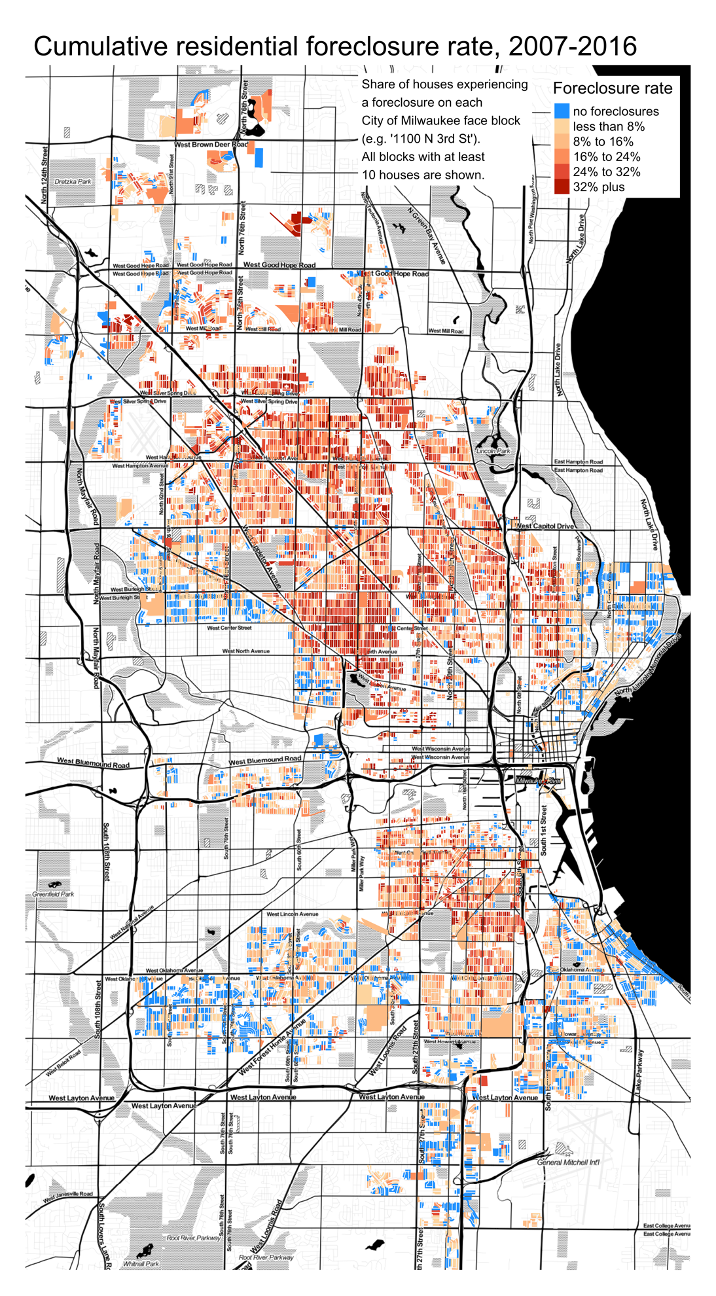
The cumulative effect after a decade of unrelentingly high foreclosure rates is mindboggling. Citywide, 14% of all houses experienced at least one foreclosure from 2007 to 2016. In Sherman Park and Washington Park, more than 3 out of every 10 houses were foreclosed on. Other parts of the city escaped practically unscathed. In the Upper East Side, fewer than 1-in-25 homes were foreclosed.
The map below shows the cumulative 2007-2016 foreclosure rate for each residential block in the city with at least 10 houses. Blocks shaded in blue experienced no foreclosures at all during the decade. The more than 500 blocks shown in the darkest shade of red experienced foreclosure rates of 32% or more. In 33 blocks, more than half of houses were foreclosed on between 2007 and 2016. And on the 2400 block of North 44th Street fully three quarters of homes—21 out of 28—received a foreclosure.
Needless to say, the wave of foreclosures closely follows the declines in owner-occupancy since the Great Recession. Of all the properties which received a foreclosure between 2007 and 2016, 62% (over 13,000 homes) were owner-occupied at the beginning of the year in which the foreclosure occurred, according to city parcel data.
Often, foreclosed properties during this period were sold at auction or at bargain prices to cash buyers. Once outside the owner-occupied housing market, houses often remained held by investors. Since about 2018, several corporate landlords with private equity backing have assembled large portfolios in these neighborhoods, largely by consolidating the holdings of the smaller landlords who preceded them.
Foreclosures cast a long shadow, and the effects of the subprime mortgage crisis are still shaping many Milwaukee neighborhoods more than a decade after the Great Recession officially ended.
Data note
This foreclosure dataset combines several sources. Foreclosure records from 1995-2016 are sourced from an owner history dataset maintained by the Milwaukee City Assessor’s office. (Special thanks to Jeff Arp for his help). Records from 2017-2022 are from the Real Estate Transaction Returns filed with the Wisconsin Department of Revenue. I matched each source dataset to city parcel records, which allowed me to standardize addresses as well as identify the property type and ownership status at various points in time. In all likelihood, this dataset undercounts the true number of foreclosures because some foreclosure records could not be matched to parcel data or were otherwise missing.
Researchers and community groups are encouraged to explore the data for their own uses. Files are available at https://github.com/jdjohn215/milwaukee-foreclosures. Please direct questions to john.d.johnson@marquette.edu.