
All 99 Wisconsin assembly districts swung left in 2026, in the sense that David Crowley improved over Kamala Harris’ 2024 margin in each one. But the size of the swing varied by an order of magnitude.
The smallest swing of them all was just 2 points, and the location should be easy to guess. It came in Tom Tiffany’s district of residence, the 34th, home to Northwoods towns like Minocqua, Rhinelander, and Eagle River. Here, Trump won by 20 points in 2024 and Tiffany by 18 points in 2026.
If you’ve been following the national analysis of this election, you probably won’t be surprised by where the largest swings in a Democratic direction came, either. Two districts stand apart from any other. They are the adjacent 8th and 9th districts, both on Milwaukee’s near south side and the only two districts where Latinos make up a plurality of adult citizens. In both of these districts, Crowley improved over Trump by 26 points.
Southern Milwaukee County, generally, swung especially hard to the left. Besides the 8th and 9th districts, the next three largest swings were the 7th district also on Milwaukee’s south side (+19), the 21st in Oak Creek (+17 and a Democratic flip), and the 20th in South Milwaukee (+16).
In the City of Milwaukee, David Crowley was more popular than any other candidate for governor, president, or US Senate since at least 2000. He won 85% of the vote in the city. By comparison, Herb Kohl won 81% in 2006; Obama won 78% in 2008 and 79% in 2012.
Zooming out a bit, this map shows the size of the swing in each district of the state. Although every district moved left relative to 2024, the lightest shade shows where the shift was considerably smaller than the statewide 9-point shift. This category includes the Northwoods and also much of suburban southeastern Wisconsin.
There is a subtlety worth noting here. The Northwoods counties had previously moved pretty hard to the right, while the three major suburban WOW counties actually gave Harris more of their vote than Biden in 2020. So the relatively small leftward tilt of the suburban counties this year is at least partly a consequence of those counties having already moved to the left, even in 2024. They are colored the same way on this map, but the suburban southeastern counties and the rural Northwoods counties are moving in opposite directions when viewed on a longer timescale.
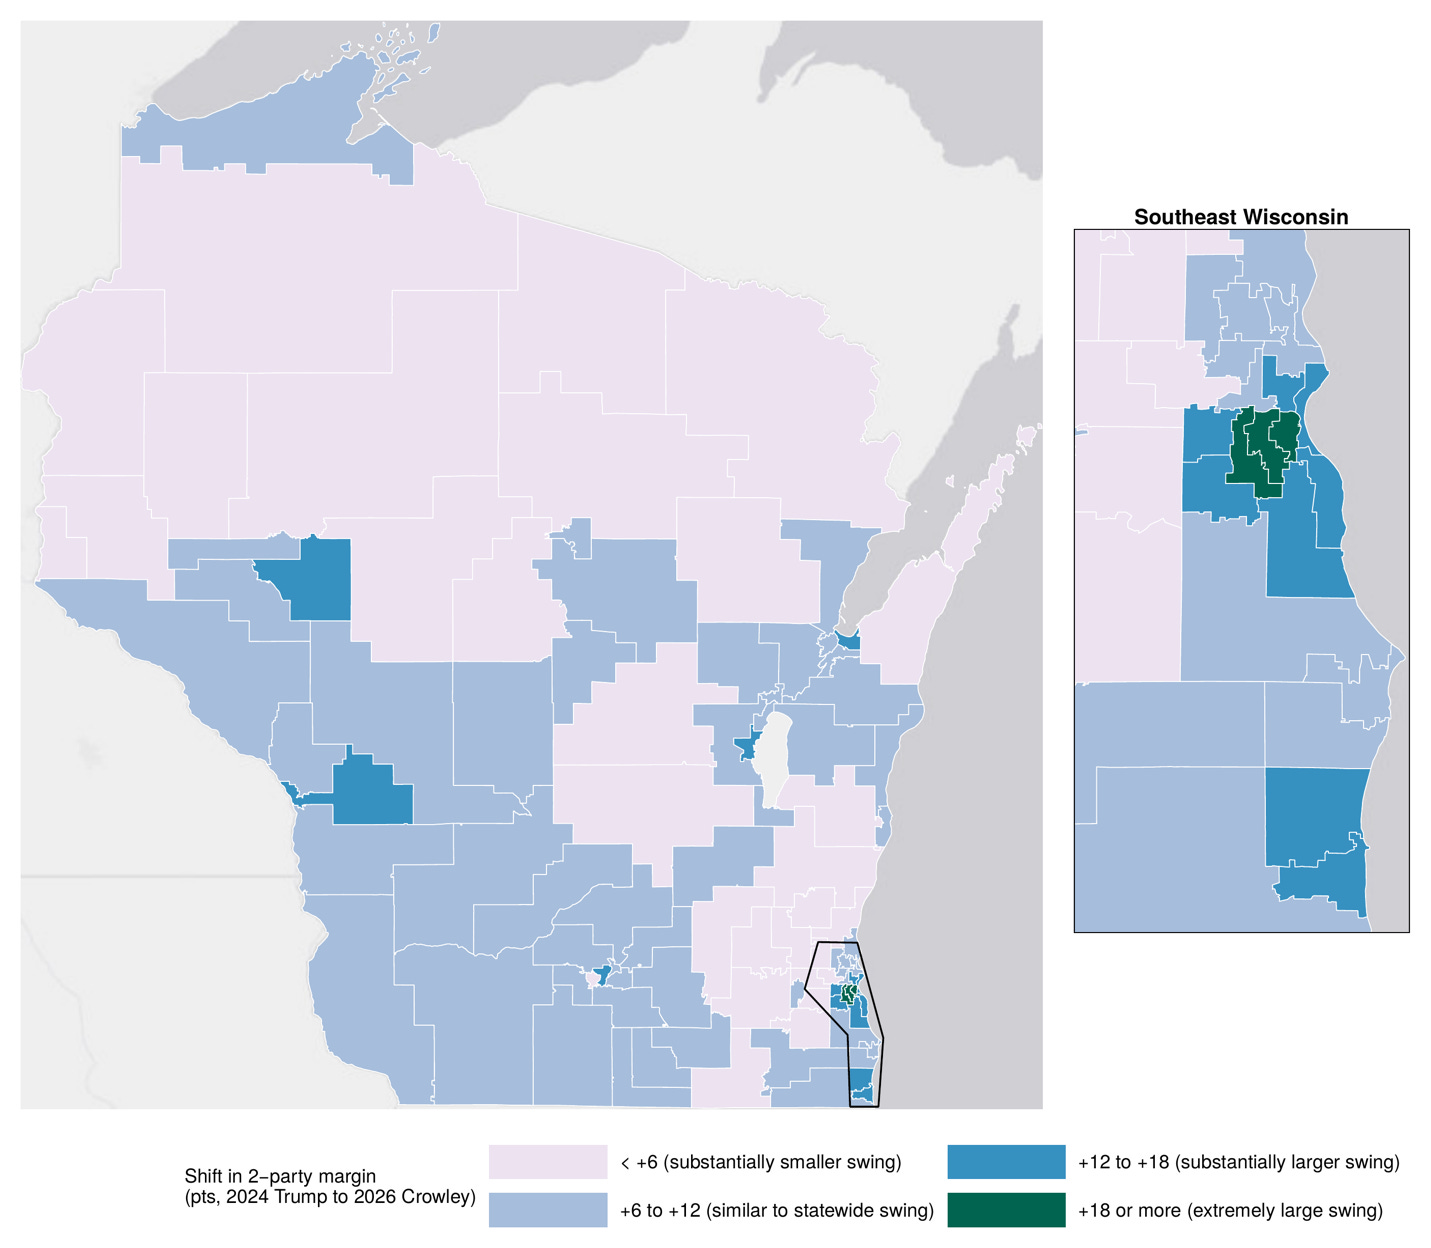
The next-lightest shade of blue shows where the swing about matched the state result, plus or minus a few points. This includes most of the Madison and Driftless area in the southwestern part of the state, along with most of the Fox Valley. The bigger swings shown in dark blue happened in districts covering some major cities—La Crosse, Eau Claire, Oshkosh, Green Bay, Kenosha, and the southern Milwaukee suburbs.
Finally, the three districts shown in green stand wholly apart from the rest. These districts, discussed above, are where Crowley improved by more than 18 points over Trump. Not coincidentally, they are home to the three most-Latino districts and they are also some of the districts where Trump in 2024 improved the most over Trump in 2020. In other words, Trump made big inroads with these voters two years ago, but they abandoned his party on Tuesday.
The Declining Premium for Assembly Republicans
Over the last quarter century, elections for state legislature have become extremely closely correlated with the race at the top of the ticket. But some ticket-splitters remain, and, more often than not, these voters with split loyalties have picked the Republicans further down the ballot. The basic problem for Democrats has been that their state legislative candidates are consistently less popular than the Democrat at the top of the ticket.
Take Donald Trump’s 3 presidential elections by way of illustration. Across all three of them, the local Republicans did between 3.5 and 4 points better, on the margin, than Trump. A meaningful number of voters were willing to vote for the local Republican but not the man at the top of the ticket. This is not just a Trump thing, either. In 2018 and 2022, assembly Republican candidates also ran ahead of their gubernatorial candidates Scott Walker and Tim Michels.
Much, but not all, of this can be attributed to incumbency advantage. In the recent past there have always been more Republican than Democratic incumbents, so even if incumbents from both parties benefit from their experience and name recognition equally, the net effect will surely benefit the GOP. However, in 2024, it wasn’t just Republican incumbents who ran ahead of Trump. In open seats, with no incumbent running, the local Republicans ran 2 points ahead of Trump across 23 races.
But this once-reliable advantage for assembly Republicans faltered in 2026 and even disappeared in a few key races. Take the three most surprising Democratic legislative wins—the 85th (Wausau), the 92nd (Menomonie), and the 30th (River Falls) districts. Each of these voted for Trump in 2024, and in each place the Republican assembly candidate performed as well or better than Trump. All three of these incumbents were seeking reelection in 2026. When I saw that they had lost their races, I assumed that Crowley’s strong performance was enough to overcome their own strength as incumbents, but in reality, each of these Republican incumbents actually ran behind Tom Tiffany.
Take the 30th district, for example. Here, a local Democratic schoolteacher named Kevin Knoke challenged the Republican incumbent Shannon Zimmerman in a seat covering Wisconsin exurbs of Minnesota’s Twin Cities. Trump won this district by 4.5 points in 2024. Meanwhile, Zimmerman nearly doubled Trump’s margin, winning his race by 8.5 points. In 2026, David Crowley squeaked out a 1-point win in the 30th district. With a top-of-the-ticket margin this close, I would normally expect Zimmerman’s track record as an incumbent to save him. Instead, Knoke beat him by 6 points.
In other words, quite a few voters in this district voted for Tom Tiffany for governor and the Democratic challenger for assembly. That’s a big deviation from the way things normally go in Wisconsin.
Similarly, in the 92nd, the Democratic challenger Jeremiah Fredrickson defeated incumbent Republican Clint Moses by 7 points in a district Crowley won by 4. In Wausau’s 85th seat, Democrat John Kroll defeated Republican incumbent Patrick Snyder by 8 points to Crowley’s 7—this after Snyder won by 6.5 points to Trump’s 1-point victory in 2024.
Here are the numbers from across every contested assembly race. In the aggregate, Republicans in open assembly races still ran better than their standard bearer, but the size of their advantage fell by 62%. The advantage to Republican incumbents fell by 73%.
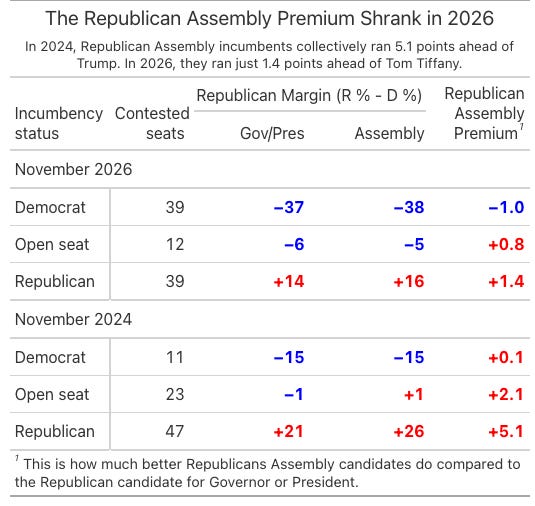
You could interpret these results in a couple ways, both of which are probably true. It’s getting tougher for local candidates to differentiate themselves from the national party’s brand. Republican incumbents, as a whole, were still more popular than Tiffany, but their advantage over Tiffany was much smaller than their advantage over Trump.
In a few cases, like the 30th and 92nd districts, the local Democratic challengers were actually more popular than Crowley, and this local appeal was instrumental in helping flip those seats. Here, Democrats succeeded in recruiting uniquely popular candidates. The parties always say they are doing this, but this time it seemingly worked. We have some insight into what happened in the 92nd, thanks to reporting by Dan Shafer.
Fredrickson explained his decision to run this way: “[US Senator] Tammy [Baldwin] called me back in December and said, ‘you’re a farmer, you’re a former teacher, and you’re a small business owner — you’re like the trifecta as far as a candidate goes.’ So, her voice carries a fair amount of weight…It was that one phone call that pushed me over the edge.”
In a wave election, everything goes right. Wisconsin’s Democrats in 2026 paired an incredibly favorable national environment with high-quality candidates where it mattered most. The result is multi-seat majorities giving them at least a little bit of breathing room in the state legislature.
Here are a few files for readers who want to dig deeper into the results.
- This is an interactive map of every assembly district. Click on a district to compare the 2026 assembly and governor results with past elections for president and governor going back to 2016.
- This 11×17 graphic compares how the assembly margins shifted from 2024 to 2026 in each district with contested elections in both years.
- This 11×17 graphic compares how the top-of-the-ticket margins (president to governor) shifted from 2024 to 2026 in each district.
- This 11×17 graphic compares the governor margin with the assembly margin in each district with a contested election in 2026.