Attention to news in 2025
What we noticed and what we ignored
Time for a look back at the news of 2025 and what the public paid attention to and what it largely ignored. The year has not lacked for news, especially political news as Donald Trump expanded his authority through executive orders, followed by litigation over those orders.
My Marquette Law School Poll asks how much people have heard or read about recent events in the news in each poll:
Here are some recent topics in the news. How much have you heard or read about each of these?
Polls are conducted every other month, six times a year. This is not a comprehensive review of news events but provides a look at how much attention the public gave to a wide variety of mostly political news. Topics are picked from recent events that have received significant coverage and raise important political issues, with more emphasis on news stories published within a few weeks of each poll’s field dates.
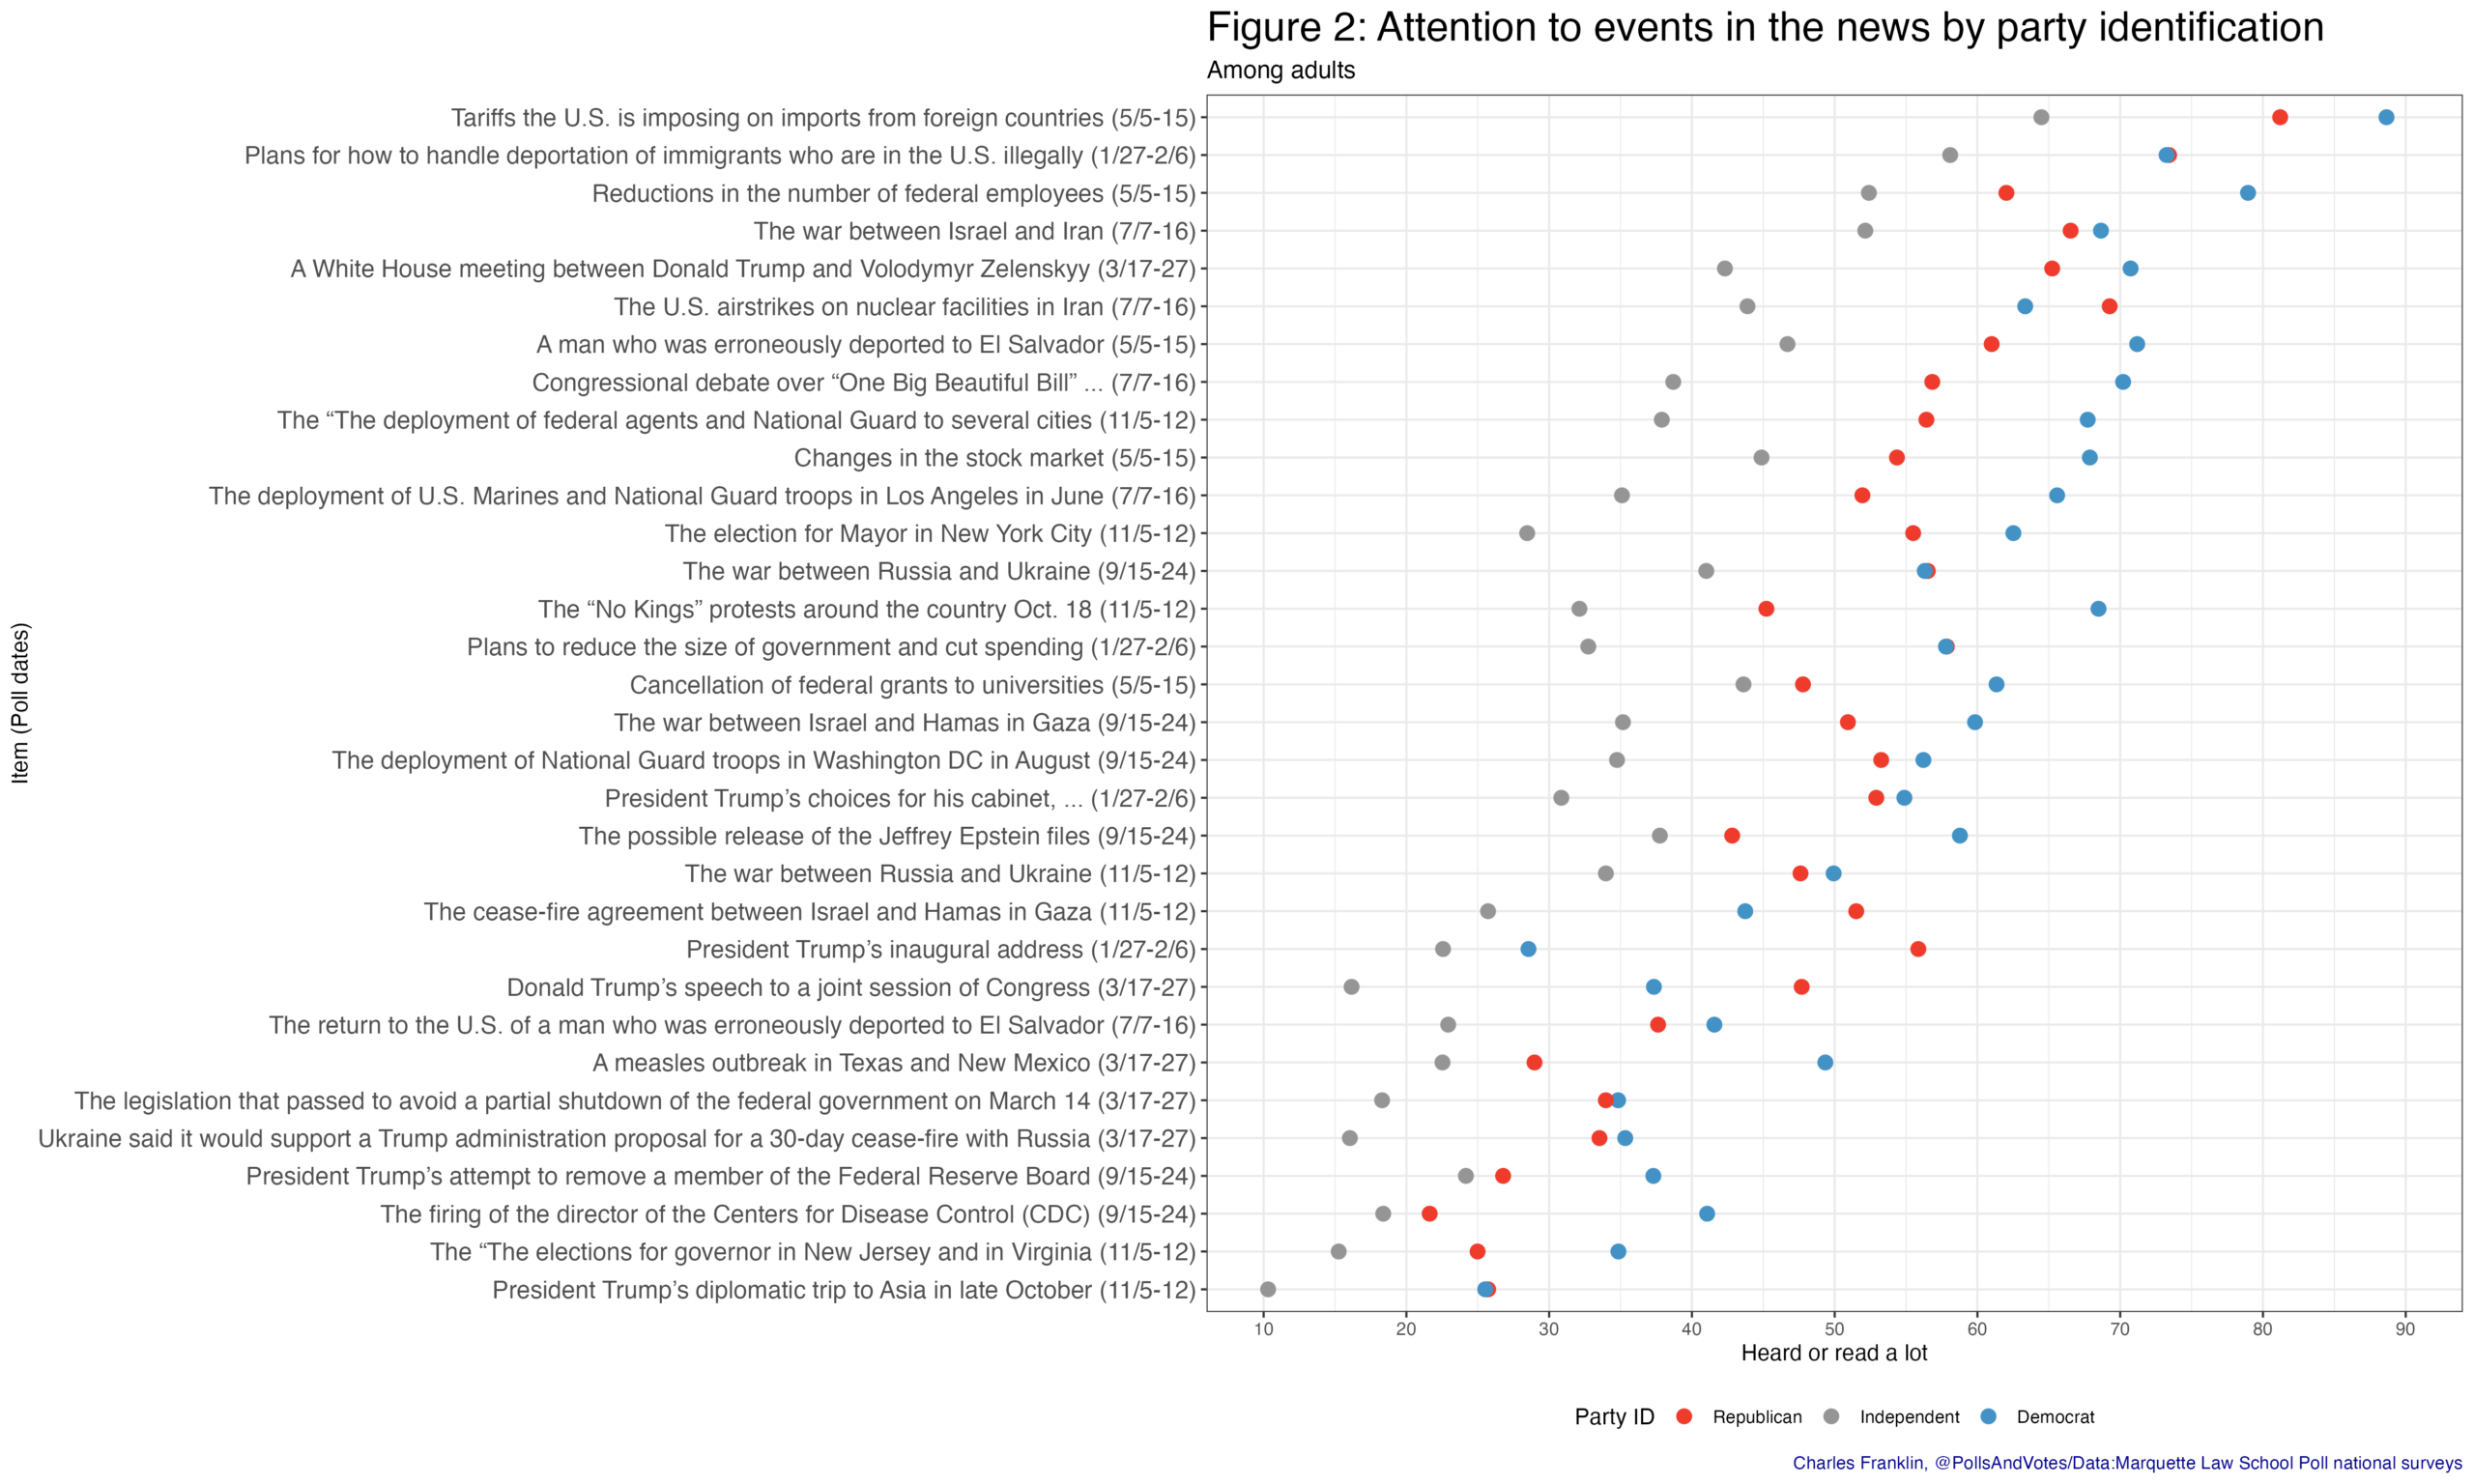
Figure 1 shows the 32 topics asked about over the year.
The top topic of the year, by a substantial margin, is tariffs. The May survey came a month after Trump’s “Liberation Day” announcement of tariffs on April 2 and the subsequent changes made in rates and implementation dates. Fully 81% of U.S. adults said they had heard or read a lot about the tariffs.
The second most attention went to Trump’s plans for deportation of immigrants in the U.S. illegally, with 70% hearing a lot about this in the first month of the administration. Subsequent items concerning immigration issues varied in visibility, with the mistaken deportation of a man, Kilmar Abrego Garcia, who was sent to El Salvador in March ranking as the 7th most followed event, with 63% hearing a lot. When Garcia was returned to the U.S. in June, only 37% heard a lot about that, ranking 25th of 32 news items.
Cuts to the federal workforce ranked 3rd most followed story, with 67% hearing a lot as of May. Rounding out the top five news items were the war between Israel and Iran in June and the contentious meeting between Trump and Ukraine President Volodymyr Zelenskyy on February 28th in the Oval Office. U.S. airstrikes on nuclear facilities in Iran ranked 6th.

At the bottom of the chart are Trump’s attempts to remove a member of the Federal Reserve Board and the firing of the director of the Centers for Disease Control, followed closely by 30% and 29% respectively.
If you follow politics enough to be reading this post you will probably to shocked that attention to the November elections for governor in New Jersey and Virginia ranks 31st of 32 events, with only 28% hearing a lot about this. For us political junkies, it is a reminder that much of the public doesn’t follow politics closely, and especially not elections in states other than their own.
The honor of being the least followed of the 32 stories is Trump’s extended diplomatic trip to Asia in late October, during the shutdown of the federal government, with only 24% who paid a lot of attention to that trip.
Attention to news by party
Figure 2 shows attention to these news topics by party. A higher percentage of Democrats than Republicans say they have read or heard a lot about most of the news events covered during 2025. By comparison to either party, independents are considerably less likely to have followed news across every item.
Highly visible events receive more attention across all partisan lines while more obscure events are also followed less by each party group. The correlation of attention for Democrats and Republicans is .78. Independent attention correlates with Democratic attention at .91, and with Republican attention at .85. In short, news tends to penetrate each partisan group in similar ways though with generally lower attention from Republicans and especially independents.
Republican vs Democratic attention to news
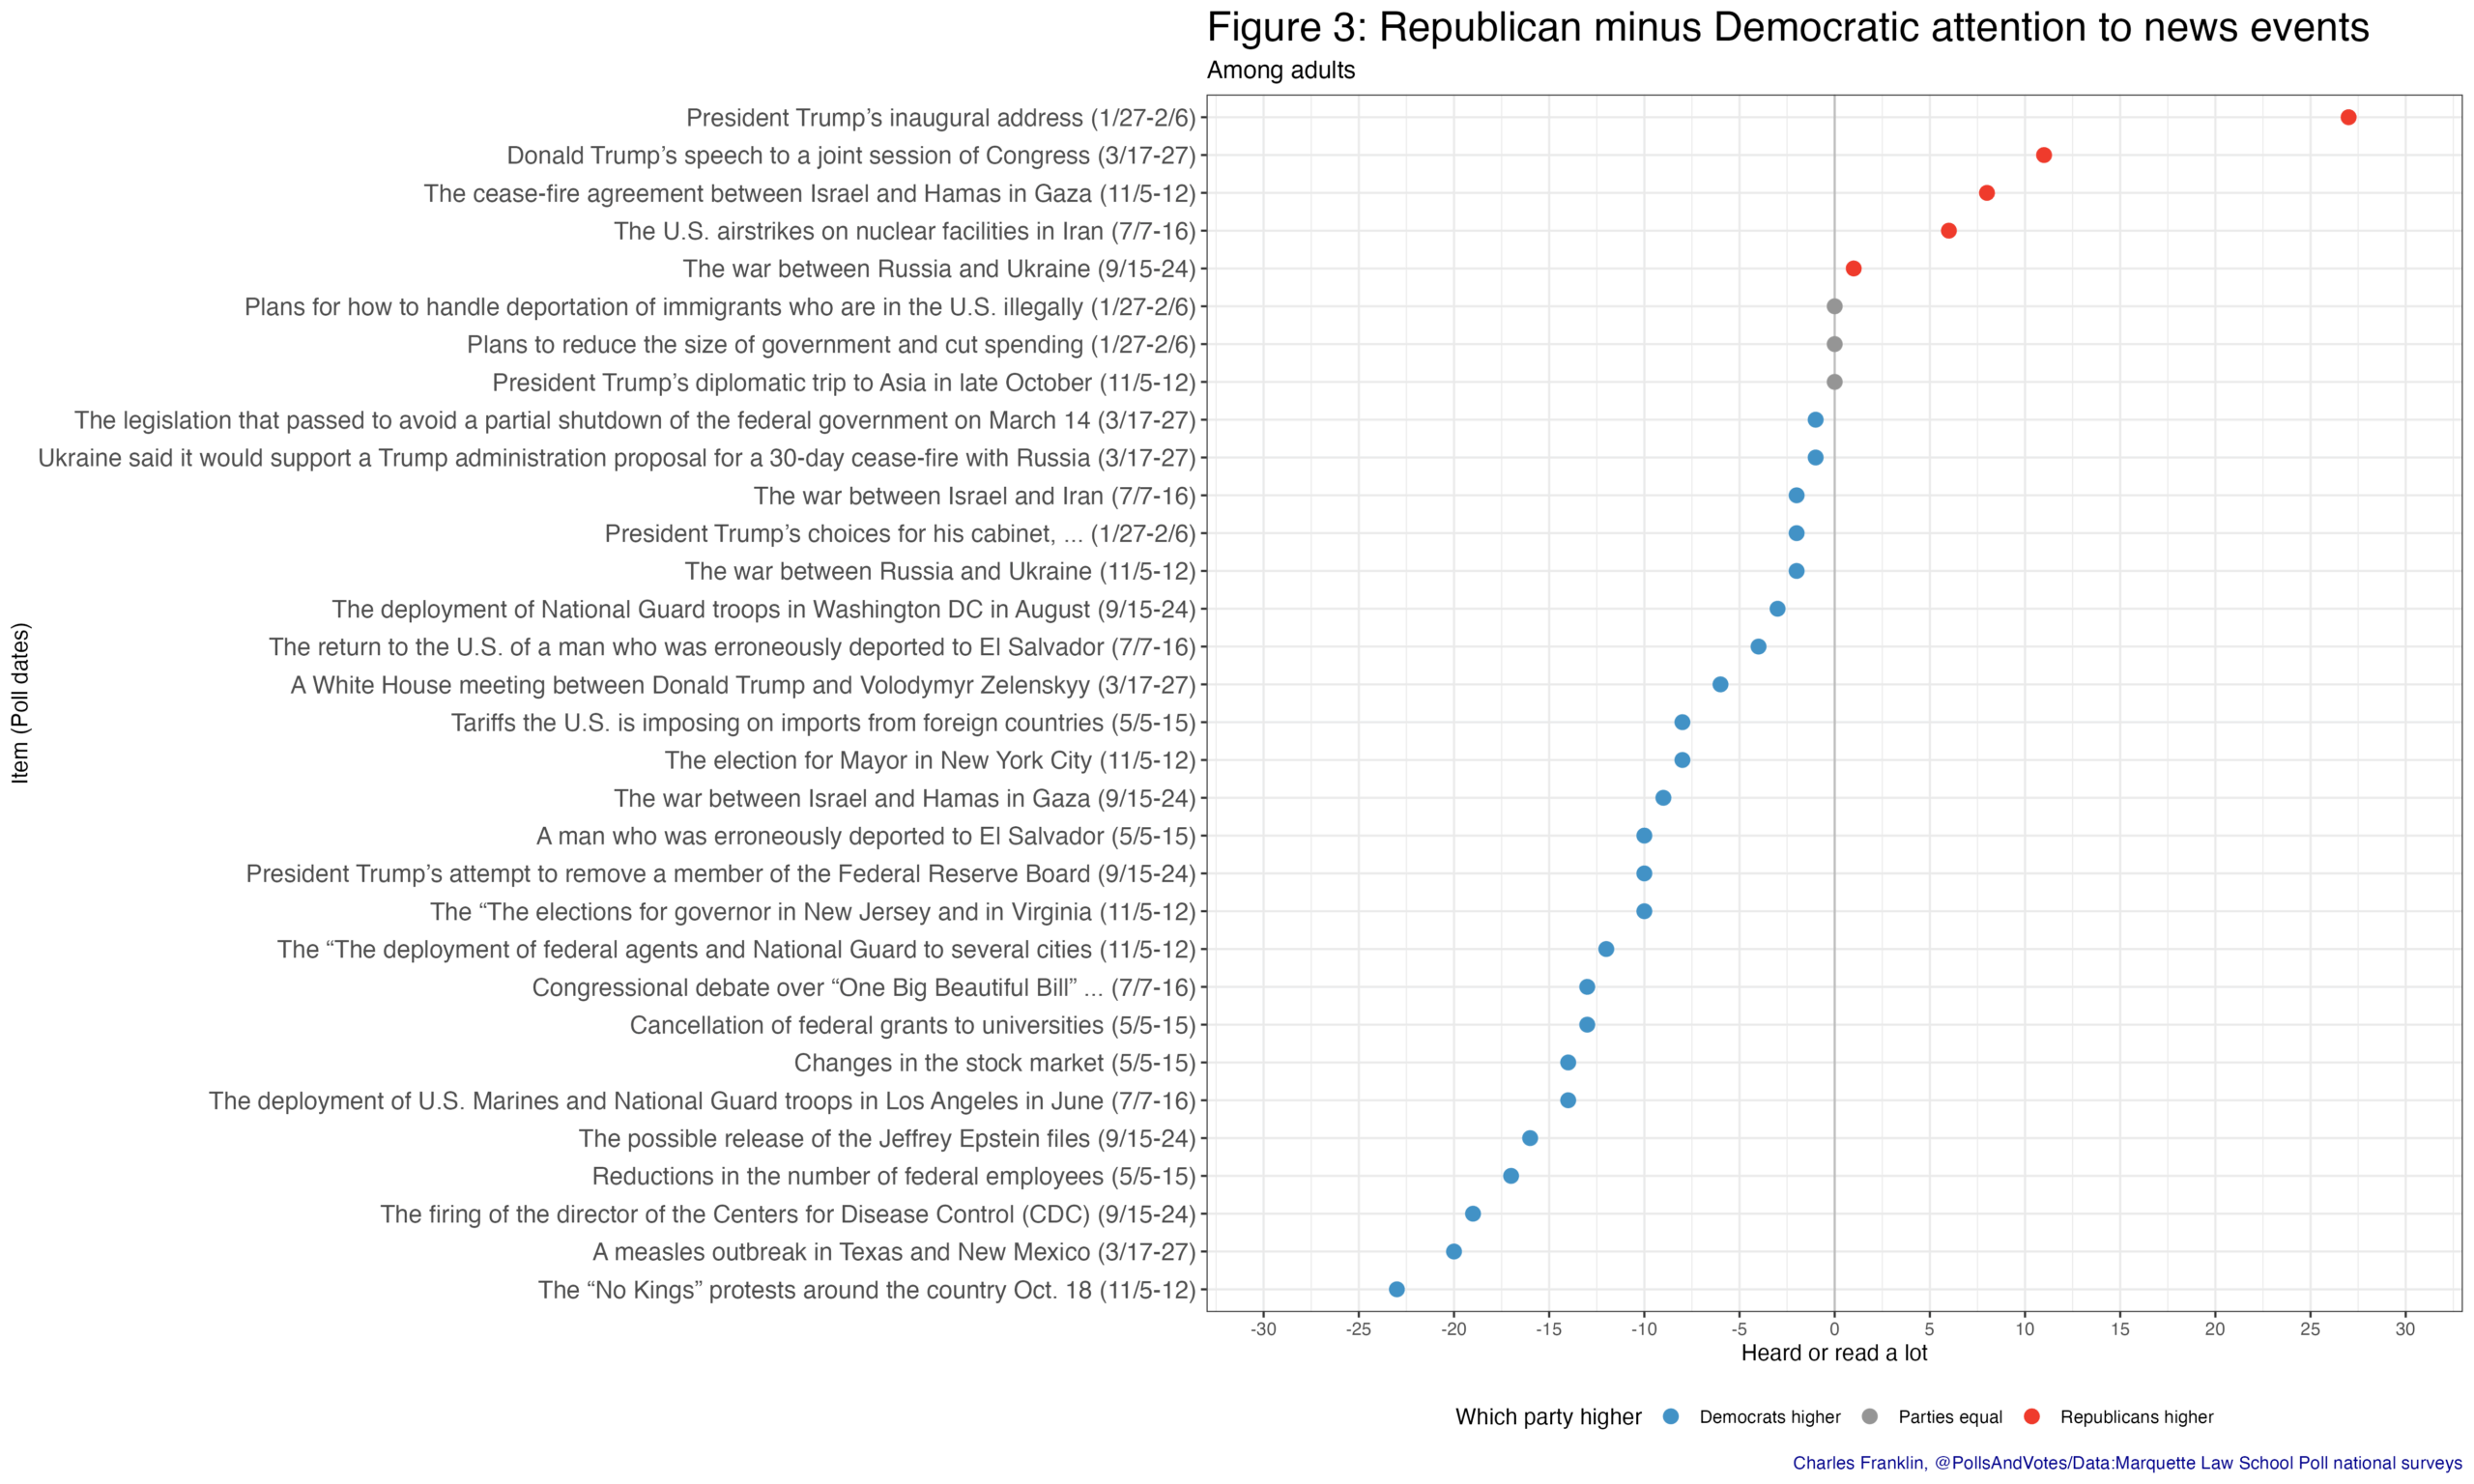
Figure 3 shows the attention gap between Republicans and Democrats across the 32 topics, arranged by size of the difference between Republican and Democratic attention. For the news items we asked about, Democrats say they have heard or read more than do Republicans for 24 items, Republicans more for 5 items and the parties are tied for 3 items.
It is notable that the items with greater attention from Republicans are closely tied to Trump. Attention to his inaugural address shows the largest Republican advantage over Democrats in attention, 27-percentage points, followed by Trump’s speech to a joint session of Congress (don’t call it a State of the Union address) with an 11-point GOP lead in attention. Other topics with a Republican advantage closely concern Trump–the cease-fire agreement between Israel and Hamas and the U.S. airstrikes on Iranian nuclear facilities.
At the opposite end of the partisan attention gap, Democrats paid much more attention to the “No Kings” protests in October, by 23-points, and to a measles outbreak in Texas and New Mexico in the winter by 20-points. Democrats also paid substantially more attention than Republicans to the firing of the CDC director and reductions in the federal workforce.
Perhaps surprisingly, Democrats paid considerably more attention in September to the potential release of the Jeffrey Epstein files than did Republicans, by 16-points. (This does not cover the actual release of the files in December, after our final poll of 2025 in November.) Coverage of this issue has emphasized pressure from Republicans and MAGA activists for the release, though Democrats also supported the law to require the files to be made public.
This invites the question of whether Democrats simply pay more attention to politics than do Republicans.
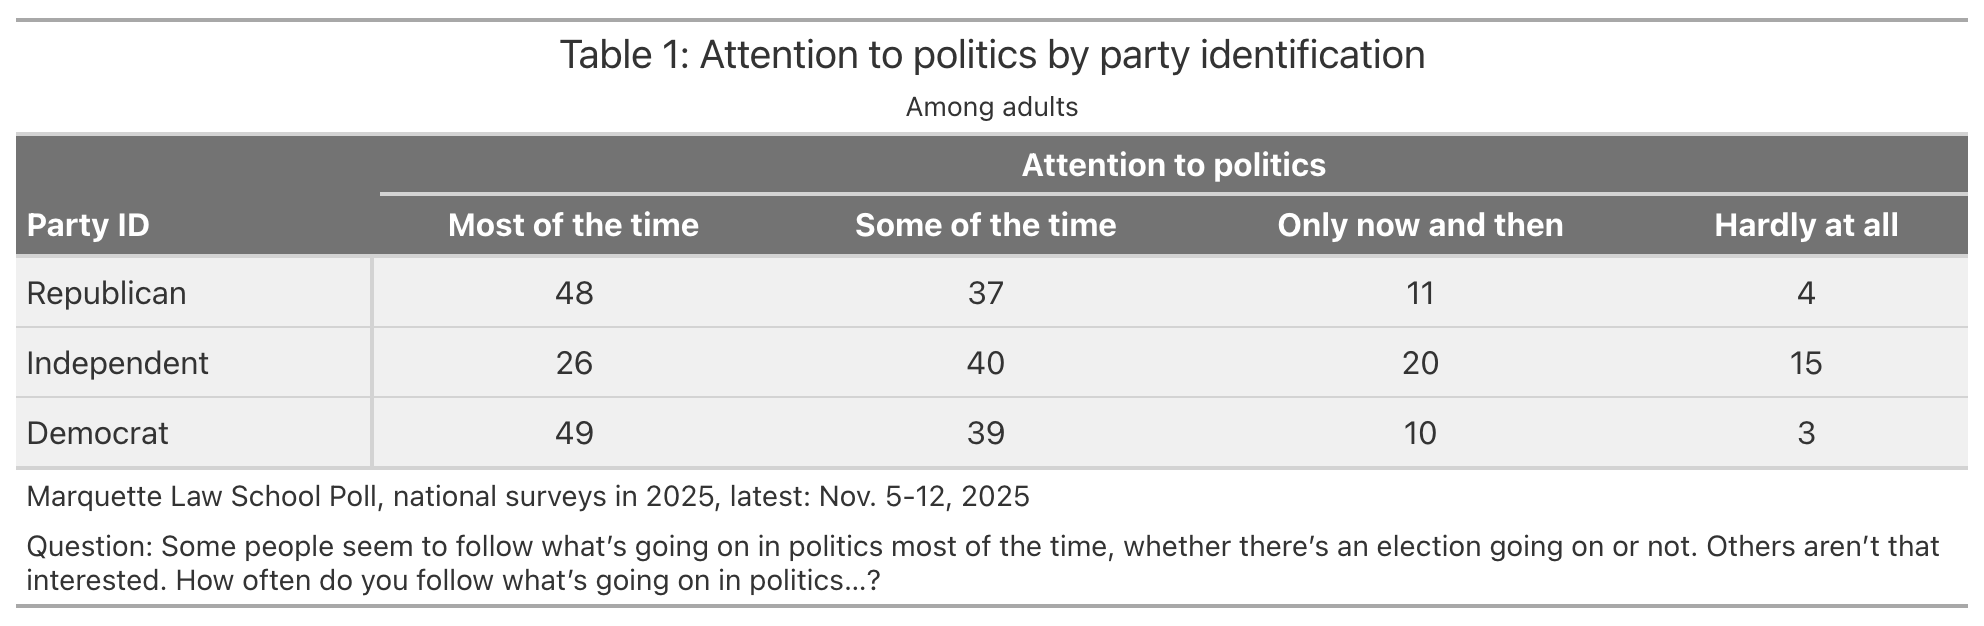
In fact, attention to politics is virtually identical for Republicans and Democrats, while independents are much less attentive in general. We ask
Some people seem to follow what’s going on in politics most of the time, whether there’s an election going on or not. Others aren’t that interested. How often do you follow what’s going on in politics…?
Forty-nine percent of Democrats say they follow politics most of the time, as do 48% of Republicans, a trivial difference. In contrast, only 26% of independents say they follow politics most of the time. The lower attention from independents is reflected in their notably lower levels of attention to news events, but this can’t account for Republican and Democratic differences across news items. Table 1 shows attention to politics by partisanship in 2025 surveys.
One plausible explanation is that partisans follow different news sources, and those sources give different emphasis to specific news events. I don’t have data on the actual content of various news sources, but in my data there are only small (typically 3-4 point differences) in awareness of news events between Republicans who follow only conservative news sources and those who follow a mix of conservative and liberal sources, and a similarly small difference for Democrats who follow only liberal sources versus a mix of liberal and conservative sources. This casts some doubt on the idea that it is differences in content that drives differential awareness, and suggests that partisanship has more to do with what news people pay attention to, and remember. More on this in a future post.
The data tables
For those who want to see the numbers in detail here you go. Table 2 shows those who heard or read a lot, a little and nothing at all for each news event. While there is some variation, the most prominent news items have high “heard a lot” and low “nothing at all”, and the less prominent items reverse this.
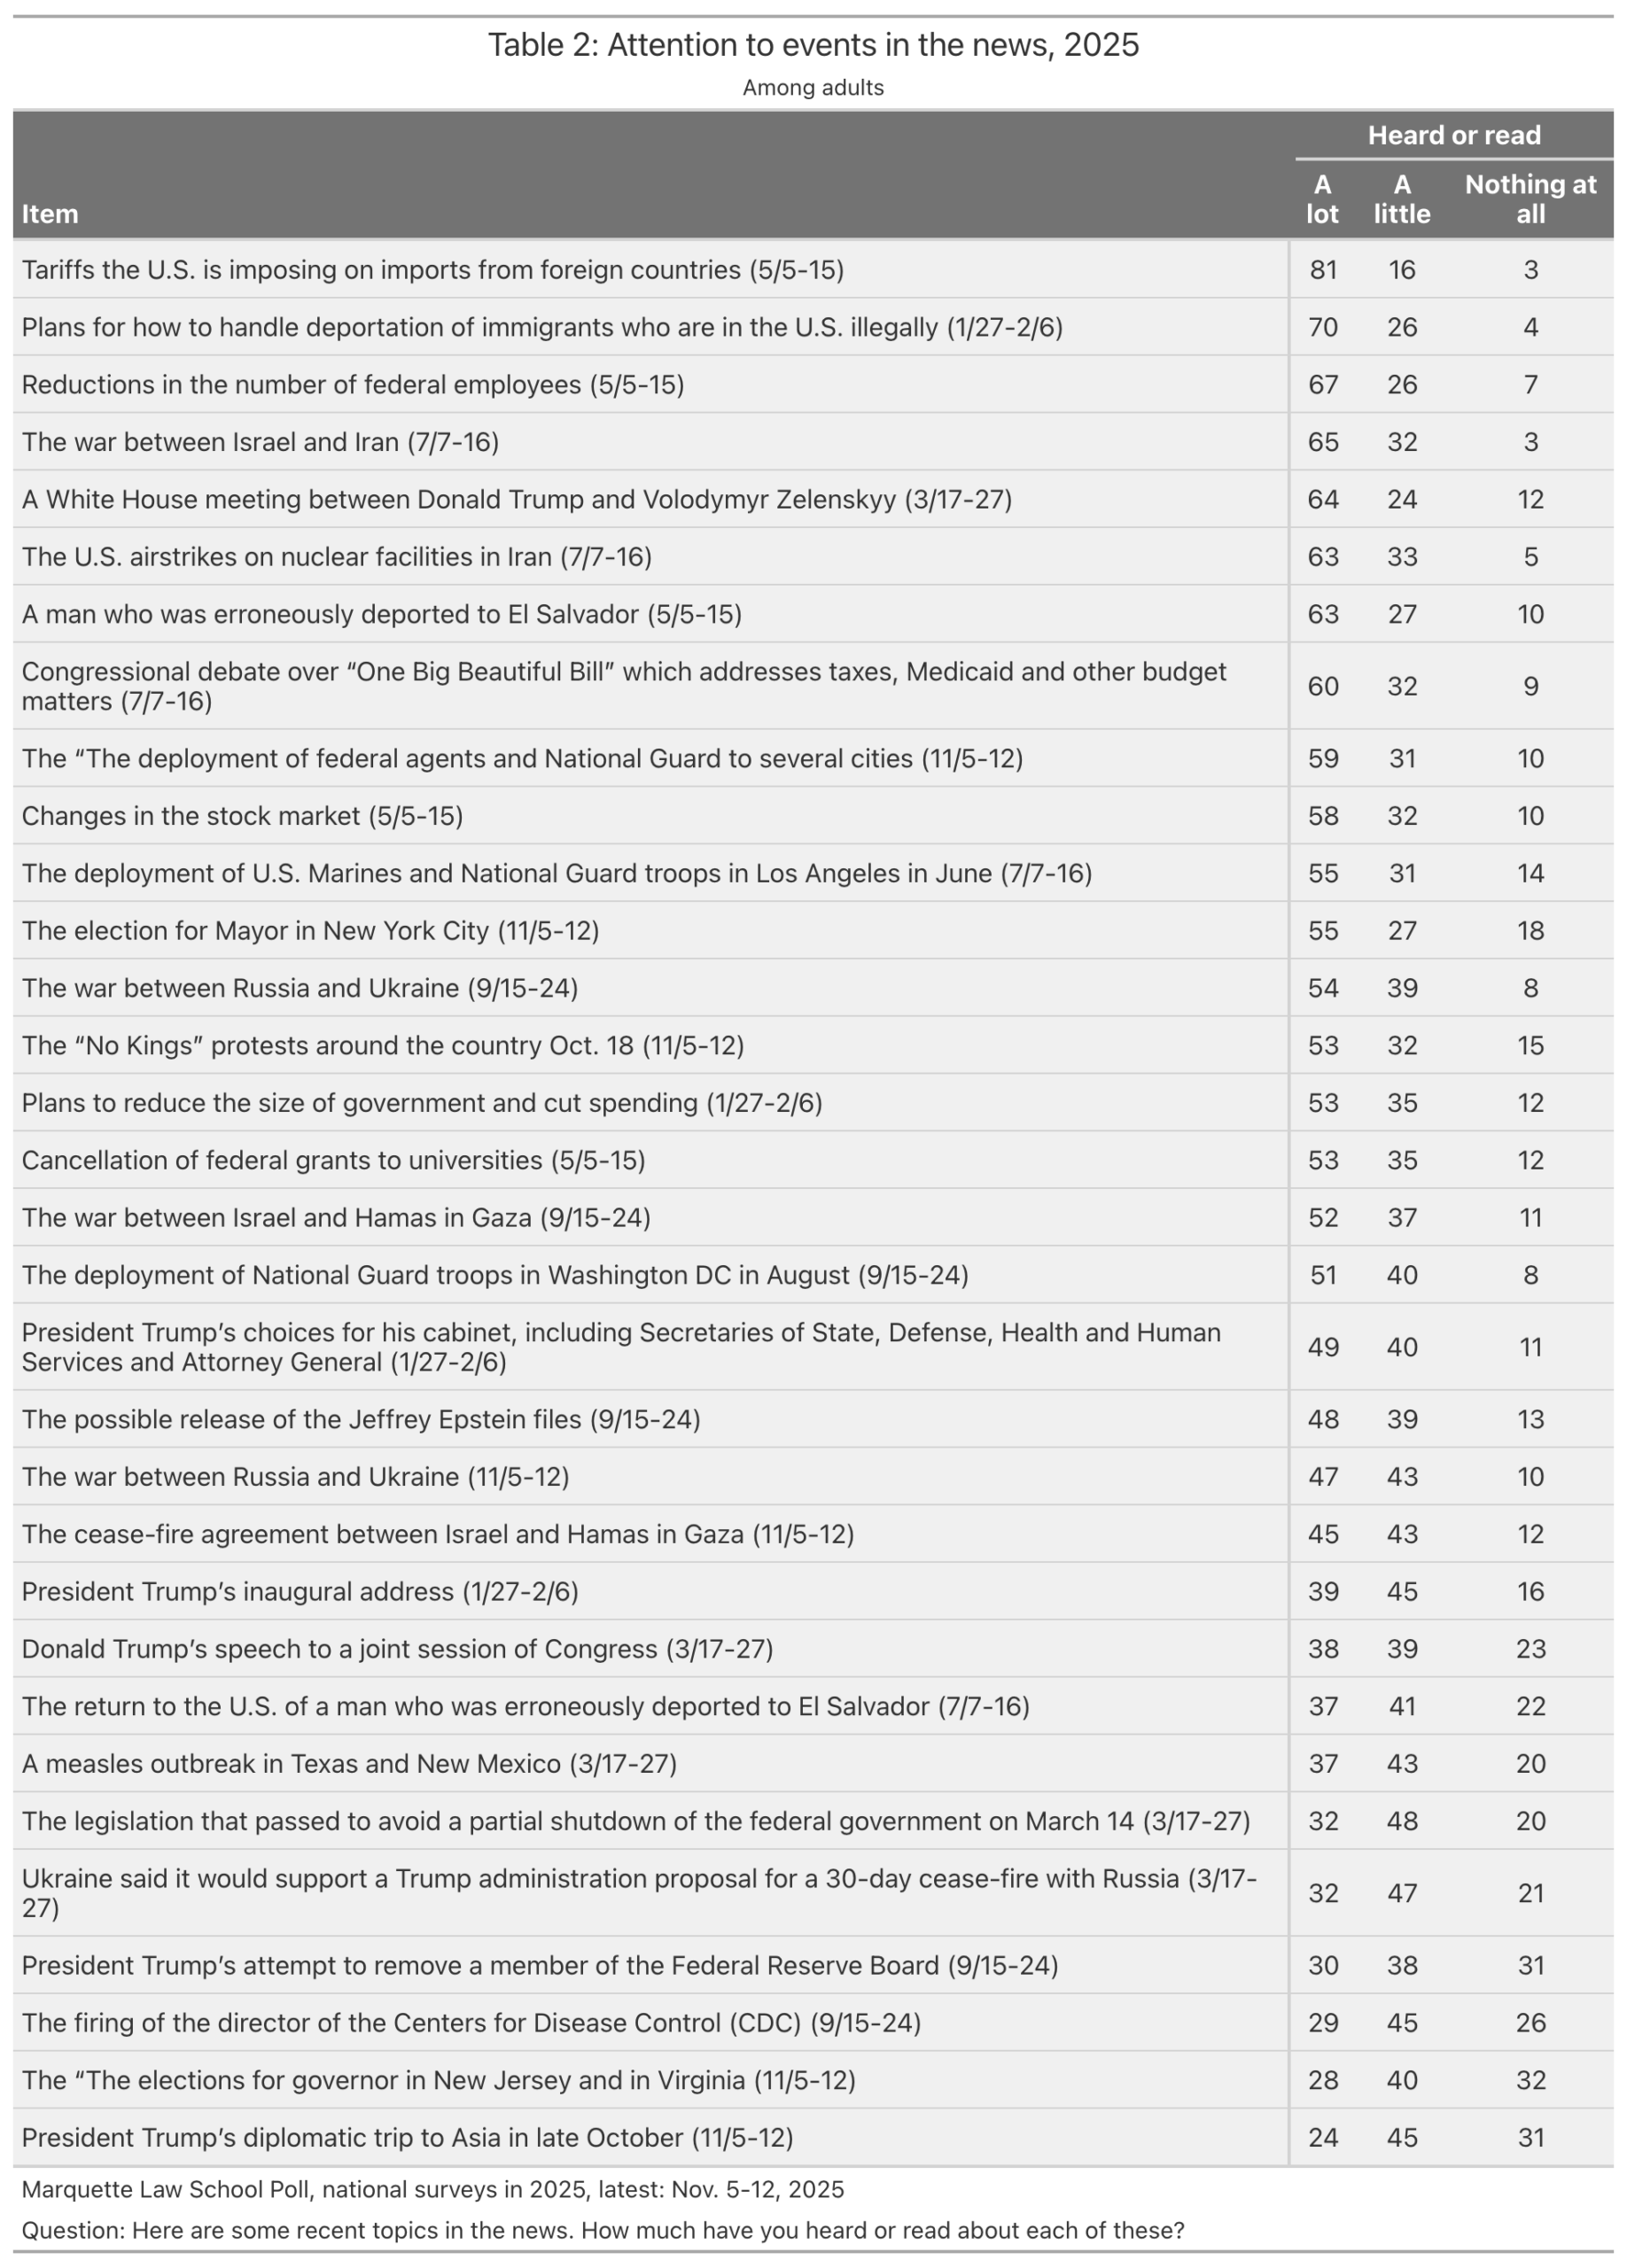
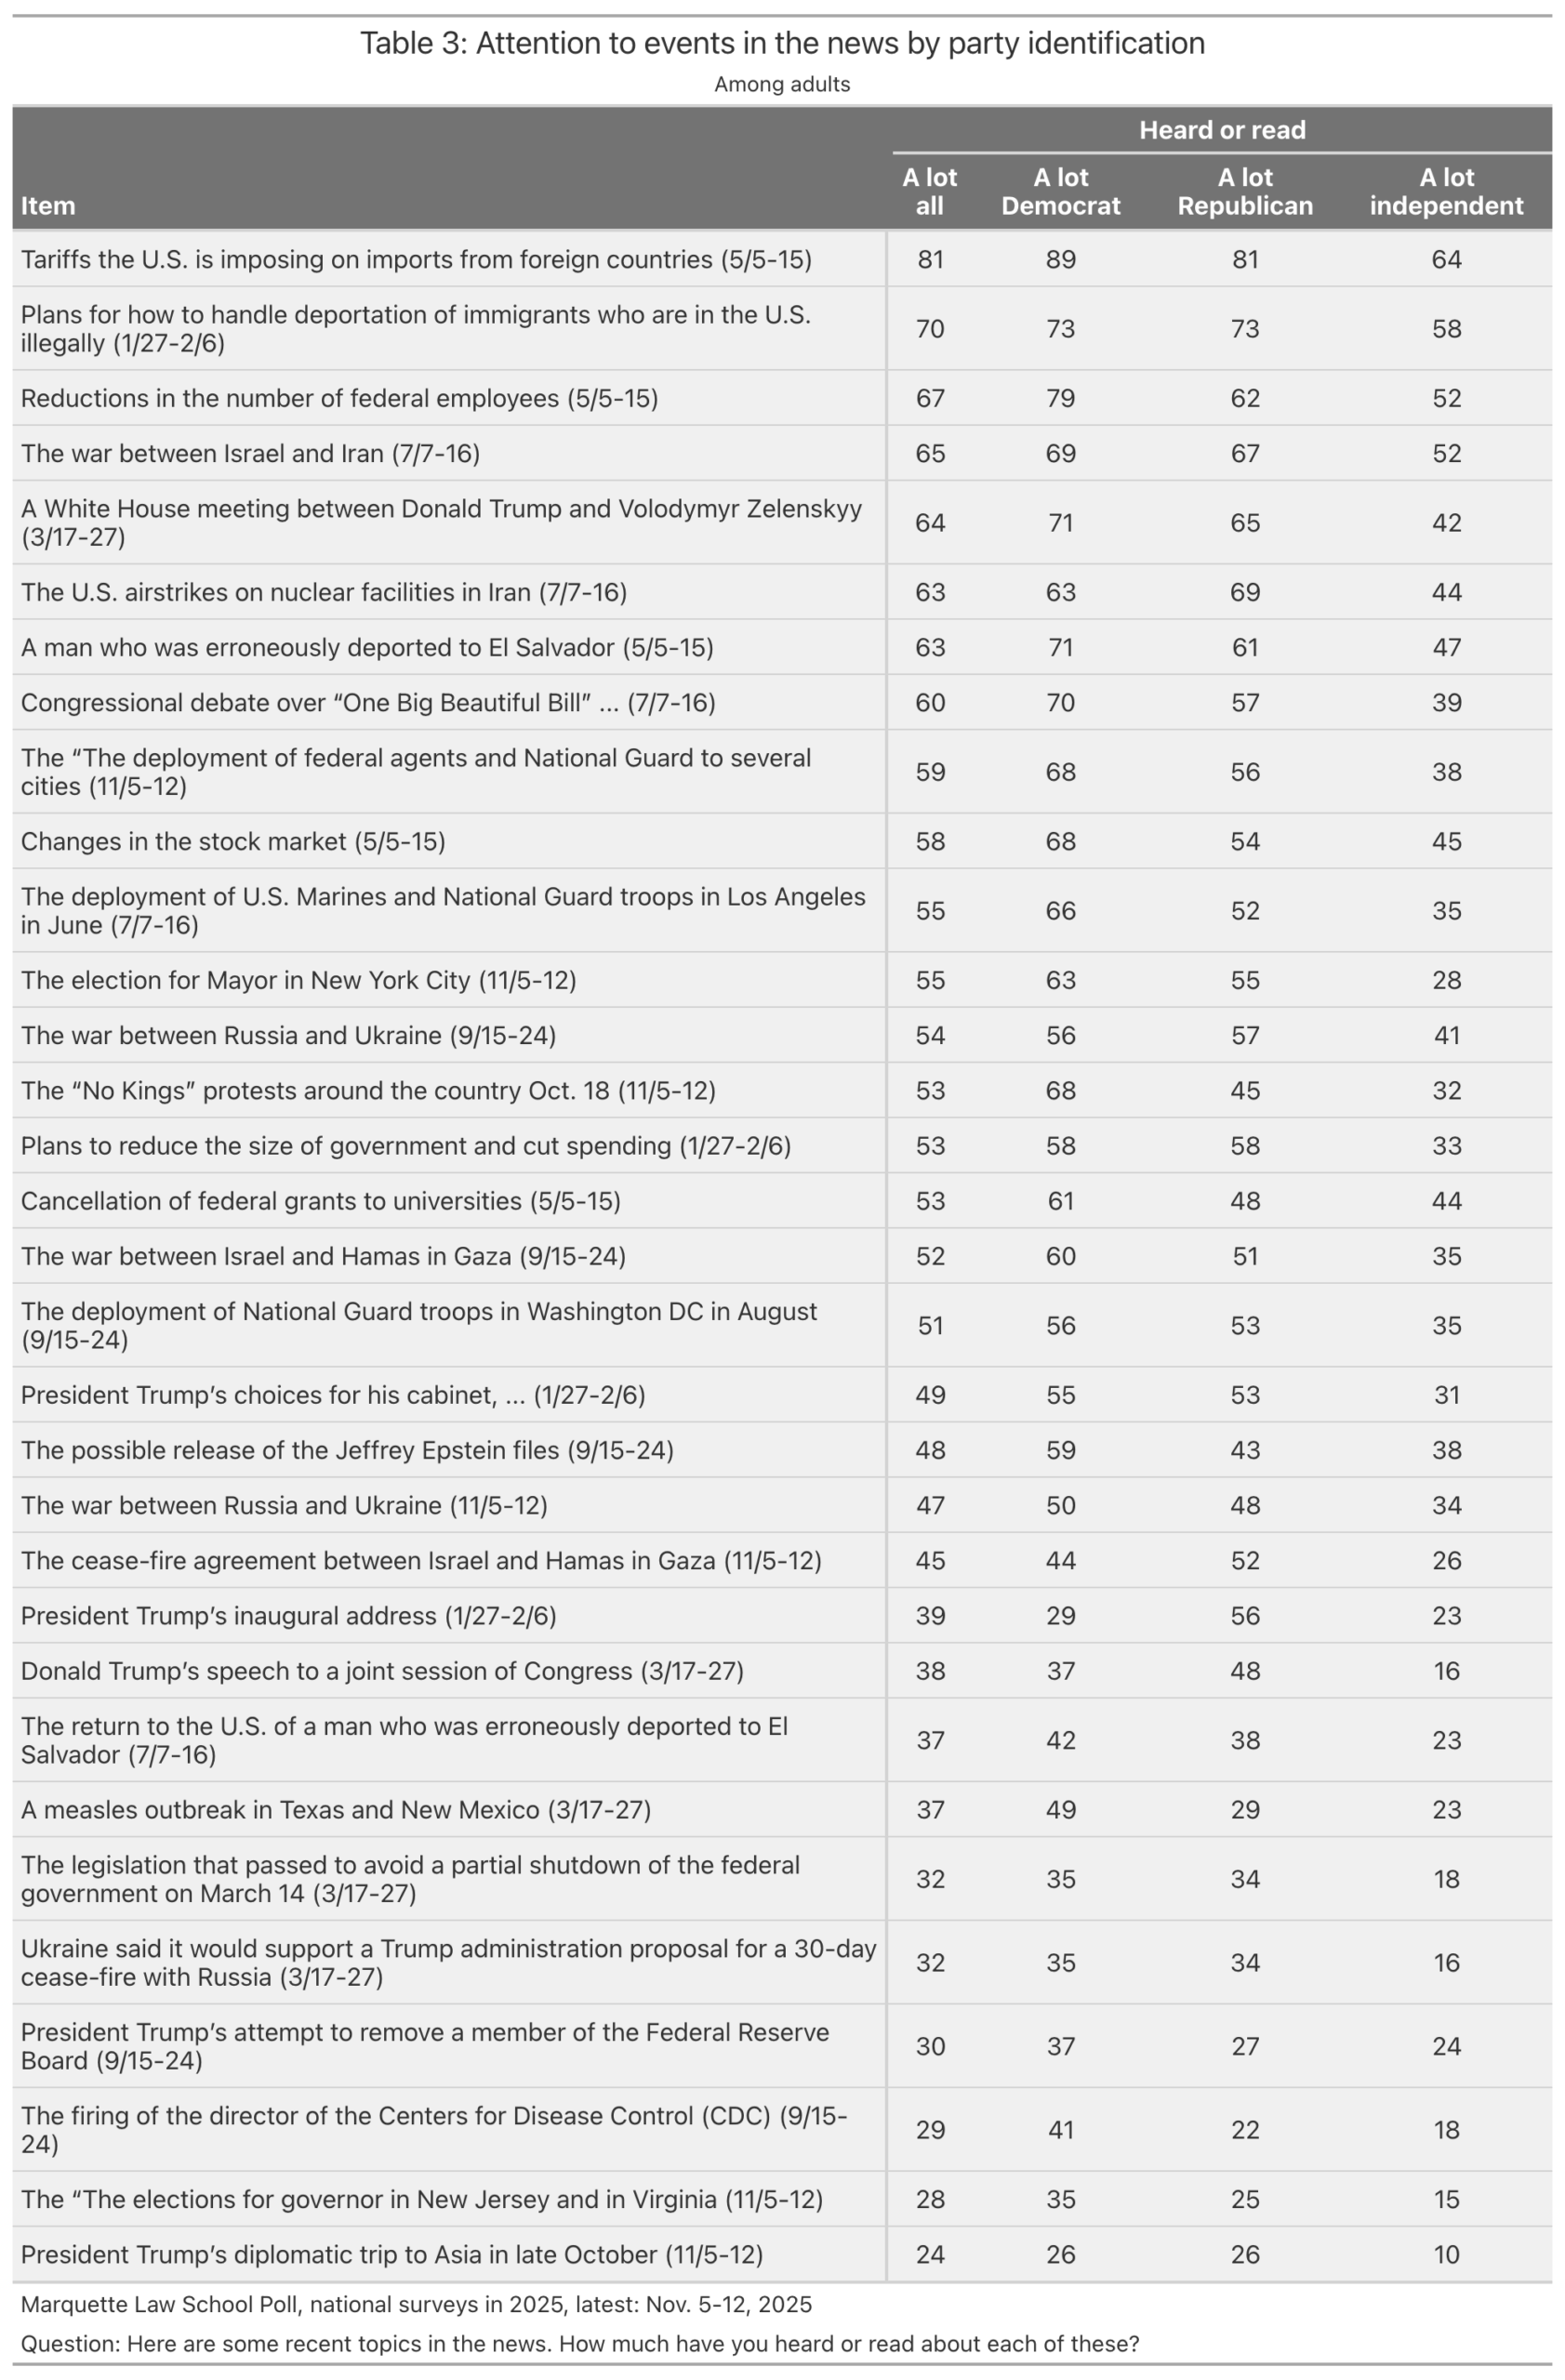
Table 3 shows high attention to news by party identification.