Trump is more popular than many of his policies
Many Americans love Donald Trump and even more hate him, but neither of these groups is large enough to win an election by themselves. Except when turnout is low, American elections for the past 9 years have turned with the preferences of those voters whose views of Trump are mixed.
In order to better understand these voters, the Marquette Law School Poll regularly invites a representative sample of American adults to answer the following two simple questions. What do you like about Donald Trump? What do you dislike about him? Respondents can write as much or as little as they want.
The answers to these questions, when paired with traditional multiple-choice items, show a large chunk of the electorate whose attitudes toward the president and broad policy issues, like immigration or trans rights, are malleable. These (potential) voters often hold combinations of views that are rarely found among politicians, making their support for any candidate contingent on issue salience, framing, and whatever ineffable quality makes some candidates seem more trustworthy than the rest.
Our latest poll was in the field in late March, preceding Trump’s “Liberation Day” tariff announcement. Previous installments were fielded a few weeks before and about a month after the inauguration.
At a high level, views of Trump changed little throughout the first three months of his presidency. Shortly before his inauguration, 49% of adults in our polling had a favorable opinion of him. That stood at 44% at the beginning of February and 46% in late March–all changes within the margin of error.
The overall patterns in the open-ended answers haven’t changed much either. In the latest poll, 50% of adults listed something they both like and disliked about Trump. 11% couldn’t name anything they disliked, and 36% couldn’t name anything they liked.
| Summary of open-ended survey responses | |||
|---|---|---|---|
| in the Marquette Law School Poll, national adult sample | |||
| Attitude toward Donald Trump | survey dates | ||
| 12/2-11/24 | 1/27-2/6/25 | 3/17-27/25 | |
| Can name likes and dislikes | 51% | 47% | 50% |
| Doesn’t dislike anything | 12% | 14% | 11% |
| Doesn’t like anything | 35% | 36% | 36% |
| no answer | 2% | 3% | 2% |
This stability in overall attitude toward Trump doesn’t surprise me. After all, he has been at the center of American politics since his first primary campaign began a decade ago. Few voters lack an opinion of him and much of his behavior is already “priced in.”
But even though attitudes toward Trump himself are fairly stable, if trending a bit downward, opinions toward Trump’s favored policies are all over the place.
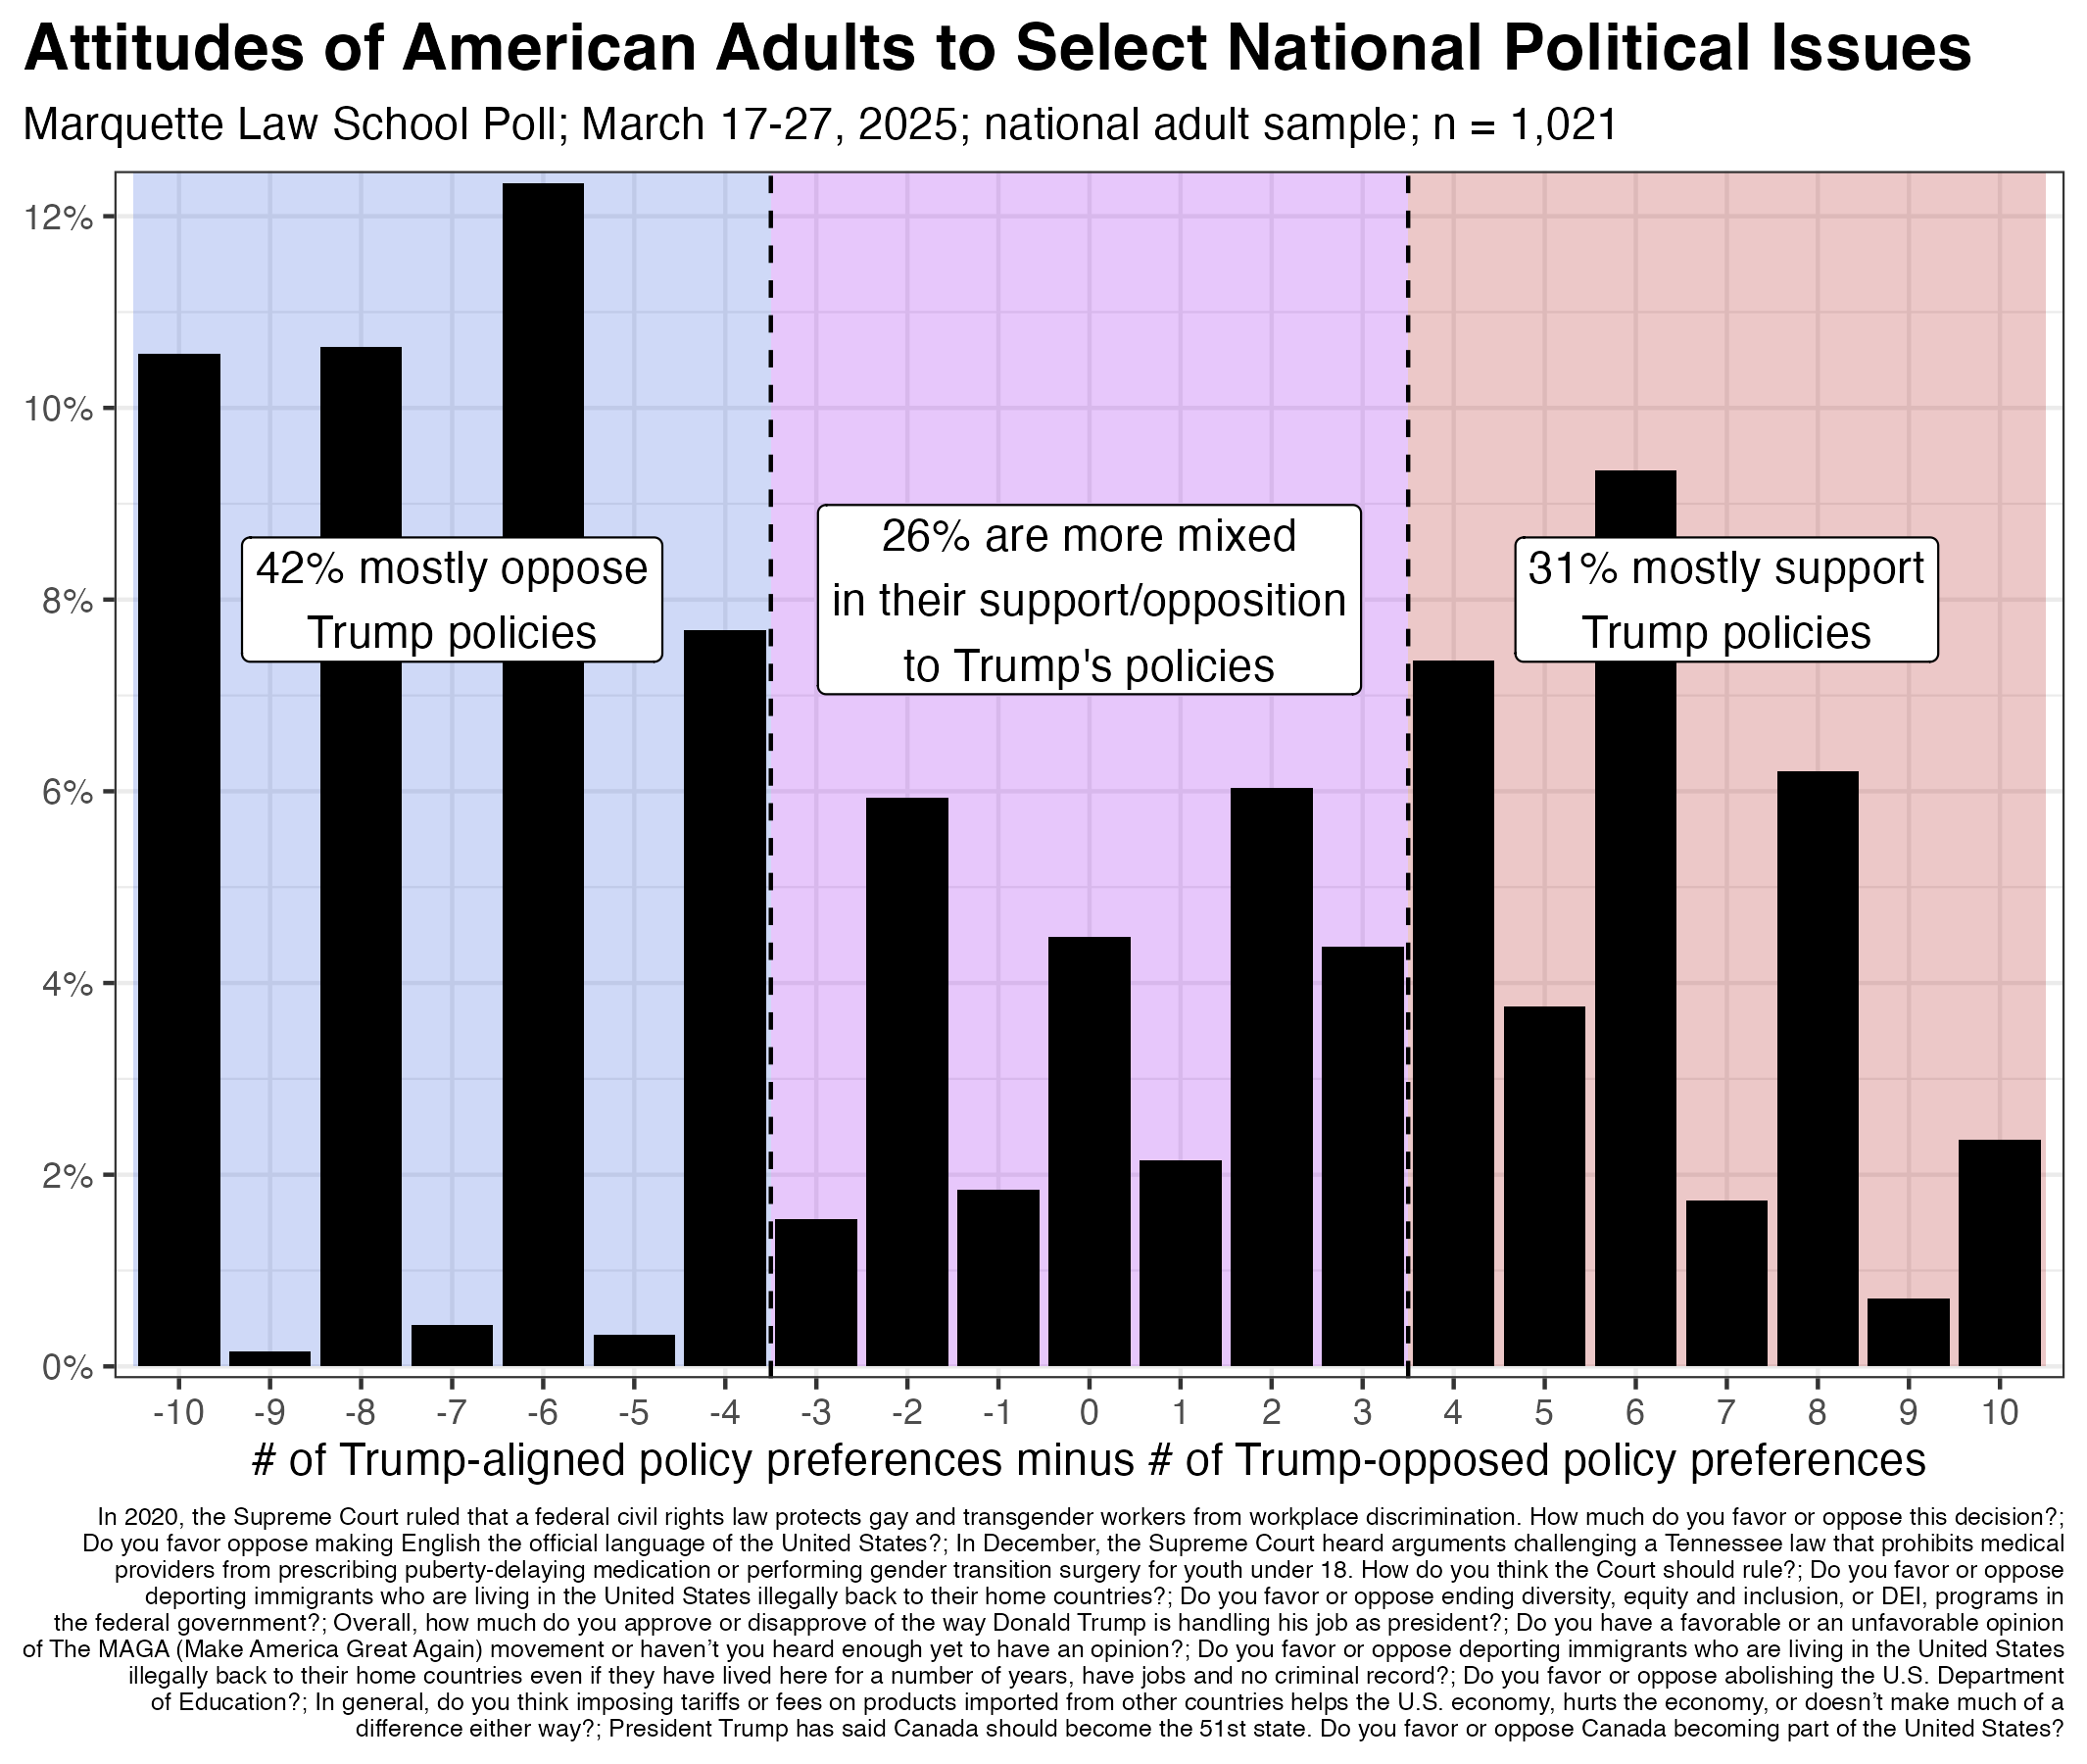
In our latest poll, we asked about 10 topics related to Trump’s agenda or recent Supreme Court decisions. The graph below shows the responses to each.
The most popular position across all of these questions was support for the 2020 Supreme Court ruling prohibiting workplace discrimination against “gay and transgender workers.” Eight-two percent of adults agreed with extending federal civil rights law to these workers.
At the same time, 72% of adults hope the Supreme Court upholds a Tennessee law prohibiting “medical providers from prescribing puberty-delaying medication or performing gender transition surgery for youth under 18.”
A large majority, 68%, support the deportation of undocumented immigrants when asked “Do you favor or oppose deporting immigrants who are living in the United States illegally back to their home countries?” When the wording is changed to include, “even if they have lived here for a number of years, have jobs and no criminal record?” support falls to 41% and opposition rises to 59%.
A decisive share of voters are not consistently “pro” or “anti” trans rights or deportation. Rather, their answers depend on the specific facts included in each question.

For each of the above questions, I coded a respondent as “1” if they supported the Trump/conservative position, “-1” if they chose the Democratic/liberal position, and “0” if they declined to take a side. A respondent receives a score of -10 if they took every liberal position and +10 if they always took the conservative side. The graph below shows the distribution of scores for all adults.
Few respondents fell into the most liberal or conservative categories. Forty-two percent are in the most liberal third and 31% are in the most conservative third of possible scores. Twenty-six percent of adults fell in the middle, with scores reflecting a mixture of support for conservative or liberal policies.
It is the open-ended answers from this last group that give insight into the views and beliefs of the most persuadable section of the electorate.
Click here to access our tool for viewing randomized responses to our open-ended questions. The tool allows you to filter responses by the respondent’s degree of support or opposition to Trump’s policies.