Highest highs and lowest lows: Gallup 1937-2025
Closing the books on Gallup presidential approval
When I refreshed my presidential approval database in January, I wondered when Gallup would update their measure from December. They usually release approval in mid-month, but there wasn’t an update as of Jan. 20. I assumed it would come soon.
Now we learn that there won’t be any more Gallup presidential approval polls. As reported in the Washington Post and the New York Times on Feb. 11, Gallup has decided to discontinue their approval polling. Gallup made a similar decision in 2015 to discontinue their presidential horse race polls.
This is a loss to the public. The Gallup organization has the longest running, and most voluminous, time series of approval, dating back to 1937. While their methodology has evolved over time, they have always used what was “state of the art” methods for the time, and their question wording has been stable for decades, after evolving a bit in the early years. That means when we want to make the best apples-to-apples comparison across presidents and decades, Gallup is the indispensable source.
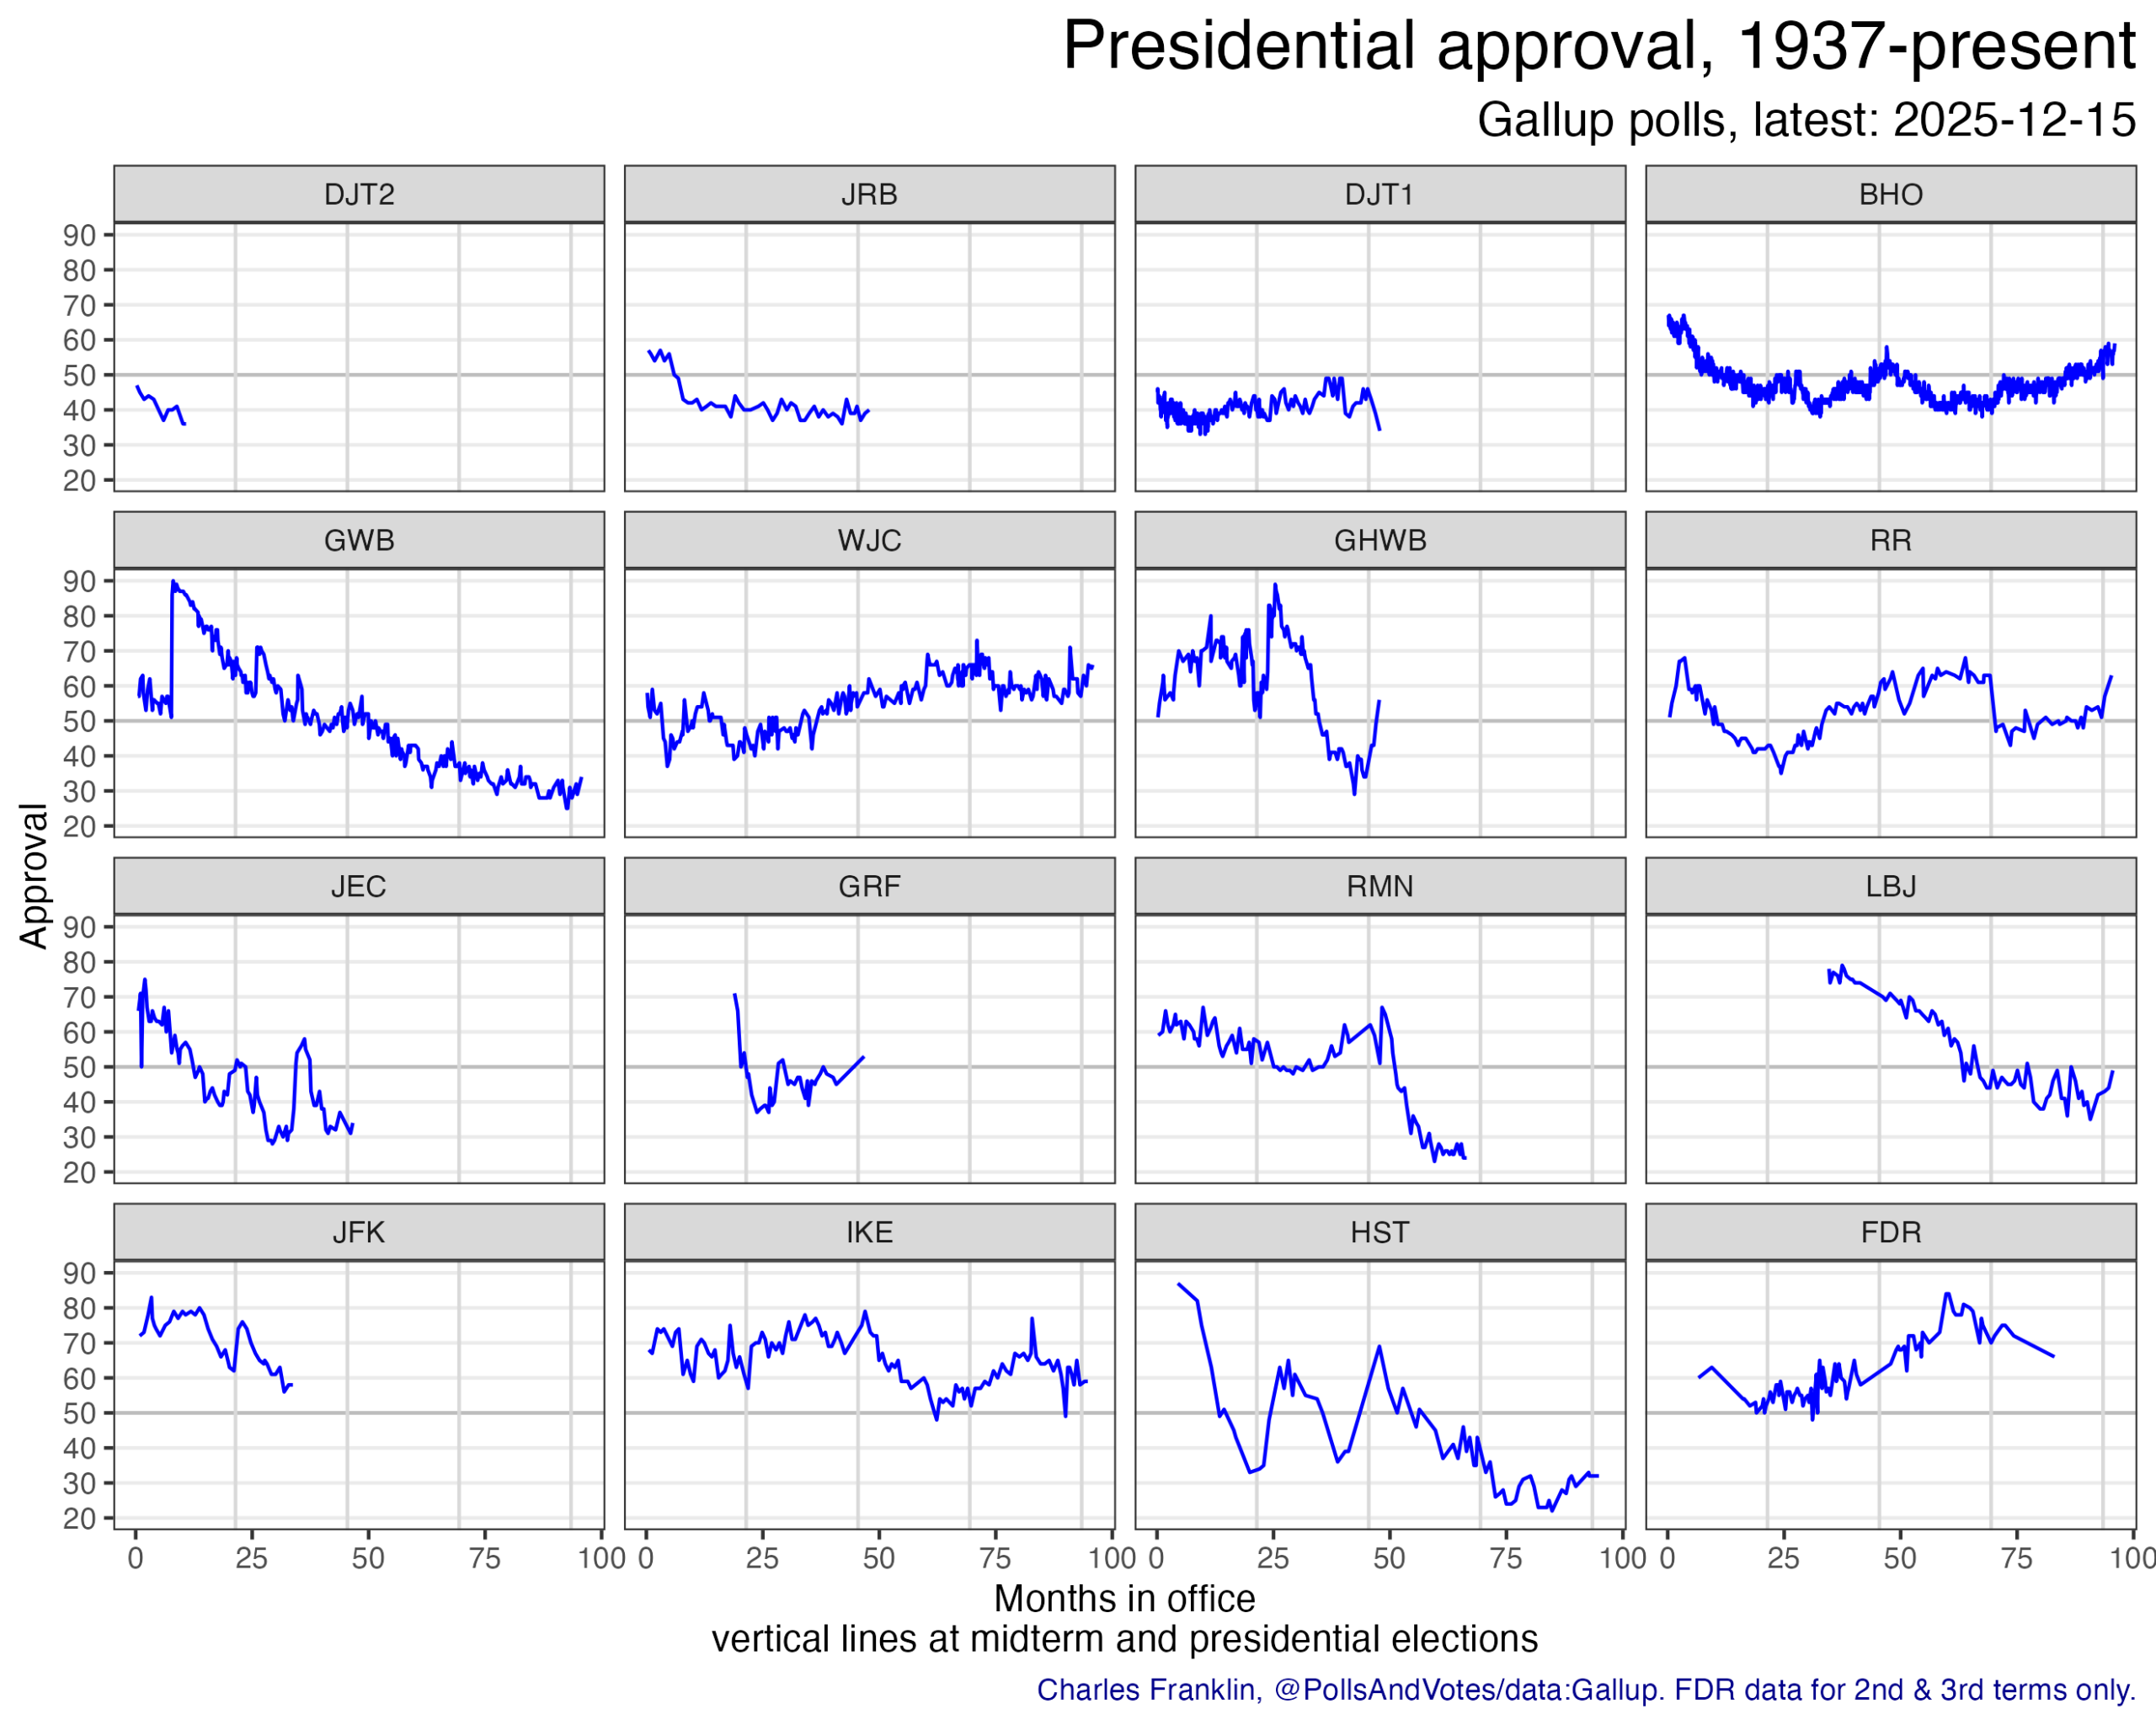
Here is what I now realize to be my final update of all the 2846 Gallup approval polls since Roosevelt in Aug. 1937 to Trump in Dec. 2025.
There are plenty of high quality national polls available now, so Gallup is hardly the only game in town. The polling averages from Silver Bulletin, FiftyPlusOne, New York Times, RealClearPolitics and others are now widely recognized as a better way to track the full measure of approval across dozens of pollsters rather than rely on a single pollster.
When George Gallup started the poll in the 1930s there was money to be made in public opinion polling. Newspapers across the country subscribed to his polls and distributed his results to a national audience. Gallup actually offered newspapers a money back guarantee that his 1936 presidential horse race poll would outperform the Literary Digest poll that year, which it did. The poll also survived embarrassing errors, most notably the 1948 presidential election.
These days, there isn’t such a financial interest in providing opinion data to the public. Private polling for interest groups, parties and candidates remains financially viable, but those polls serve private, not public, interests. News organizations either run their own polls, contracting the work through various pollsters, or report on polls they don’t produce themselves but also don’t pay for. Universities (like my Marquette Law School Poll) produce public polls in the public interest and for the publicity value. Gallup is reported to say they are refocusing their business away from approval polling, which is sad but understandable.
This moment of closure lets us make one final list of the lows and highs of Gallup approval results over the decades.
The all time lowest low goes to Harry Truman, at 22%. John F. Kennedy has the highest low, never falling below 56%. And as for highs, George W. Bush owns that record at 90%, eclipsing his father, George H.W. Bush by one point. As for the lowest high, that belongs to the current president, at 47% in his second term, two points lower than his high in the first term. No other president has failed to reach 50% on their best days.
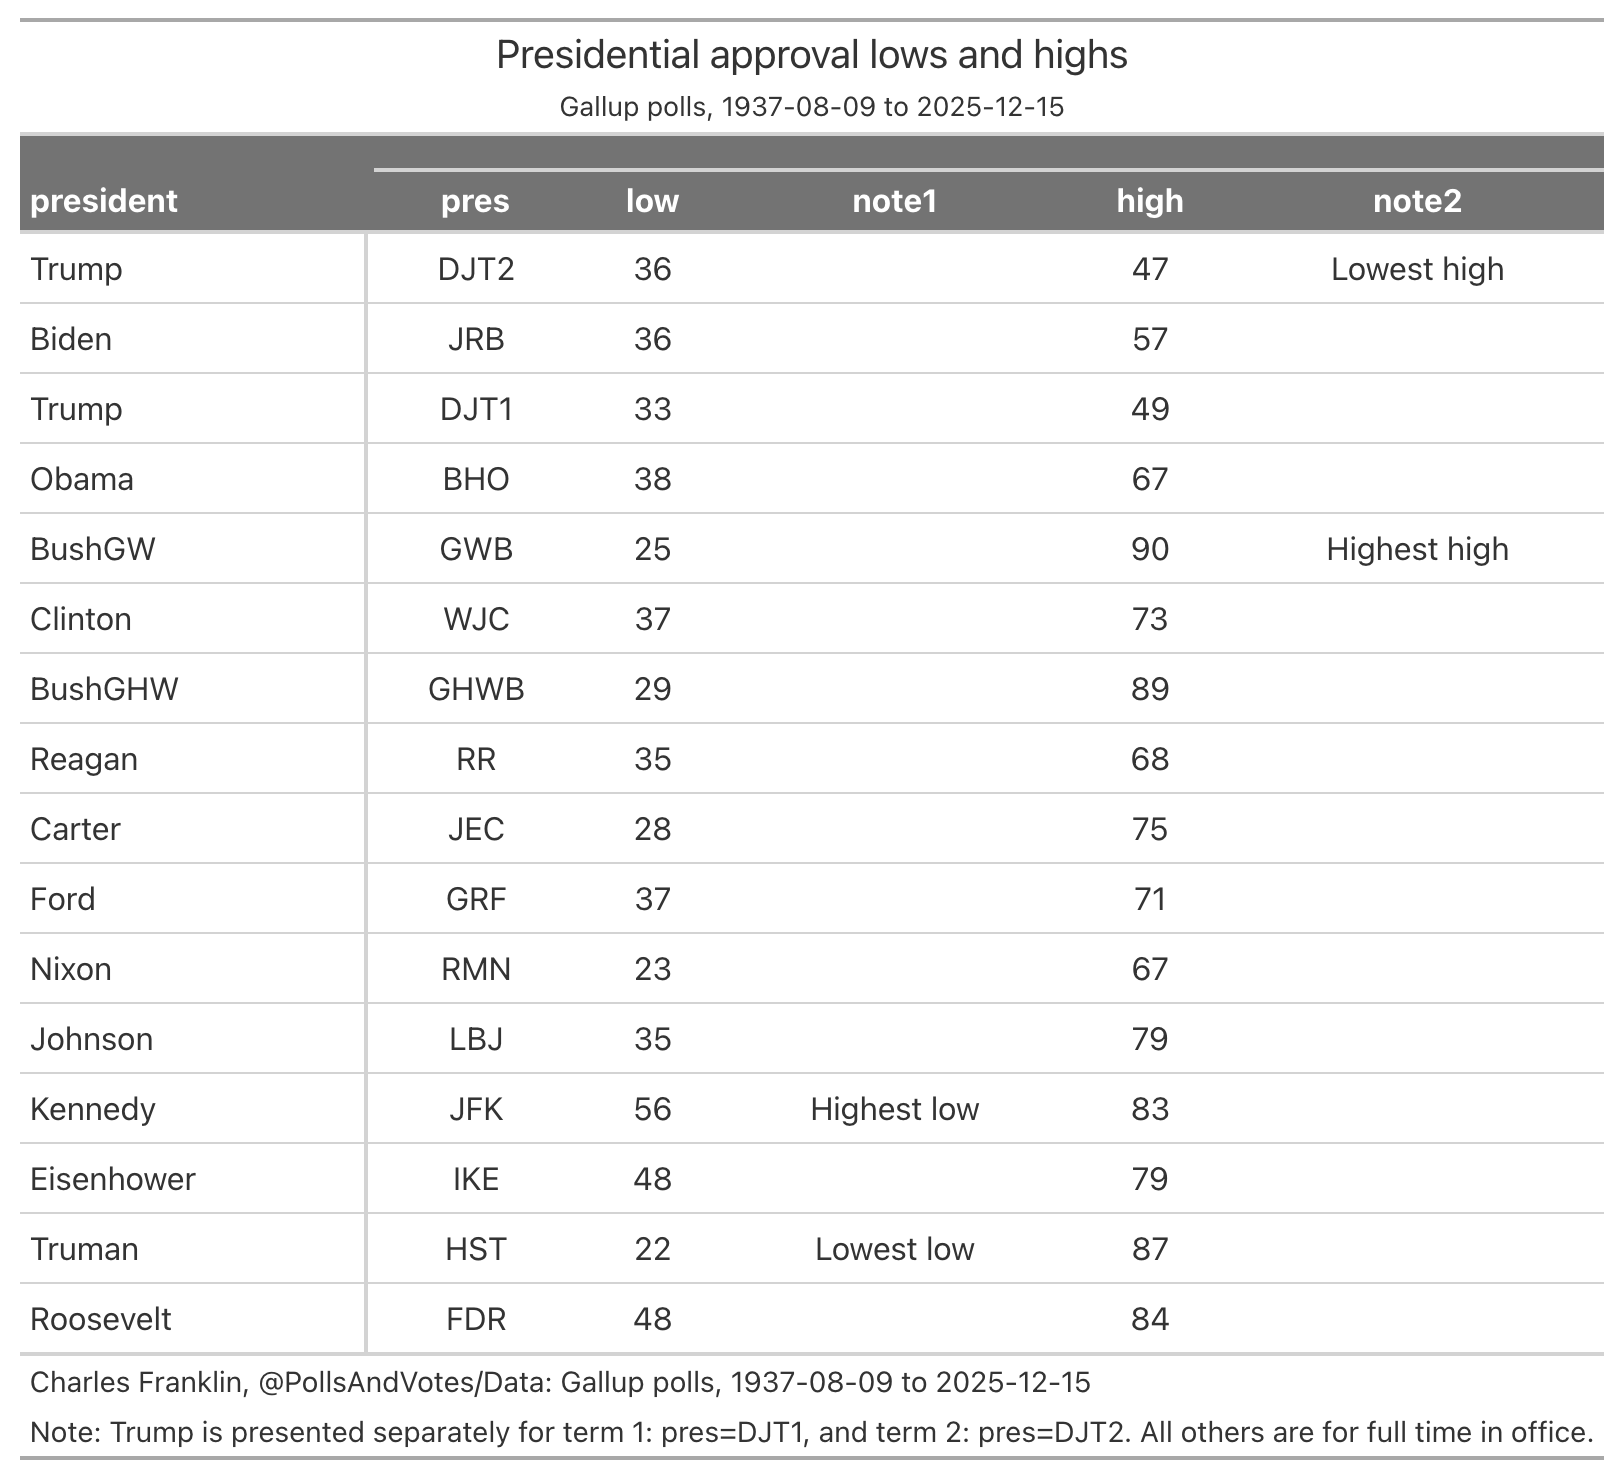
That all time low for Truman was misreported for some decades as a point higher, 23%. I found the discrepancy in 2006, tracked down the evidence, and presented it to Gallup’s then Editor in Chief, Frank Newport, who was gracious enough to review my results and confirm the new low of 22%. I told that story in a post in July 2006. To my surprise, the post still lives at my first website, Political Arithmetik
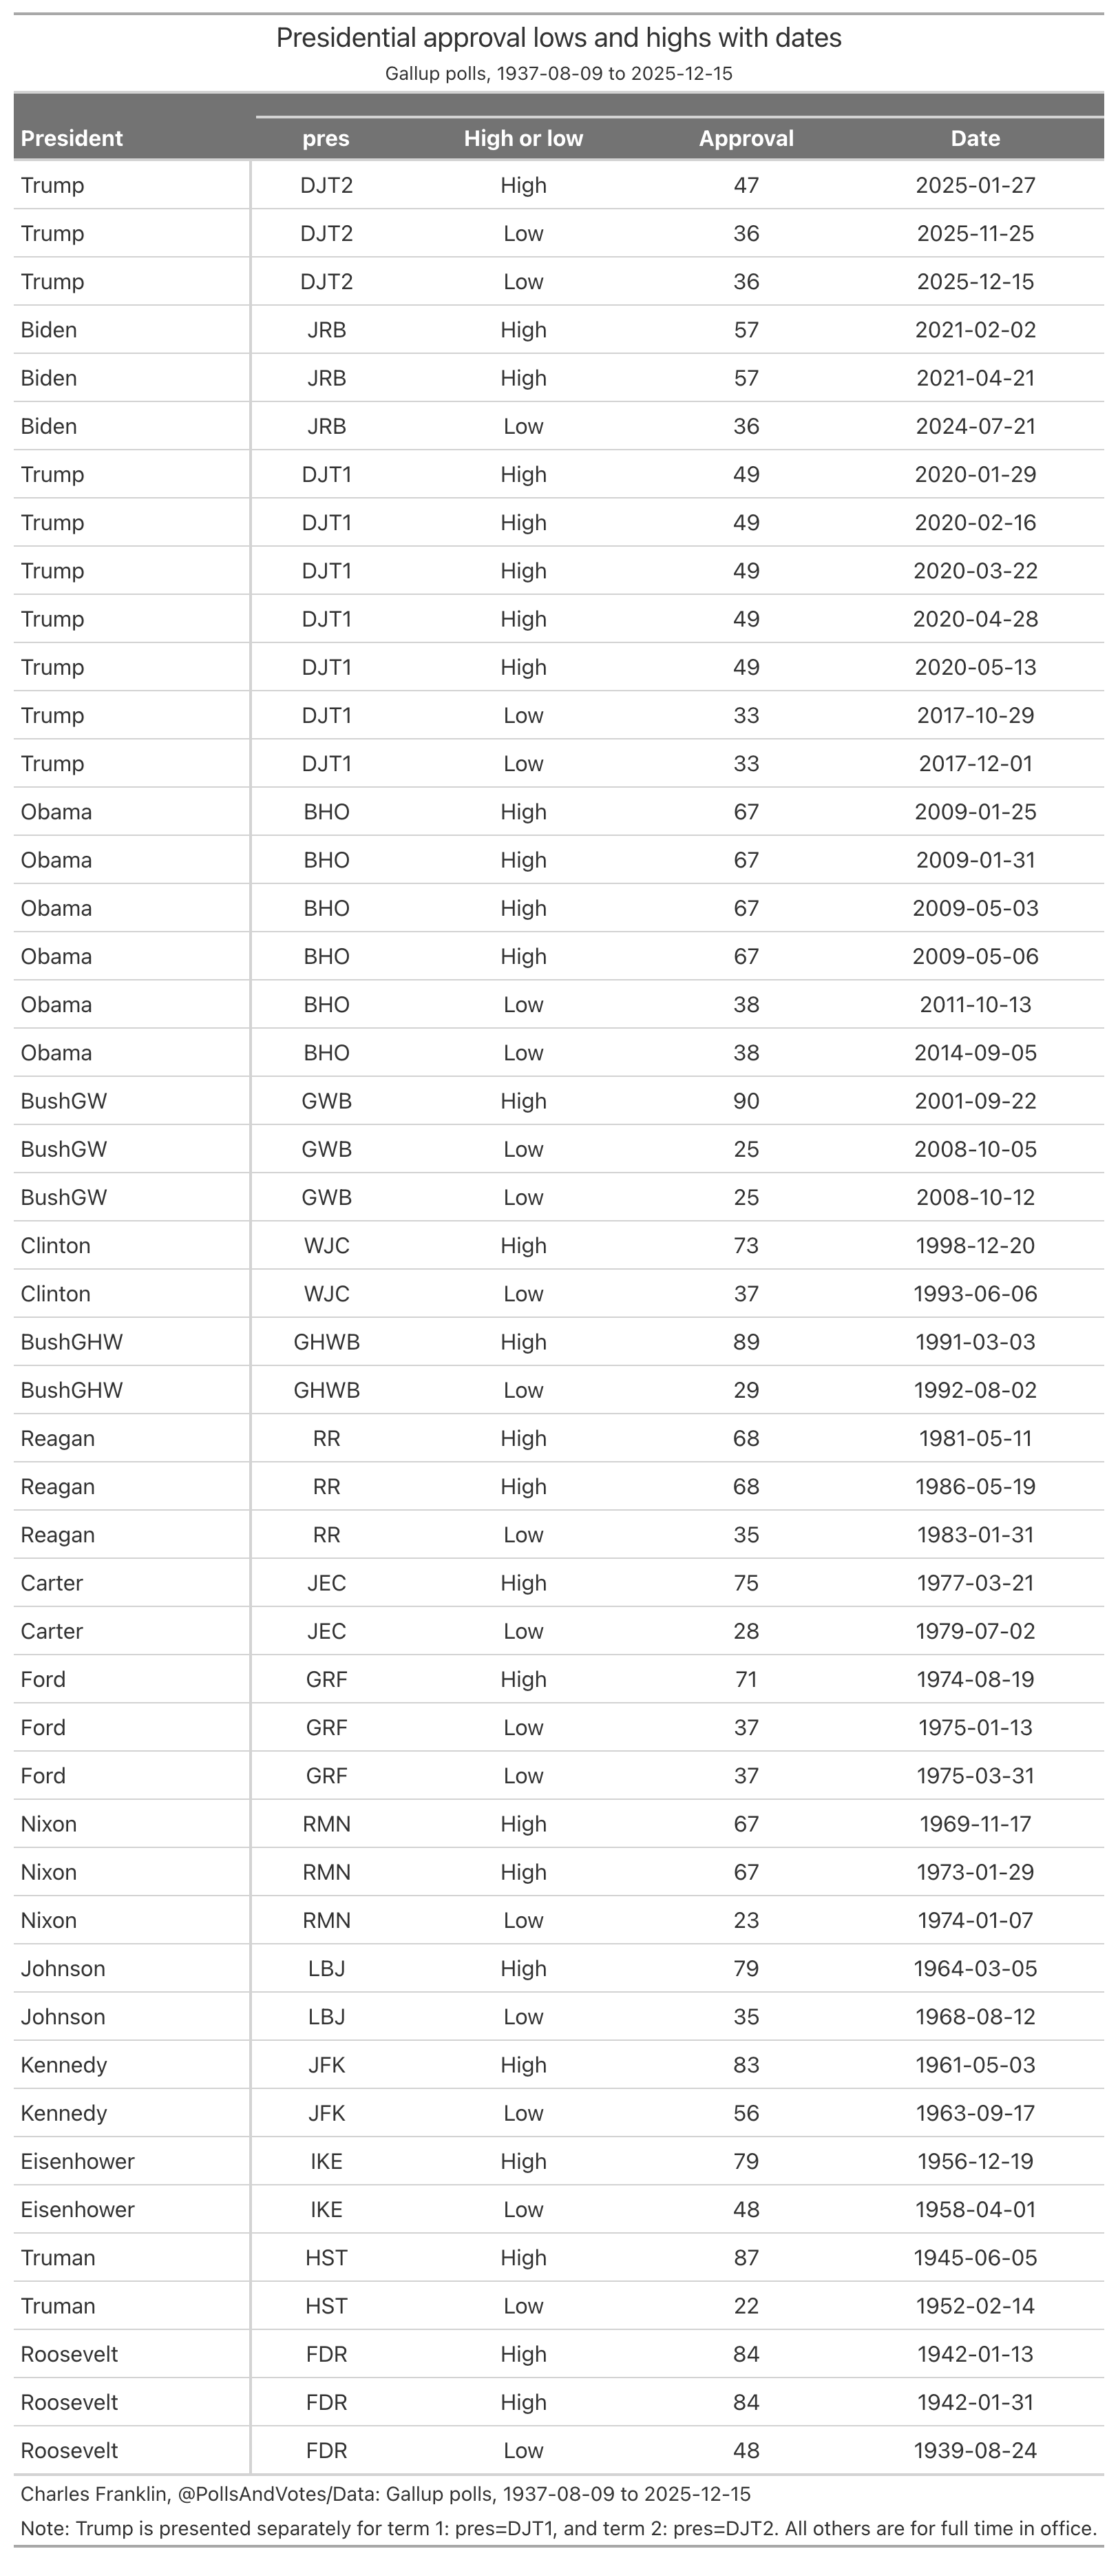
Presidents can tie their highs or lows in multiple polls on different days. The next table shows all the lows and highs and the dates on which those polls were taken. Some of the dates are instructive. Trump’s second term high came 7 days after his inauguration. And his first term highs were all during the early months of the Covid pandemic. Biden’s low came about the time he dropped out of the presidential race in 2024. For George W. Bush and Franklin D. Roosevelt, their highest marks came after attacks on the United States, after Sept. 11, 2001 and after Dec. 7, 1941.
As for largest range from high to low, that honor is shared by George W. Bush and Harry S Truman, both with a 65 point range, Bush from 90-25 and Truman from 87-22. (Truman lacks a middle name, just an initial, hence no period after the S, a lesson I learned from my 12th grade government teacher, Dr. Austin F. Staples. The great Google AI tells me official documents include a period, but I trust Dr. Staples on this.)
So there you have it. An end of a polling era. “Official” highs and lows will no longer have a consistent standard to use. This means as a practical problem that the highs and lows going forward will come from outliers– the rare poll with an exceptionally high approval and the exceptionally low ones. That, I think, is a loss.