Earlier this month, the ACLU released this interesting report on arrests for marijuana possession. The ACLU found a steady increase since 1990 in the number of arrests nationally for possession of pot. By 2010, arrests for this crime had come to account for nearly half of all drug arrests. Moreover, the ACLU also found that racial disparities in marijuana arrests increased right along with the number of arrests, even though surveys indicate that whites and blacks use marijuana at about equal rates.
Neither Wisconsin nor Milwaukee County performed well on the racial disparity front. Statewide, blacks are six times more likely to be arrested for marijuana possession than whites, which is considerably higher than the national average of 3.73. Milwaukee County’s disparity number was also above the national average at 4.7.
Coincidentally, at about the same time the ACLU released its report, the federal government’s Bureau of Justice Statistics unveiled a new on-line, interactive arrest-data tool, which permits detailed searches of arrest data from individual cities dating back to 1980. I thought it would be interesting to examine Milwaukee’s numbers over time. I focused on arrests by the Milwaukee Police Department, which differed from the ACLU’s focus on county-level data. (The MPD is only one of several law enforcement agencies in Milwaukee County, albeit the single largest.)
The first graph below shows the annual number of arrests by the MPD by race. Unfortunately, no data were available for 1986, 1998-2000, or 2004; otherwise, every year from 1980 through 2011 is included.
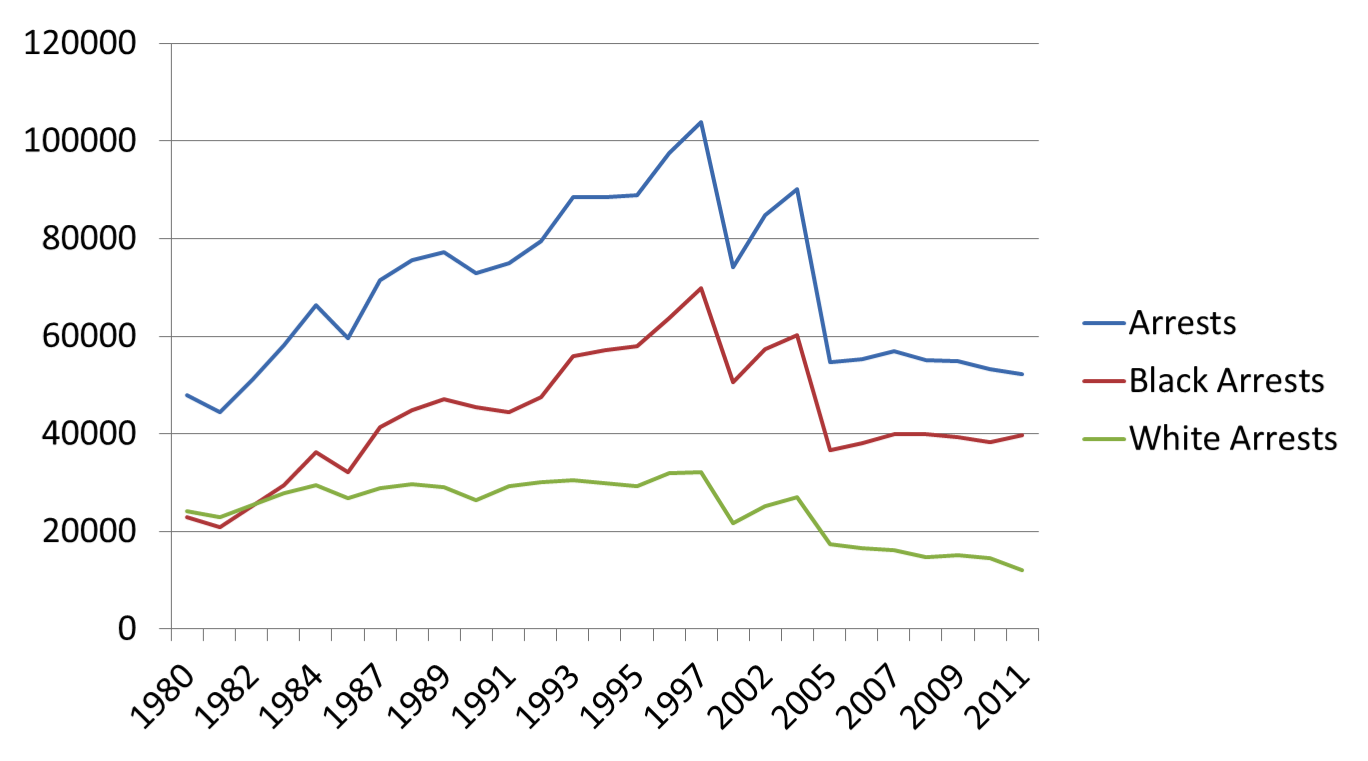
As indicated on the graph, total arrests in Milwaukee peaked in about the late 1990’s, which marked the culmination of more than a decade of sharp increases. Arrests have fallen by about half since then, which may, in part, reflect declining crime rates in the city.
It is also noteworthy that black and white arrests were about equal to one another in the early 1980’s; since then, black arrests have spiked, while white arrests have remained relatively stable, even falling below 1980 levels in recent years.
These racial trends are a bit misleading, though, because Milwaukee’s black population has increased considerably since 1980, while the white population has fallen. In order to translate the raw arrest numbers into more meaningful terms, I tried to locate year-by-year demographic data for the city. This turned out to be quite a bit more difficult than I anticipated. For one thing, I was only able to find precise numbers for 1980, 1985, 1990, 2000, and 2005-2011. (1985 figures come from a special census in that year, while 2005-2011 data come from the Census Bureau’s American Community Survey. Hat tip to Elana Olson for helping me find these numbers.) I estimated the in-between years by assuming linear change from the years with data available. But even the numbers I do have are problematic because of inconsistencies in the counting methodology, particularly with respect to Hispanics and multiracial individuals. I resolved the discrepancies as best I could by counting Hispanics as white and excluding the relatively small number of self-identified multiracial individuals. Using this approach, here is the overall population breakdown in the years for which I have arrest data:
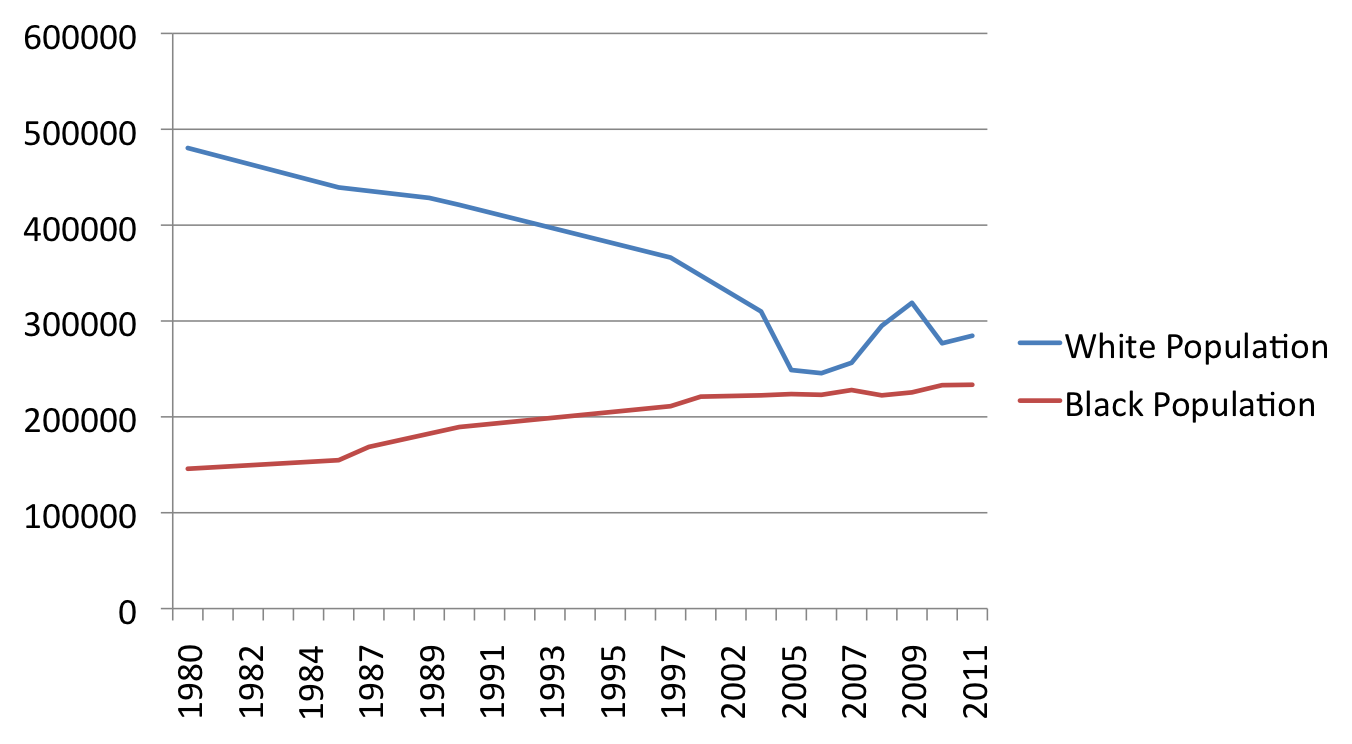
The extreme volatility in the white numbers from 2005 to 2011 seems to reflect wild swings in how many people classified themselves as “some other race.” In some years, this was a very popular option, which seems to be associated with low white totals; in other years, many fewer individuals said they were “some other race” and apparently classified themselves instead as white. Fortunately, the black numbers in this time period seem more solidly reliable.
Using the overall population data, the next graph presents arrest rates per 1,000 residents by race. The graph reveals a more consistent increase in the white arrest rate up to 1997 — an increase that was partially masked in the first graph by the declining size of the white population. Indeed, the big-picture trends in white and black arrest rates have been remarkably similar. Between 1980 and 1997, white arrest rates increased 1.8 times, while black arrest rates increased 2.1 times. Then, by 2011, the white arrest rate fell to forty-eight percent of its 1997 peak, while the black arrest rate fell to fifty-one percent of its 1997 peak. In a few years, the black and white arrest rates moved in opposite directions, but the big-picture pattern is clear: black and white arrest rates move in tandem. This pattern may come as a surprise, for police leadership and policing strategies in the city have undergone several major transitions over the past three decades. However, none of the changes seem to have resulted in large, long-lasting shifts in the relative arrest rates of blacks and whites.
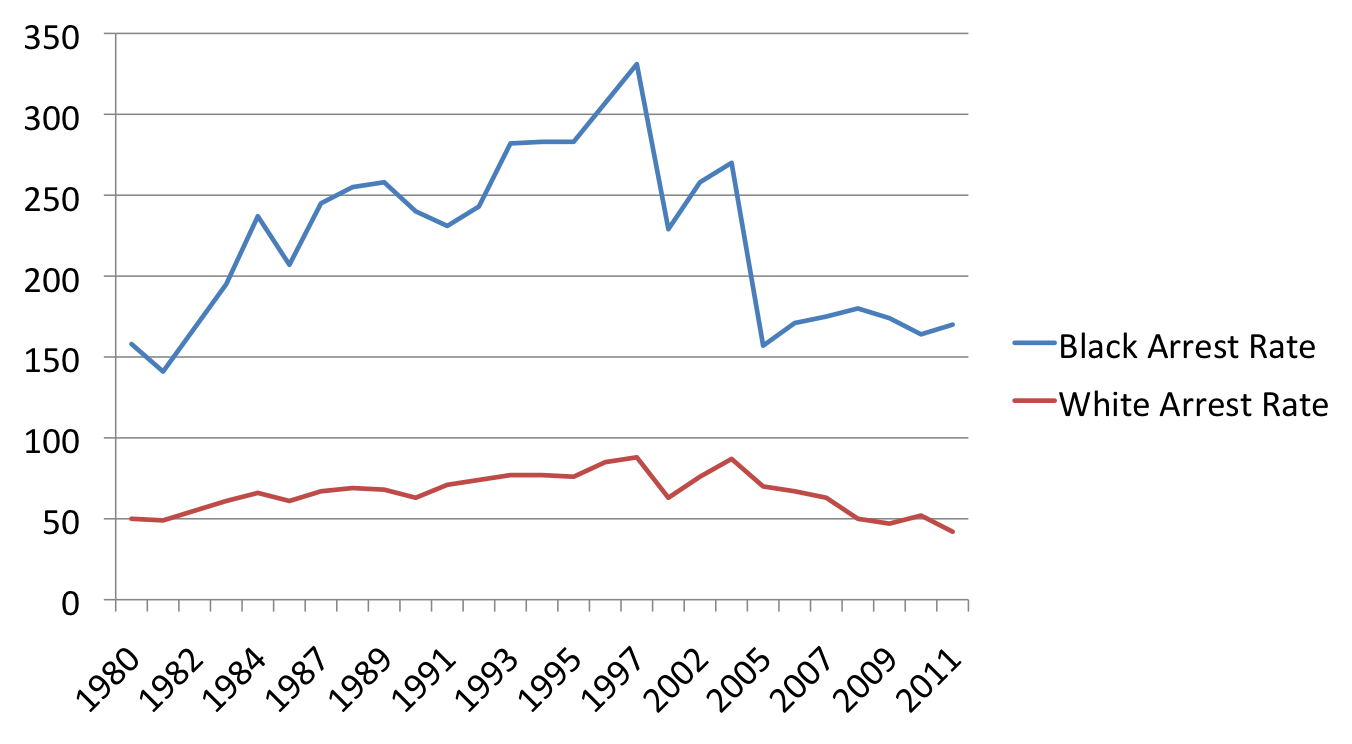
To be sure, throughout the time period, black arrest rate have been above white arrest rates. The disparity ratio has bounced around a bit, with a low of 2.2 in 2005 and a high of 4.0 in 2011. Most years, the ratio has been between 3.2 and 3.8.
Such long-term racial disparities are troubling, although it is not clear to what extent they can fairly be attributed to police discretion. Those who seek to justify disparities typically argue that the system is merely responding to different rates of crime-commission among different racial groups. And there do seem to be good reasons to think that the black community experiences elevated rates of serious violent crime. On the other hand, only a small proportion of arrests are for serious violent crime; most arrests are for relatively low-level offenses like disorderly conduct and drug possession. With such offenses, it is much harder to know to what extent racial disparities in arrests are justified.
In the next post in this series, I will examine the offense data in more detail.
Was any research conducted into the relationship between property crime and drug use? There is usually an interesting correlation between these two statistics as well.