In the first post in this series, I explored the persistent racial disparities in Milwaukee arrests. How does Chicago compare? In a nutshell, the overall disparity rates are remarkably similar in Milwaukee and Chicago, but the War on Drugs drives the disparities to a much greater extent in the Windy City than here.
Let’s start by taking a look at black and white arrest rates in Chicago since 2000:
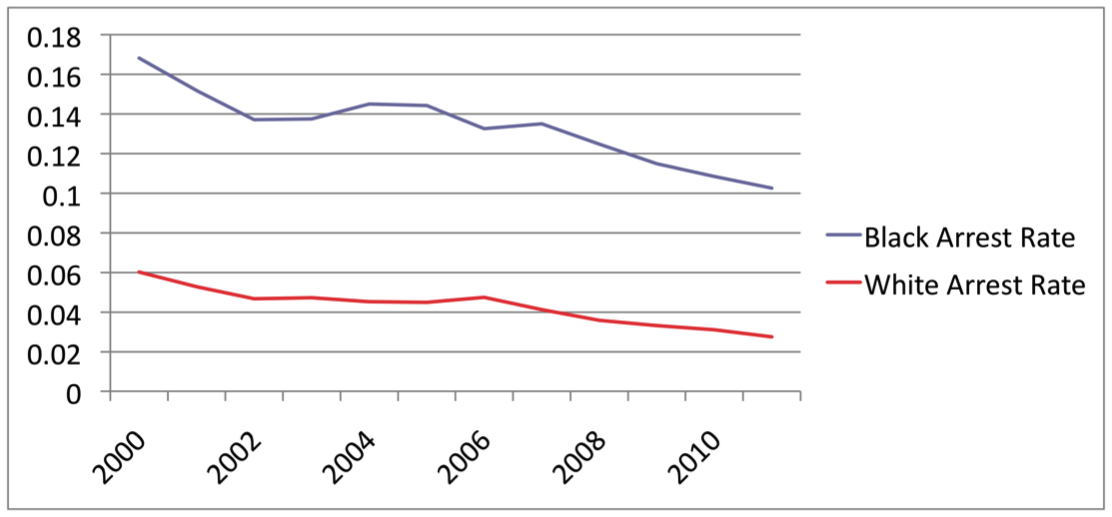
As is apparent, arrest rates have been coming down for both races, but white rates remain well below black.
Here is what has been happening in Milwaukee during the same time period:
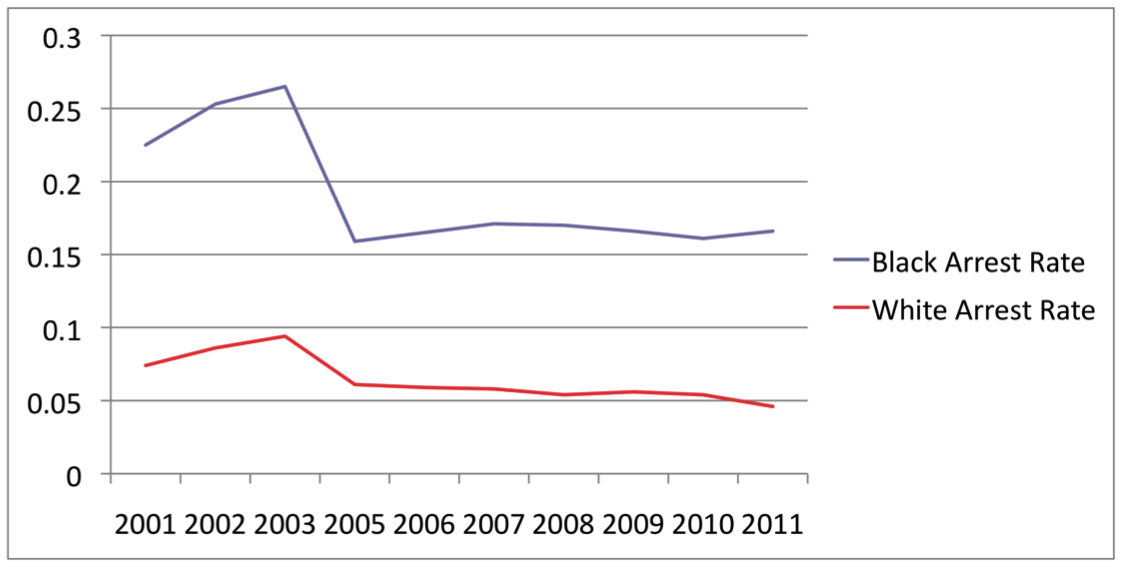
At least a couple of differences between the cities stand out. First, Milwaukee has consistently had higher arrests rates than Chicago for both blacks and whites. Second, in contrast to Chicago’s slow, steady decline in arrest rates since 2000, Milwaukee’s arrests first rose, then fell precipitously in the mid-2000’s, and ever since have remained relatively flat.
A disparity index can be calculated by dividing black arrest rates by white. Here are the disparity index figures for Milwaukee and Chicago over the past decade or so:
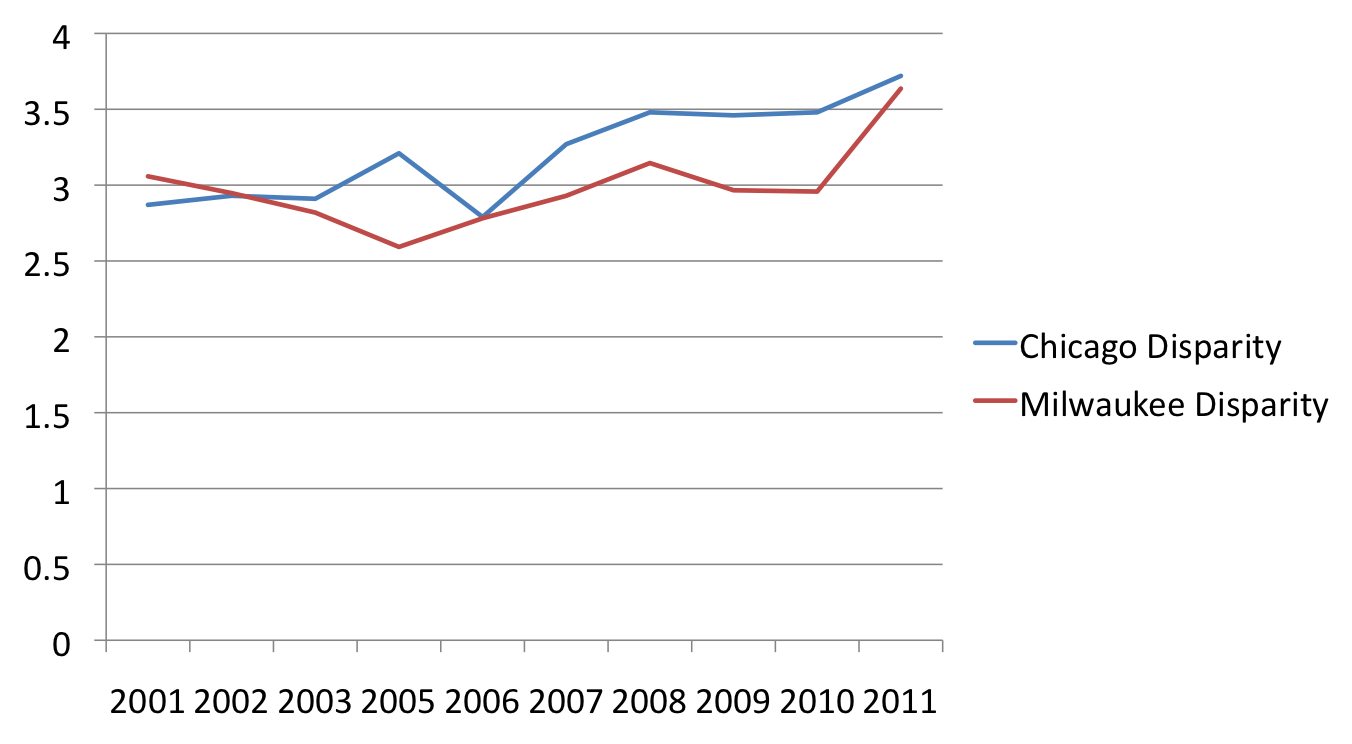
Chicago’s disparities have typically been greater than Milwaukee’s, although not always and never by much. Indeed, the gap was almost entirely erased by an increase in Milwaukee’s disparity index in 2011, the most recent year for which information is available from the Department of Justice’s on-line data tool.
Although the overall disparity numbers for Chicago and Milwaukee are very similar, Chicago has gotten to this destination by a quite different route than Milwaukee. As I described in an earlier post, blacks and whites in Milwaukee are arrested for more-or-less the same offenses. While blacks are arrested disproportionately relative to whites, there is no particular type of offense that stands out as a driver of the overall disparities.
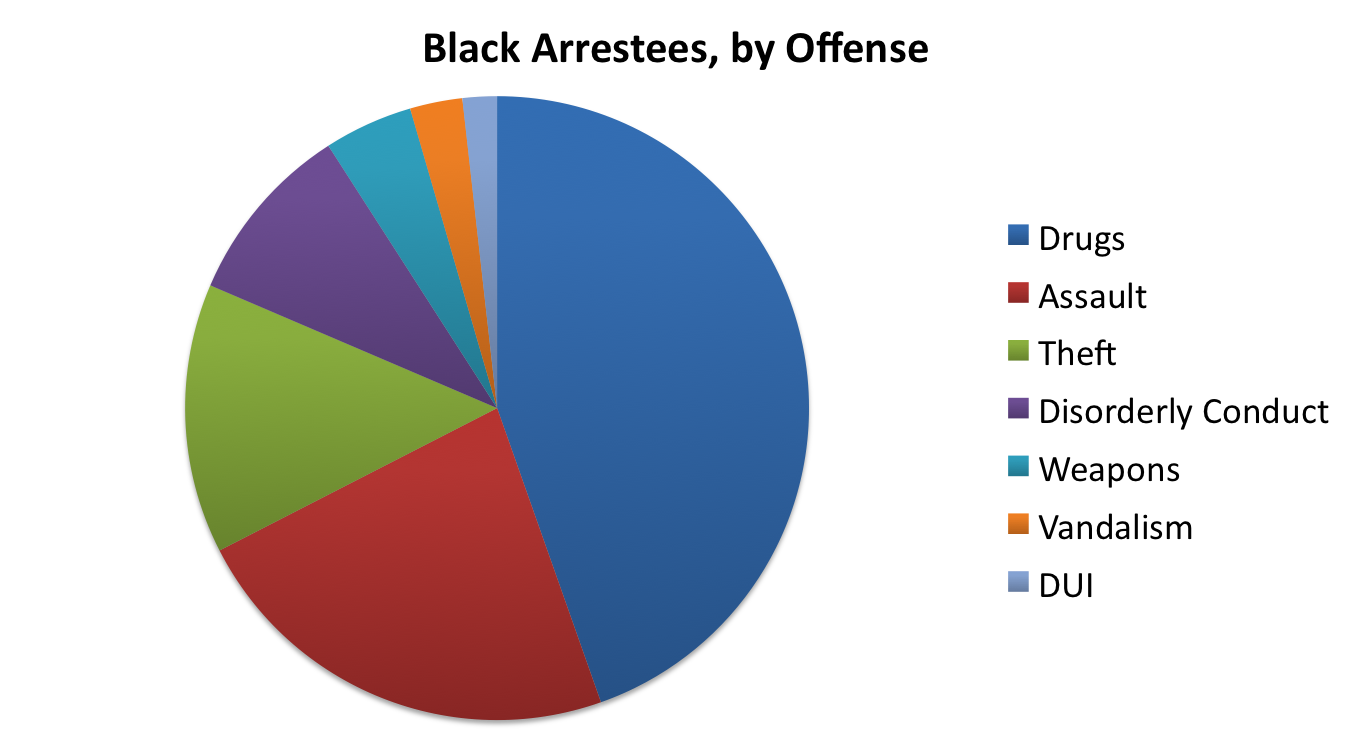
Chicago presents a rather different picture.
Here is the distribution among the top seven overall arrest categories for Chicago blacks in 2011:
And here is the distribution among Chicago whites for these same categories:
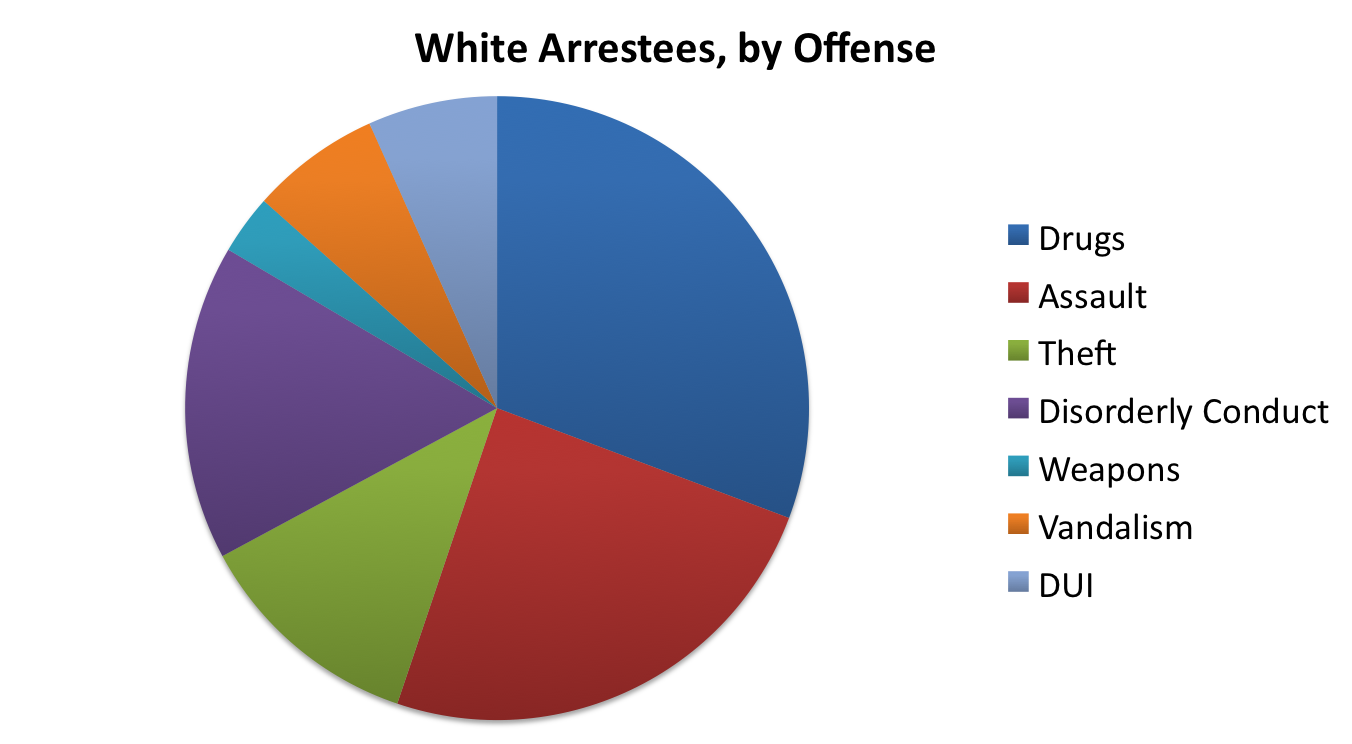
Drugs thus play a less dominant role in the white “portfolio” than in the black. Of relatively greater prominence in the white portfolio are disorderly conduct, vandalism, and DUI.
To put it differently, about one-third of all black arrests in Chicago were for drug offenses, as compared to only about one-quarter of the white arrests. The corresponding numbers in Milwaukee (10 percent and 9 percent, respectively) were both a lot closer together and a lot lower than the Chicago numbers.
Or, to put it yet another way, drug arrests accounted for nearly forty percent of the overall difference in black and white arrests in Chicago. In Milwaukee, they accounted for only about ten percent of the overall difference.
In the previous post in this series, I showed how drug arrests seem to have gradually displaced disorderly conduct arrests in Chicago since the mid-1980’s. With the data presented in this post, it appears that this shift to a drug-enforcement paradigm has had a significant racial dimension. Although both blacks and whites are now arrested more often for drug offenses than for disorderly conduct, d/c remains a more significant part of the white portfolio. Back in 1981, both blacks and whites had about ten times as many d/c arrests as drug arrests. In 2011, whites had two drug arrests for every one d/c, while blacks had five drug arrests for every one d/c.
It is possible, although not entirely clear, that these trends reflect different policing strategies in black and white neighborhoods, particularly in light of the fact that black and white drug usage rates are very similar.
In any event, the shift from d/c arrests to drug arrests may be a momentous one to the extent that drug convictions tend to carry greater penalties and collateral consequences than d/c convictions.
Earlier posts in this series:
Part I: Racial Trends in Milwaukee Arrests
Part II: Offense Trends in Milwaukee Arrests
Part III: Comparison of Offense Trends in Milwaukee and Chicago
Technical notes:
The year-by-year racial demographics of Milwaukee and Chicago have been estimated using data from the 2000 and 2010 censuses. I assumed linear change from 2000 to 2010, and then extrapolated from 2010 to get 2011 numbers.
Milwaukee arrest data for 2000 and 2004 are not available, which is why those years are omitted from graphs presenting Milwaukee numbers.
The drug offense category includes both trafficking and possession offenses. The assault offense category includes both aggravated and simple assault.
Cross posted at Life Sentences.
I’d like to know if the recidivism rates you quote include felons who reenter the corrections system by revocation.