
G. Elliot Morris argues that the polls in Wisconsin underestimated David Crowley’s support in the 2026 Democratic primary because they included too many young voters (who mostly supported Francesca Hong) and too few older voters (who mostly supported Crowley). Using the L2 voter file, he estimates that just 2-3% of a typical partisan primary’s electorate is composed of voters under 30. This analysis is incorrect because the L2 voter file is missing age data for nearly all of the youngest voters, while it includes age data for almost every older voter. Consequently, any estimate of voter participation relying on unaltered L2 age data vastly understates voting participation among young people, specifically.
Morris writes:
I pulled two different pictures of the Wisconsin electorate from the L2 voter file. One universe consisted of of Democrats and nonpartisans who have voted in at least 11% of the even-year primaries they were eligible for. The other was built by taking the L2 list of active voters who cast a ballot in at least one Democratic primary since 2016. The two universes agree with each other almost exactly, which should give us some confidence in the targets being used. Among voters with a known age, both say the primary electorate is about 52-53% seniors and 2-3% under 30.
“Among voters with a known age…” is the key bit. Morris’ analysis would be correct if the missing age data was evenly distributed throughout the population. However, in Wisconsin, it is overwhelmingly concentrated among the young.
The reason for this is simple. Even though Wisconsin collects each voter’s birthday when he or she registers to vote, the state Elections Commission does not sell this information. Wisconsin’s actual public voter file–the one sold by the state–includes scarcely any information about each voter. Here is the list of data elements. Besides election participation records, it includes each voter’s name, address, and contact information. It does not include the voter’s age.
Instead, date of birth is one of the many voter attributes L2 acquires from commercial sources and adds to the Wisconsin voter file before selling it. The older a voter is (and the longer they’ve been registered), the more opportunities L2 has to determine that voter’s birthday. Mechanically, the coverage of the age variable increases with the age of the registrants.
Although the Wisconsin Elections Commission does not sell access to each registrant’s birth date, the WEC does publish a monthly file summarizing the registered voter population by five age ranges. Using that file, we can compare the number of actual registered voters in each age range with the number in L2’s most recent Wisconsin file.
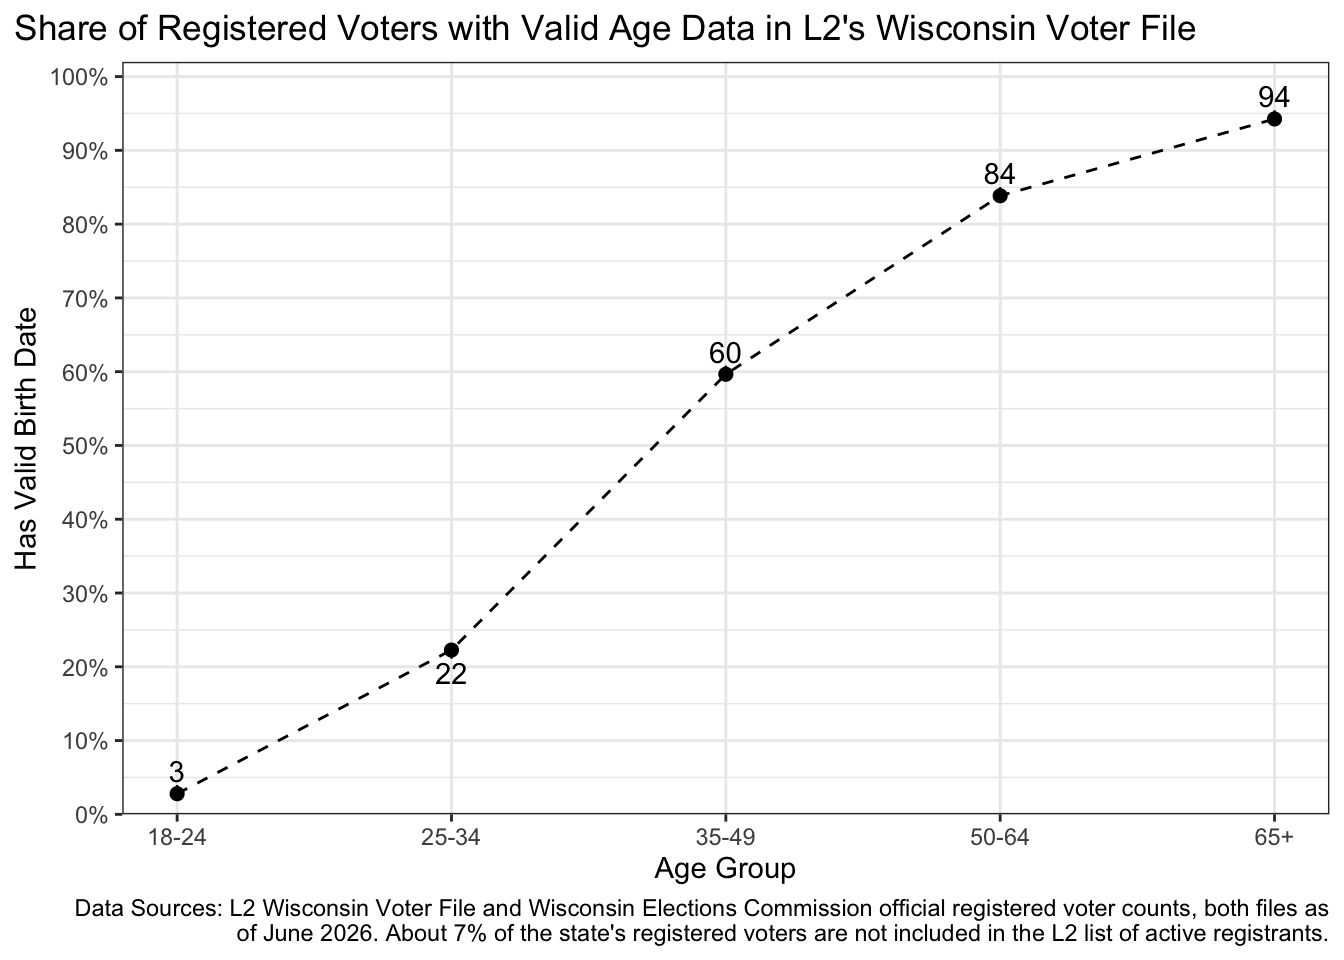
The L2 file only contains birth dates, and thus ages, for 3% of registrants under the age of 25. This grows to 22% among those ages 25-34, and rises steadily thereafter, reaching 94% among voters 65 and up.1
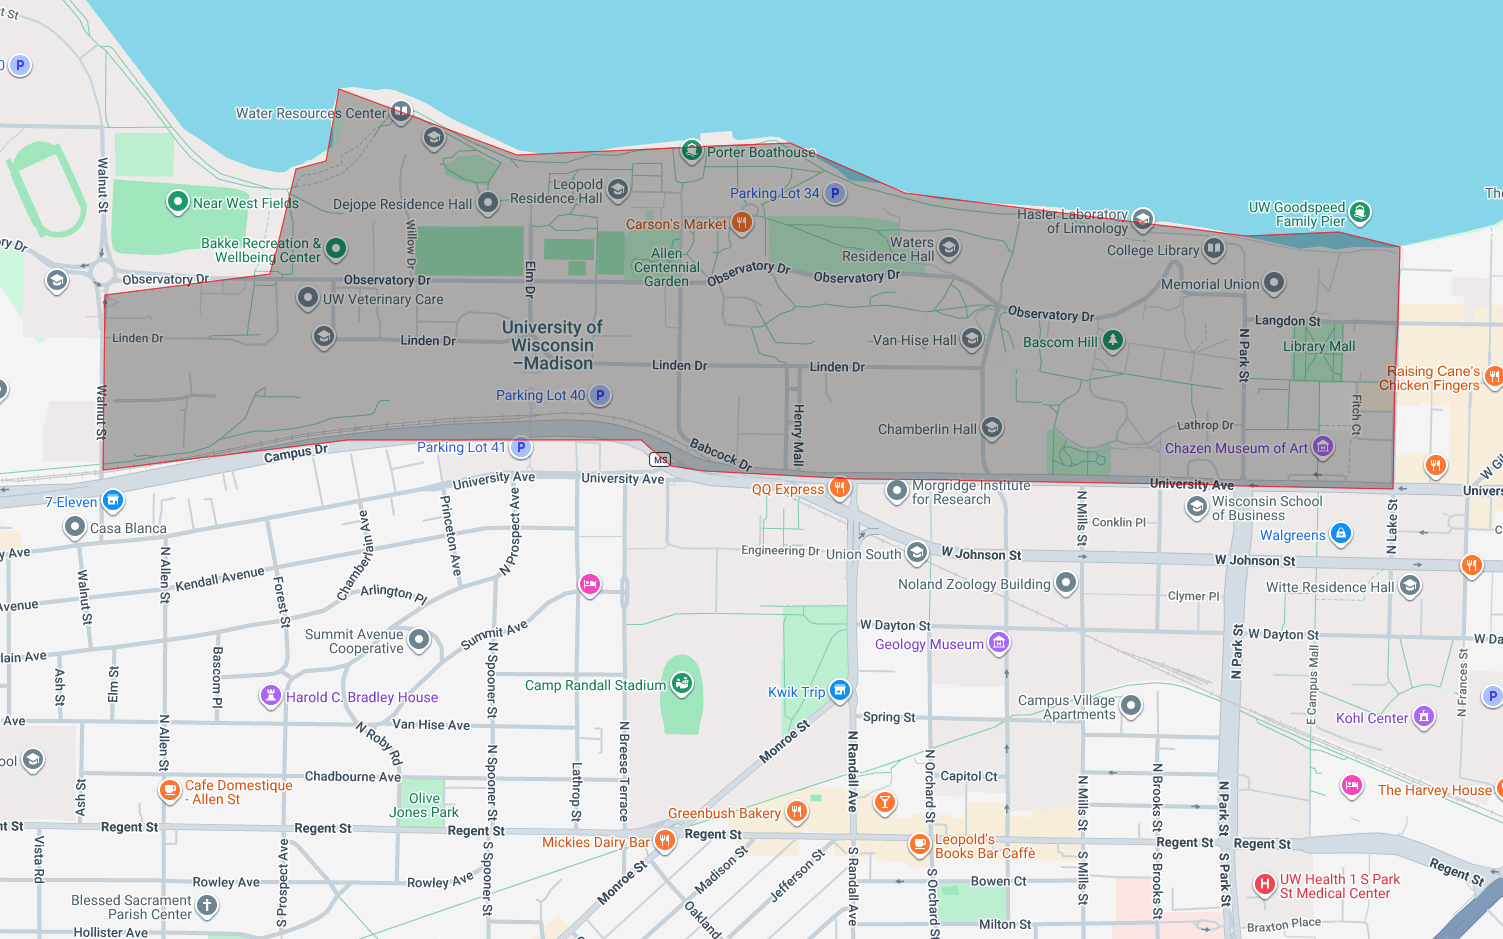
Excluding voters with missing ages means ignoring the youngest areas of the state. To illustrate: tract #001102 is roughly coeterminous with UW Madison’s campus. Here, the median age is 19 and 99.4% of registration records lack a birth date.
When Morris uses the L2 file to calculate that the typical primary electorate is 2-3% voters under 30, this just reflects the large amount of missing data among young registrants. Among voters with a valid age in the L2 file, just 5% are under the age of 35. Actually, 22.5% of registered voters are this young, according to the official statistics from the WEC.
| Comparison of Wisconsin Registered Voter Records by Age Group | |||||
| both data sources as of June 2026 | |||||
| Official WEC | L2 Voter File | ||||
|---|---|---|---|---|---|
| Count | Pct. | Count | Pct. | Valid Pct. | |
| 18-24 | 316,765 | 8.8% | 8,854 | 0.3% | 0.4% |
| 25-34 | 492,525 | 13.7% | 109,671 | 3.3% | 4.6% |
| 35-49 | 819,517 | 22.7% | 488,853 | 14.7% | 20.5% |
| 50-64 | 869,380 | 24.1% | 728,947 | 21.9% | 30.6% |
| 65+ | 1,107,125 | 30.7% | 1,043,544 | 31.3% | 43.8% |
| Missing | — | — | 955,884 | 28.7% | — |
A better way to measure voter participation
So far, I’ve only been examining voter registration, not election participation, because the WEC does not publish official statistics breaking down each electorate by age. Fortunately, there is another reliable source we can use to measure young people as a share of the electorate.
After every November election, the Census Bureau fields the November Voting and Registration Supplement to its regular Current Population Survey (CPS). This survey is routinely used by pollsters to develop target weights, and it quite closely matches the official statistics published by the WEC.
To demonstrate, the table below shows statistics from the 2024 presidential election in Wisconsin. I compare the actual age breakdown of registered voters from WEC with the results of the CPS November Supplement and registered voter age counts from the L2 file.
Following the 2024 presidential election, 10.2% of Wisconsin’s registered voters were between the ages of 18 and 24. But because L2 had been unable to match birthdays for these relatively new registrants, the file showed that only 0.6% of all registered voters (and 0.8% of those with a valid age) were under the age of 25. In raw numbers, there were 18 times more registrants under 25 in reality than in the L2 file.
The L2 file also lacked birth dates for many registrants ages 25-34. In L2’s data, these comprised 5.8% of registered voters with valid age records, but in reality they made up 14.8%. Meanwhile, the L2 file includes a birth date for almost every older registrant, so when calculated as a proportion of voters with a valid age (as Morris did) they appear grossly overrepresented.
By contrast, the Current Population Survey appears quite accurate. It estimated that adults under 25 made up 9.3% of registered voters in November 2024 compared with the WEC count of 10.2%.
| Wisconsin: Measures of Late 2024 Voter Registration by Age | |||||||
| Official WEC Count1 | L2 Voter File2 | Current Pop. Survey3 | |||||
|---|---|---|---|---|---|---|---|
| Count | Pct. | Count | Pct. | Valid pct. | Count | Pct. | |
| 18-24 | 395,027 | 10.2% | 21,847 | 0.6% | 0.8% | 390,758 | 9.3% |
| 25-34 | 576,162 | 14.8% | 152,075 | 4.1% | 5.8% | 670,967 | 16.0% |
| 35-49 | 879,180 | 22.6% | 566,835 | 15.3% | 21.6% | 1,024,721 | 24.5% |
| 50-64 | 945,704 | 24.4% | 814,644 | 22.0% | 31.0% | 1,039,141 | 24.8% |
| 65+ | 1,087,413 | 28.0% | 1,074,589 | 29.0% | 40.9% | 1,060,893 | 25.3% |
| Missing | — | — | 1,071,505 | 28.9% | — | — | — |
| 1 Data from the Wisconsin Elections Commission as of December 1, 2024. | |||||||
| 2 Data from the Wisconsin L2 file downloaded in early 2025. | |||||||
| 3 Data from the November 2024 Voter Supplement, retrieved from IPUMS CPS. | |||||||
Having verified that the CPS November Supplement accurately captures the age breakdown of Wisconsin’s registered voters, I will now use it to calculate voter participation by age. These statistics are self-reported and subject to normal sampling error, but I tend to trust them, given how closely their age breakdown matches the real WEC stats.
In this table, I adopt the 18-29 year-old age category used by Morris instead of the age bins used by the WEC.
Eighteen-to-twenty-nine-year-olds made up 20% of the adult population in 2024. They accounted for 14% of voters in the November election, according to the CPS. But in the L2 data, voters under 30 were only 3% of voters with a known age. The reason for this is obvious. The L2 file following the 2024 election lacked age data for 938,000 voters, and this included the vast majority of the youngest voters in the state, for whom L2 had so far been unable to add a birth date.
| Wisconsin: Measures of Nov. 2024 Voter Participation by Age | |||||||
| Number/share of voters according to the… | |||||||
|---|---|---|---|---|---|---|---|
| Total Population1 | Current Pop. Survey2 | L2 Voter File3 | |||||
| pop | Pct. | Count | Pct. | Count | Pct. | Valid pct. | |
| 18-29 | 921,521 | 20% | 435,373 | 14% | 68,327 | 2% | 3% |
| 30-39 | 759,131 | 16% | 496,476 | 16% | 209,702 | 6% | 9% |
| 40-49 | 714,657 | 15% | 506,563 | 16% | 396,191 | 12% | 16% |
| 50-59 | 706,834 | 15% | 637,572 | 20% | 464,985 | 14% | 19% |
| 60-69 | 800,599 | 17% | 495,951 | 15% | 610,679 | 18% | 25% |
| 70-79 | 545,130 | 12% | 439,122 | 14% | 474,926 | 14% | 19% |
| 80+ | 272,536 | 6% | 190,028 | 6% | 231,838 | 7% | 9% |
| Missing | — | — | — | — | 937,819 | 28% | — |
| 1 Data from the Population Estimates Program July 1, 2024 single-year-of-age dataset. | |||||||
| 2 Data from the November 2024 Voter Supplement, retrieved from IPUMS CPS. | |||||||
| 3 Data from the Wisconsin L2 file downloaded in early 2025. | |||||||
Crowley’s performance
David Crowley remained out of the governor’s race until July 18th. On July 17th, his support was presumably virtually 0%.2 By election day on August 11th, his support had reached 40% to Hong’s 39%. The last Marquette Law School Poll was fielded July 22-27. At that time, we found his support was 7% to Hong’s 38%. Plausibly, the Marquette poll underestimated Crowley’s support a week after he reentered the race, but I judge it at least equally plausible that most of Crowley’s gains came in the final two weeks of the campaign.
Whatever the case, a far less likely explanation of Crowley’s success is that the August primary electorate included only 2-3% voters under age 30. That conclusion relies on misunderstanding Wisconsin’s voter file. The version of the file sold by the state does not include age information for any registrant, and the most common commercially available form of the file only reliably adds birth dates for older voters.
Footnotes
- As of this writing, the most recent L2 file includes state data from June 6, 2026. Comparing that file to contemporaneous data from the WEC shows that about 7% of the state’s registered voters are not included in the L2 list of active registrants at all. These could be individuals who are redacted from the purchaseable voter file due to safety concerns.↩︎
- It’s true that candidates who’ve dropped out of a race but remain on the ballot receive some of the vote. But most of this can be attributed to early voters casting ballots before a candidate withdraws. In the City of Milwaukee, where I know the composition of election day vs. early voters, Mandela Barnes (who dropped out on July 30th) received 10.4% among early voters but just 0.9% of election day ballots.↩︎