Border Republicans vs. Inflation Republicans
We released a new Marquette Law School Poll of Wisconsin voters today. It includes a lot of details about topics like the Wisconsin Supreme Court race (voters aren’t paying much attention yet), the gubernatorial primary (voters aren’t paying attention to that either), and data centers (voters really don’t like them).
Here’s one result from the poll that stood out to me. It comes from a bog-standard polling question that we ask variations of in most surveys. “Which one of the following issues matters MOST to you right now?” We occasionally change the response options based on what’s in the news.
In this poll and our previous October poll, we offered the same 8 options. The choices were jobs and the economy, inflation and the cost of living, public schools, illegal immigration and border security, abortion policy, crime in your community, gun violence, health insurance, taxes, and affordability of housing.
If I had to summarize the consensus as to why Donald Trump won in 2024, two policy issues would rise to the top (setting aside incumbency advantage and the drama around Biden). They are concerns about affordability/inflation and border security/immigration. Trump’s 2024 campaign succeeded in capturing support from voters who cared about each of these, but the two issues share no basic ideological connection.
Trump has, during his first year, struggled to satisfy both concerns. His administration has spent a great deal of political capital on anti-immigration measures. On affordability, Trump has struggled to find a message, insisting at times that the whole issue is a Democratic “hoax.”
Nonetheless, these two issues remain the two most important for Wisconsin Republicans in our surveys. In October, 23% of Republicans (including Republican-leaning independents) listed inflation and the cost of living as their top issue, while 31% chose illegal immigration and border security. In February, the balance flipped, as 27% chose inflation and 22% immigration.
I thought pooling the two surveys might yield some interesting insights into these two large groups of Republicans—those who worry most about affordability and the cost of living vs. those whose main concern is illegal immigration and border security. As shorthand, I’ll call these “border Republicans” and “inflation Republicans.”
Demographic Differences Between Border and Inflation Republicans
Across those two surveys, 25% of Republicans chose inflation and 27% chose immigration/border security as their most important issues. So, among Republicans as a whole, 2 percentage points more preferred immigration and border security. Here is the same calculation for a bunch of different groups within the Republican party.
The biggest gaps are along ideological and age lines.
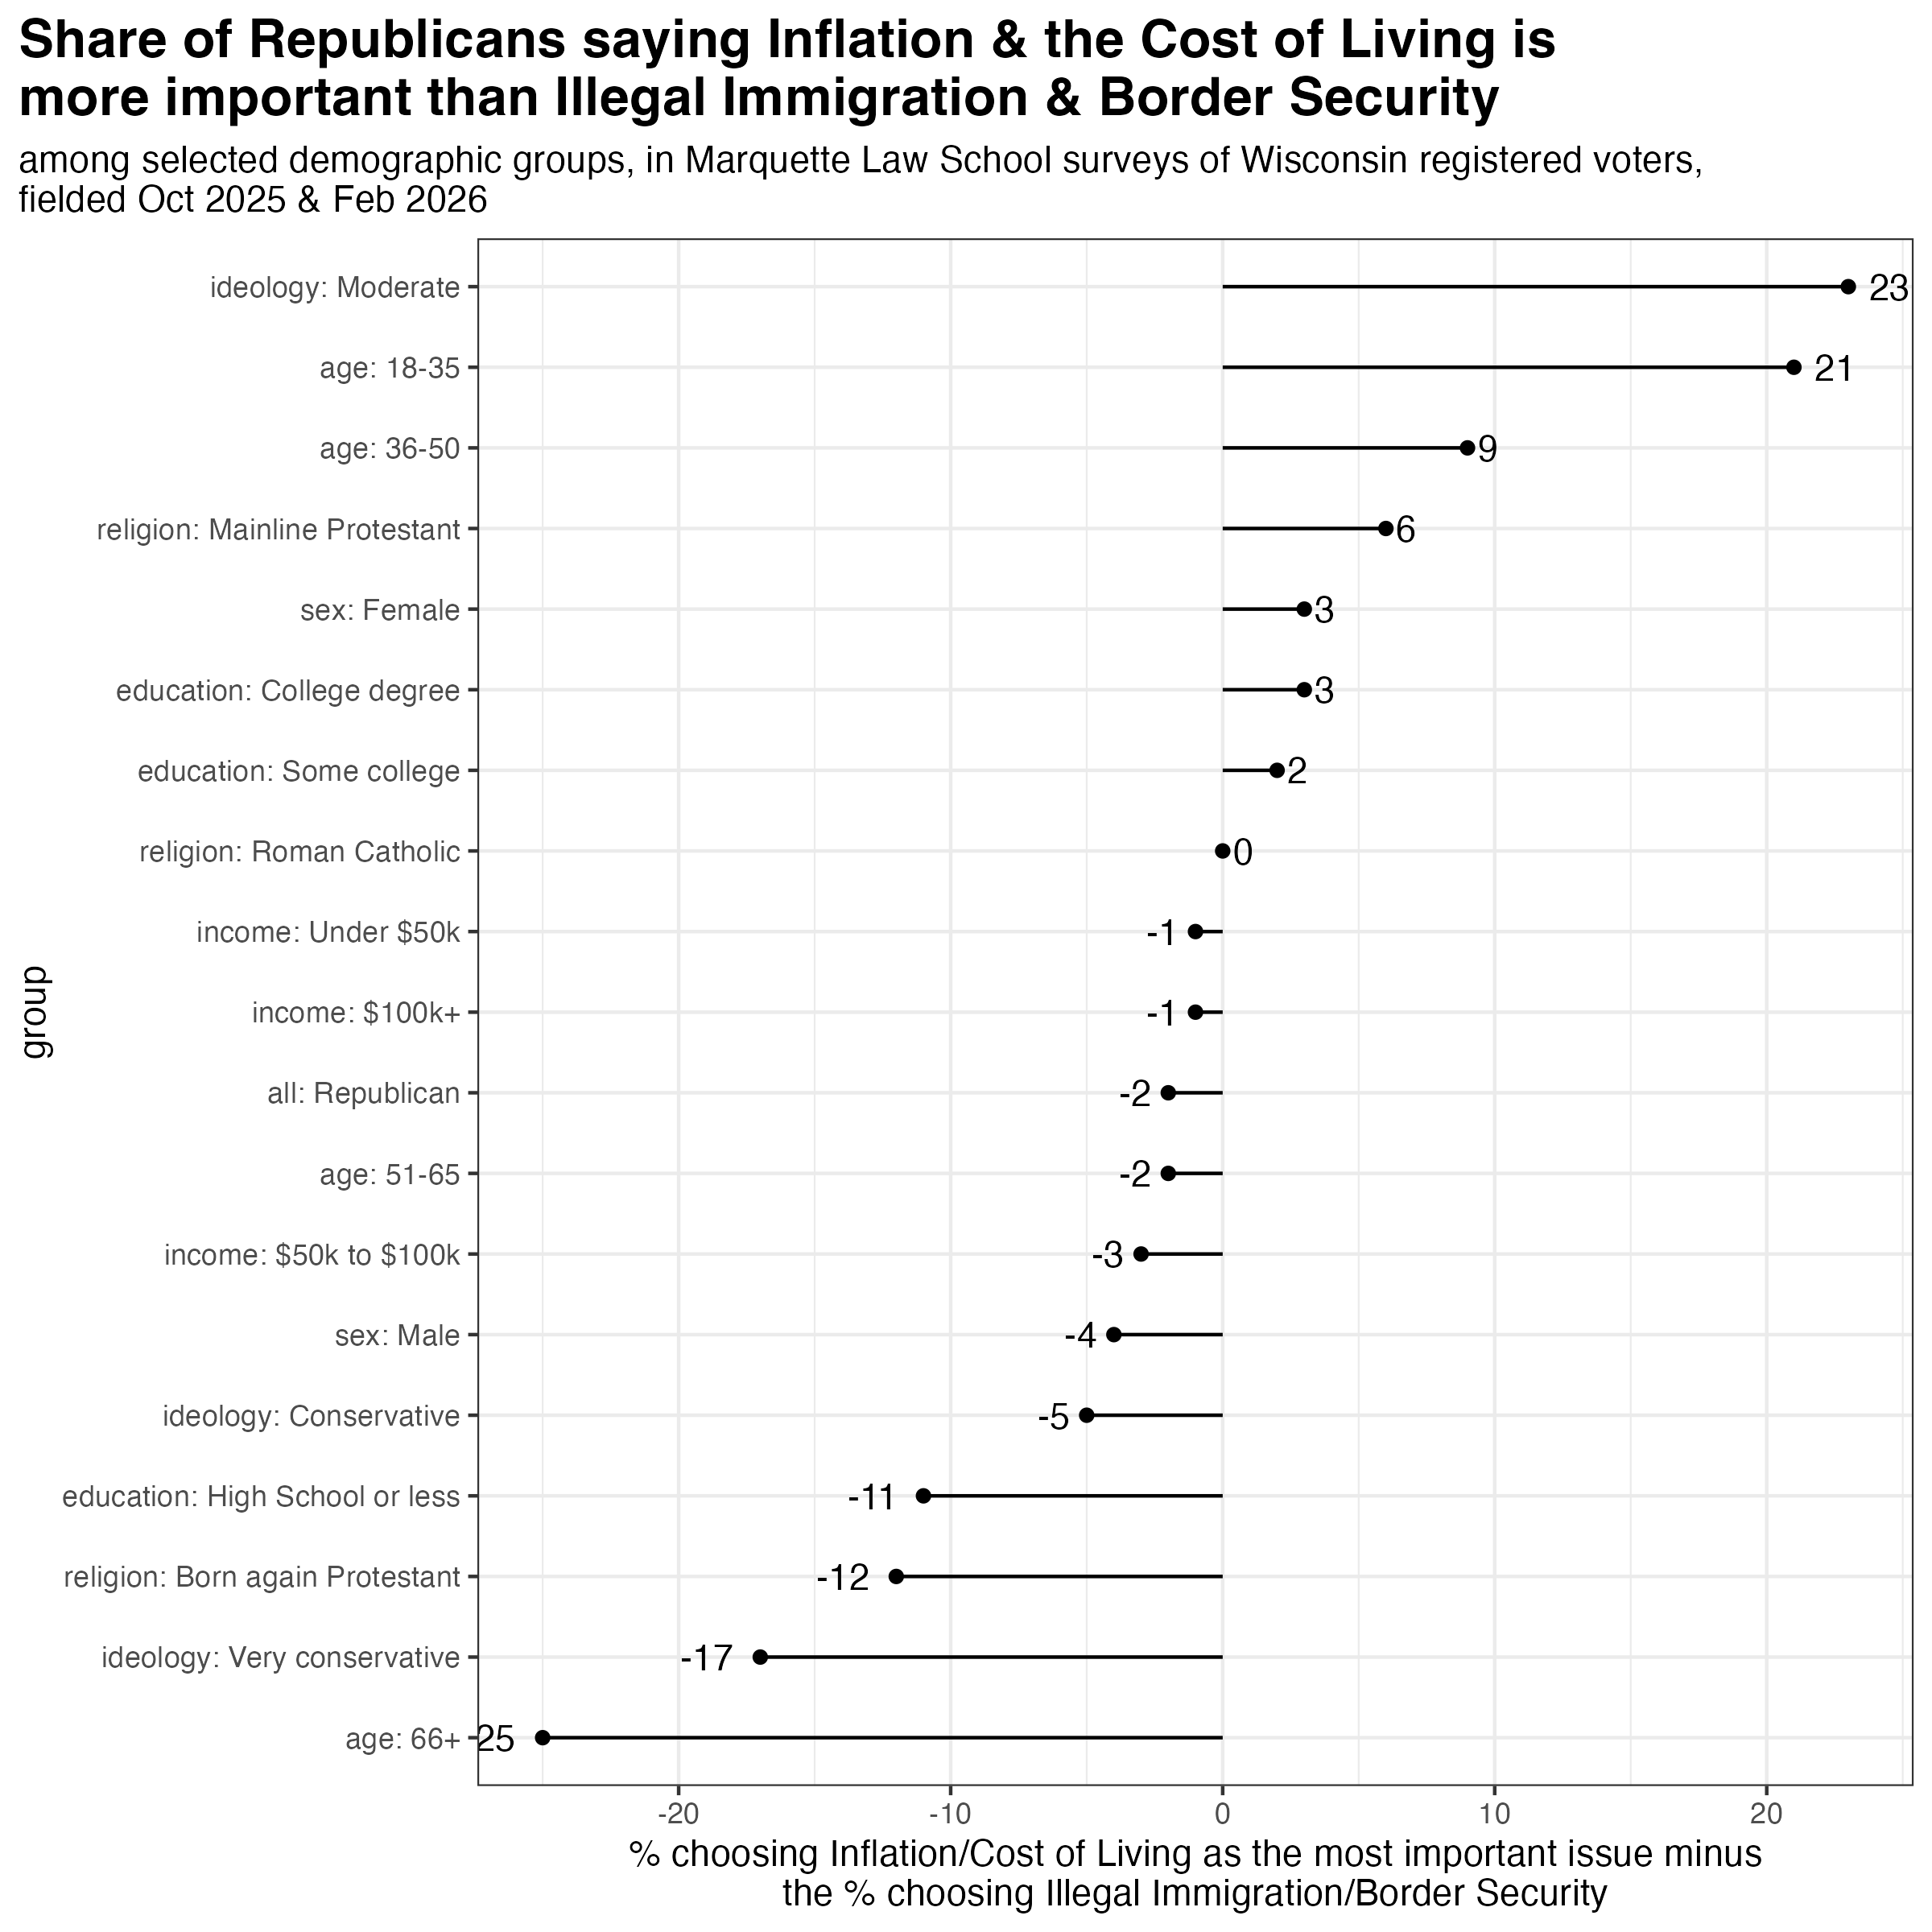
Self-described “moderates” made up 21% of Republicans in this sample, and they prioritized inflation by 23 points. Self-described “very conservative” Republicans made up a similar 25% of the total, and they prioritized illegal immigration and border security by 17 points.
About a fifth of Wisconsin Republicans are under age 36, and this group prioritized inflation by 21 points. At the other end of the spectrum, 28% of Republicans are over age 65, and they prioritized the border by 25 points.
About a quarter of Wisconsin Republicans identify as a born again or evangelical Christian. They prioritized the border by 12 points. All other protestants (32% of Republicans) prioritized inflation by 6 points. Catholics were evenly divided.
Other differences were smaller. Female Republicans prioritized inflation by 3 points; male Republicans prioritized the border by 4 points. Republicans with no more than a high school degree prioritized the border by 11 points. Those with a college degree preferred inflation by 3 points. There was little difference at all between Republicans by income.
Differences in the Attitudes of Border and Inflation Republicans
Republicans whose top priority is addressing inflation and the cost of living tend to be younger, and more self-consciously moderate. Those who prioritize addressing illegal immigration and border security tend to be older, conservative, and evangelical. In Wisconsin, the two groups are roughly equal in size, and together make up about half the party.
Do these differences in priority translate to different attitudes toward Trump and his party?
First of all, there isn’t much difference in how these people view the Democratic party. Border Republicans are 98% unfavorable and 0% favorable. Inflation Republicans are 92% unfavorable and 3% favorable. More inflation Republicans haven’t heard enough or say they don’t know.
There’s a bigger difference in how these two groups see the Republican party. Border Republicans are 94% favorable, compared to just 79% of inflation Republicans.
The two groups both overwhelmingly opposed Harris in 2024. Of those who voted, 99% of border Republicans supported Trump and 0% Harris. Among inflation Republicans who voted, 93% supported Trump and 1% Harris.
Despite supporting Trump in 2024 by more than 9-in-10, the two groups differ in their assessment of his job performance thus far. Eighty-two percent of border Republicans “strongly” approve of the job Trump is doing and only 1% disapprove. Among inflation Republicans, only 39% “strongly” approve. Most of the rest (46%) “somewhat” approve, so these voters aren’t lost to Trump, but they are low on enthusiasm for him.
That lack of enthusiasm can change elections. All these survey respondents are registered voters, and nearly equal numbers recalled voting in the 2024 presidential elections—95% of border Republicans and 94% of inflation Republicans. Despite this, the two groups vary enormously in their plans to vote in Wisconsin’s upcoming April election. Among border Republicans, 82% are “absolutely certain” they will vote. Among inflation Republicans, only 62% are so certain.