The recent deaths of American citizens at the hands of federal law enforcement agents renews the persistent, and at times intractable, debate over Juvenal’s question, which echoes through time: Quis custodiet ipsos custodes? Who, indeed, will guard the guardians?
The state’s power over the individual is most acutely on display when agents of the government use deadly force against a citizen. That force can involve a split-second decision by a police officer on the street, it can occur in a systemic setting such as a jail or prison when a person dies of abuse or neglect, and it can take the form of a court-sanctioned execution in a death-penalty state or after a conviction under a qualifying federal offense.
All police-related deaths should elicit deep concern from a free people living under the rule of law. Answering the concerns related to “why” does not need to be complicated and divisive. There are well established procedures to conduct effective police-use-of-force investigations without requiring court intervention. I will not enter here into the complicated world of prosecuting or suing federal law enforcement agents (see one examination here).
What I will suggest is that Wisconsin is a national model of how officer-use-of-force investigations may appropriately be conducted, and it is also an example of codifying the moral obligations of those empowered—as a last resort—to take the lives of our fellow citizens. The President, Congress, and particularly the officials appointed to lead federal law enforcement officers should follow Wisconsin’s example.
It is hard to think of a more extreme example of a federal government effort to “commandeer” state or local government action than the Department of Homeland Security’s “Operation Metro Surge” in the Twin Cities. President Trump and AG Bondi disapprove of policy decisions made by Minnesota and Minneapolis elected officials, from the way they have chosen to prosecute federal benefits fraud cases to their limitations on cooperation with immigration enforcement agencies. So in order to coerce Governor Tim Walz or Mayor Jacob Frey to comply with its preferred policies, the Trump administration has deployed thousands of ICE and CBP agents to terrorize the people who voted for them (and who largely did not vote for Trump). On this reading, Minnesota’s lawsuit alleging, among other things, that Operation Metro Surge violates the Tenth Amendment’s prohibition on commandeering should be a slam dunk for the state.
So why did Judge Katherine Menendez (a Biden appointee) deny the state’s request for a preliminary injunction kicking ICE out of its borders? As DHS has conducted its deadly operations in Minnesota, I’ve been continuing to think about the Trump 2.0 phenomenon that in a previous blog post I described as “federalism by extortion”: its preference to conduct its intergovernmental relations using threats of extraordinary punishments. Understanding the novelty of the Trump administration’s assault on state and local governments reveals some important limits of established federalism doctrine, making the prospects for judicial relief in these circumstances look more fleeting than one might have assumed.
Judge Mendendez’s January 31 opinion is a case in point. To start, she expressed some doubt that Operation Metro Surge falls within the scope of the Tenth Amendment’s anticommandeering doctrine at all. As she points out, all of the cases in which the Supreme Court has upheld this doctrine involve states’ challenges to acts of Congress. According to the Court, these statutes—as Justice Scalia wrote of the Brady Handgun Violence Prevention Act in Printz v. United States—improperly sought to “direct” state officials “to participate … in the administration of a federally enacted regulatory scheme.” Operation Metro Surge, of course, is not an act of Congress, but (ostensibly) a law enforcement action by an Executive Branch agency.
Judge Menendez did not go so far as to endorse the view that this prohibition on commandeering exempts the Executive Branch entirely. But she did conclude that applying this doctrine to an operation by a federal law enforcement agency would be “unprecedented,” and declined to extend the law in this way at the preliminary injunction stage. She also articulated various other concerns with the prospect of a judge enjoining law enforcement actions: from the worry that this might exceed her equitable authority or the state’s standing under United States v. Texas, to the possibility that scrutiny over agencies’ motivation might “venture into a uniquely controversial political question.”
A “surge” of armed federal agents might seem on its face to be far more coercive than anything at stake in the Supreme Court’s anticommandeering and related case law. Chief Justice Roberts in NFIB v. Sebelius described the Affordable Care Act’s Medicaid expansion as a “gun to the head,” but try telling that to Renee Good, Julio Sosa Celis, or Alex Pretti. But it is not obviously clear—at least not obviously enough to secure preliminary relief that could put an end to the operation—that this kind of law enforcement action falls within the scope of constitutional doctrine designed to protect states from federal coercion.
Even assuming that the anticommandeering doctrine does ultimately cover this kind of federal government behavior, this case reveals a further difficulty in applying established federalism paradigms to the Trump administration’s exercise of federal power. Although I might not be as hesitant as Judge Menendez to credit DHS’s argument that its goal was simply to enforce the law, there is an important sense in which Operation Metro Surge is also not really an attempt to commandeer state and local cooperation with immigration enforcement. Of course, this is straightforwardly what Trump administration officials such as Pam Bondi or Tom Homan have said in public. But it is hard to take seriously the notion that Governor Walz or Mayor Frey could have avoided this operation, or could even end it now, by agreeing to assist ICE. In fact, despite the administration’s characterization of Minnesota as a “sanctuary” jurisdiction, the state already has a law requiring officials to notify ICE when noncitizens with felony convictions are released, and plenty of Minnesota counties voluntarily hold noncitizens in custody at ICE’s request.
In my view, the Trump administration did not choose Minnesota or Minneapolis as a target because it wanted to “commandeer” their participation in the federal immigration enforcement scheme. Rather, it wanted to punish them not only for their pre-existing immigration policy choices, but also for unrelated political reasons: for example, because the state’s governor was Kamala Harris’s running mate, or because the city is home to a large population of Somali Americans and was the site of George Floyd’s murder. As President Trump helpfully clarified, Operation Metro Surge was meant as a “DAY OF RECKONING & RETRIBUTION” for members of a political community cast as the administration’s political enemies.
Federalism by extortion is a flexible and opportunistic mode of governance. Clearly, the administration is happy to see some local governments—such as Louisville, Baltimore, or Memphis—cave to its pressure tactics and cooperate with its aims. But practitioners of federalism by extortion do not simply target jurisdictions they believe might be unable to refuse their offers. They also go after places they expect to refuse those offers, since this provides an opportunity to demonstrate the administration’s resolve to dole out punishment. By pursuing either of these two aims (i.e. seeking concessions or publicly imposing punishments), the administration also works towards a third, which is to change the cost-benefit calculus for jurisdictions that are not direct targets. All state and local government leaders now have to account for the possibility that they might be next, and weigh the risk of punishment against the rewards of compliance.
None of this is to say that constitutional federalism protections should not apply to something like Operation Metro Surge. Courts could very well take at face value Bondi and Homan’s surface-level attempts to compel immigration cooperation using the threat of an ICE invasion. Judge Menendez certainly left herself room to conclude that this is unconstitutional commandeering—though only at a later date, after DHS may have already ended the operation of its own accord.
The point is that existing doctrine may not be up to the task of restraining the Trump administration’s federalism by extortion. This doctrine may have worked given the assumption of a federal government that is interested in building a coherent regulatory program, setting the terms on which it can seek states’ participation. A world in which federal power seeks to subjugate state and local governments as political enemies requires a new constitutional theory of federalism—if this is a world where constitutional constraints apply at all.
While a substantial number of members of the House of Representatives are retiring, don’t expect these retirements to produce many flipped seats or shifts in the ideological makeup of either party.
As of January 13, 47 members of the House have announced their retirement, 21 Democrats and 26 Republicans. (I’m not counting resignations by Majorie Taylor Greene and Mikie Sherrill whose seats will be filled with special elections this year.)
The retirement rate has been running a bit ahead of recent cycles as of this date, which were 42, 34, 41, and 40 from 2018 to 2024. Still, I don’t think we are seeing extraordinarily high levels of retirements, as some commentary suggests. In the end those previous four cycles produced totals of 52, 36, 49 and 45 retirements, suggesting we may end up in the mid-to-upper 50s this year. Past retirements are from Ballotpedia.org.
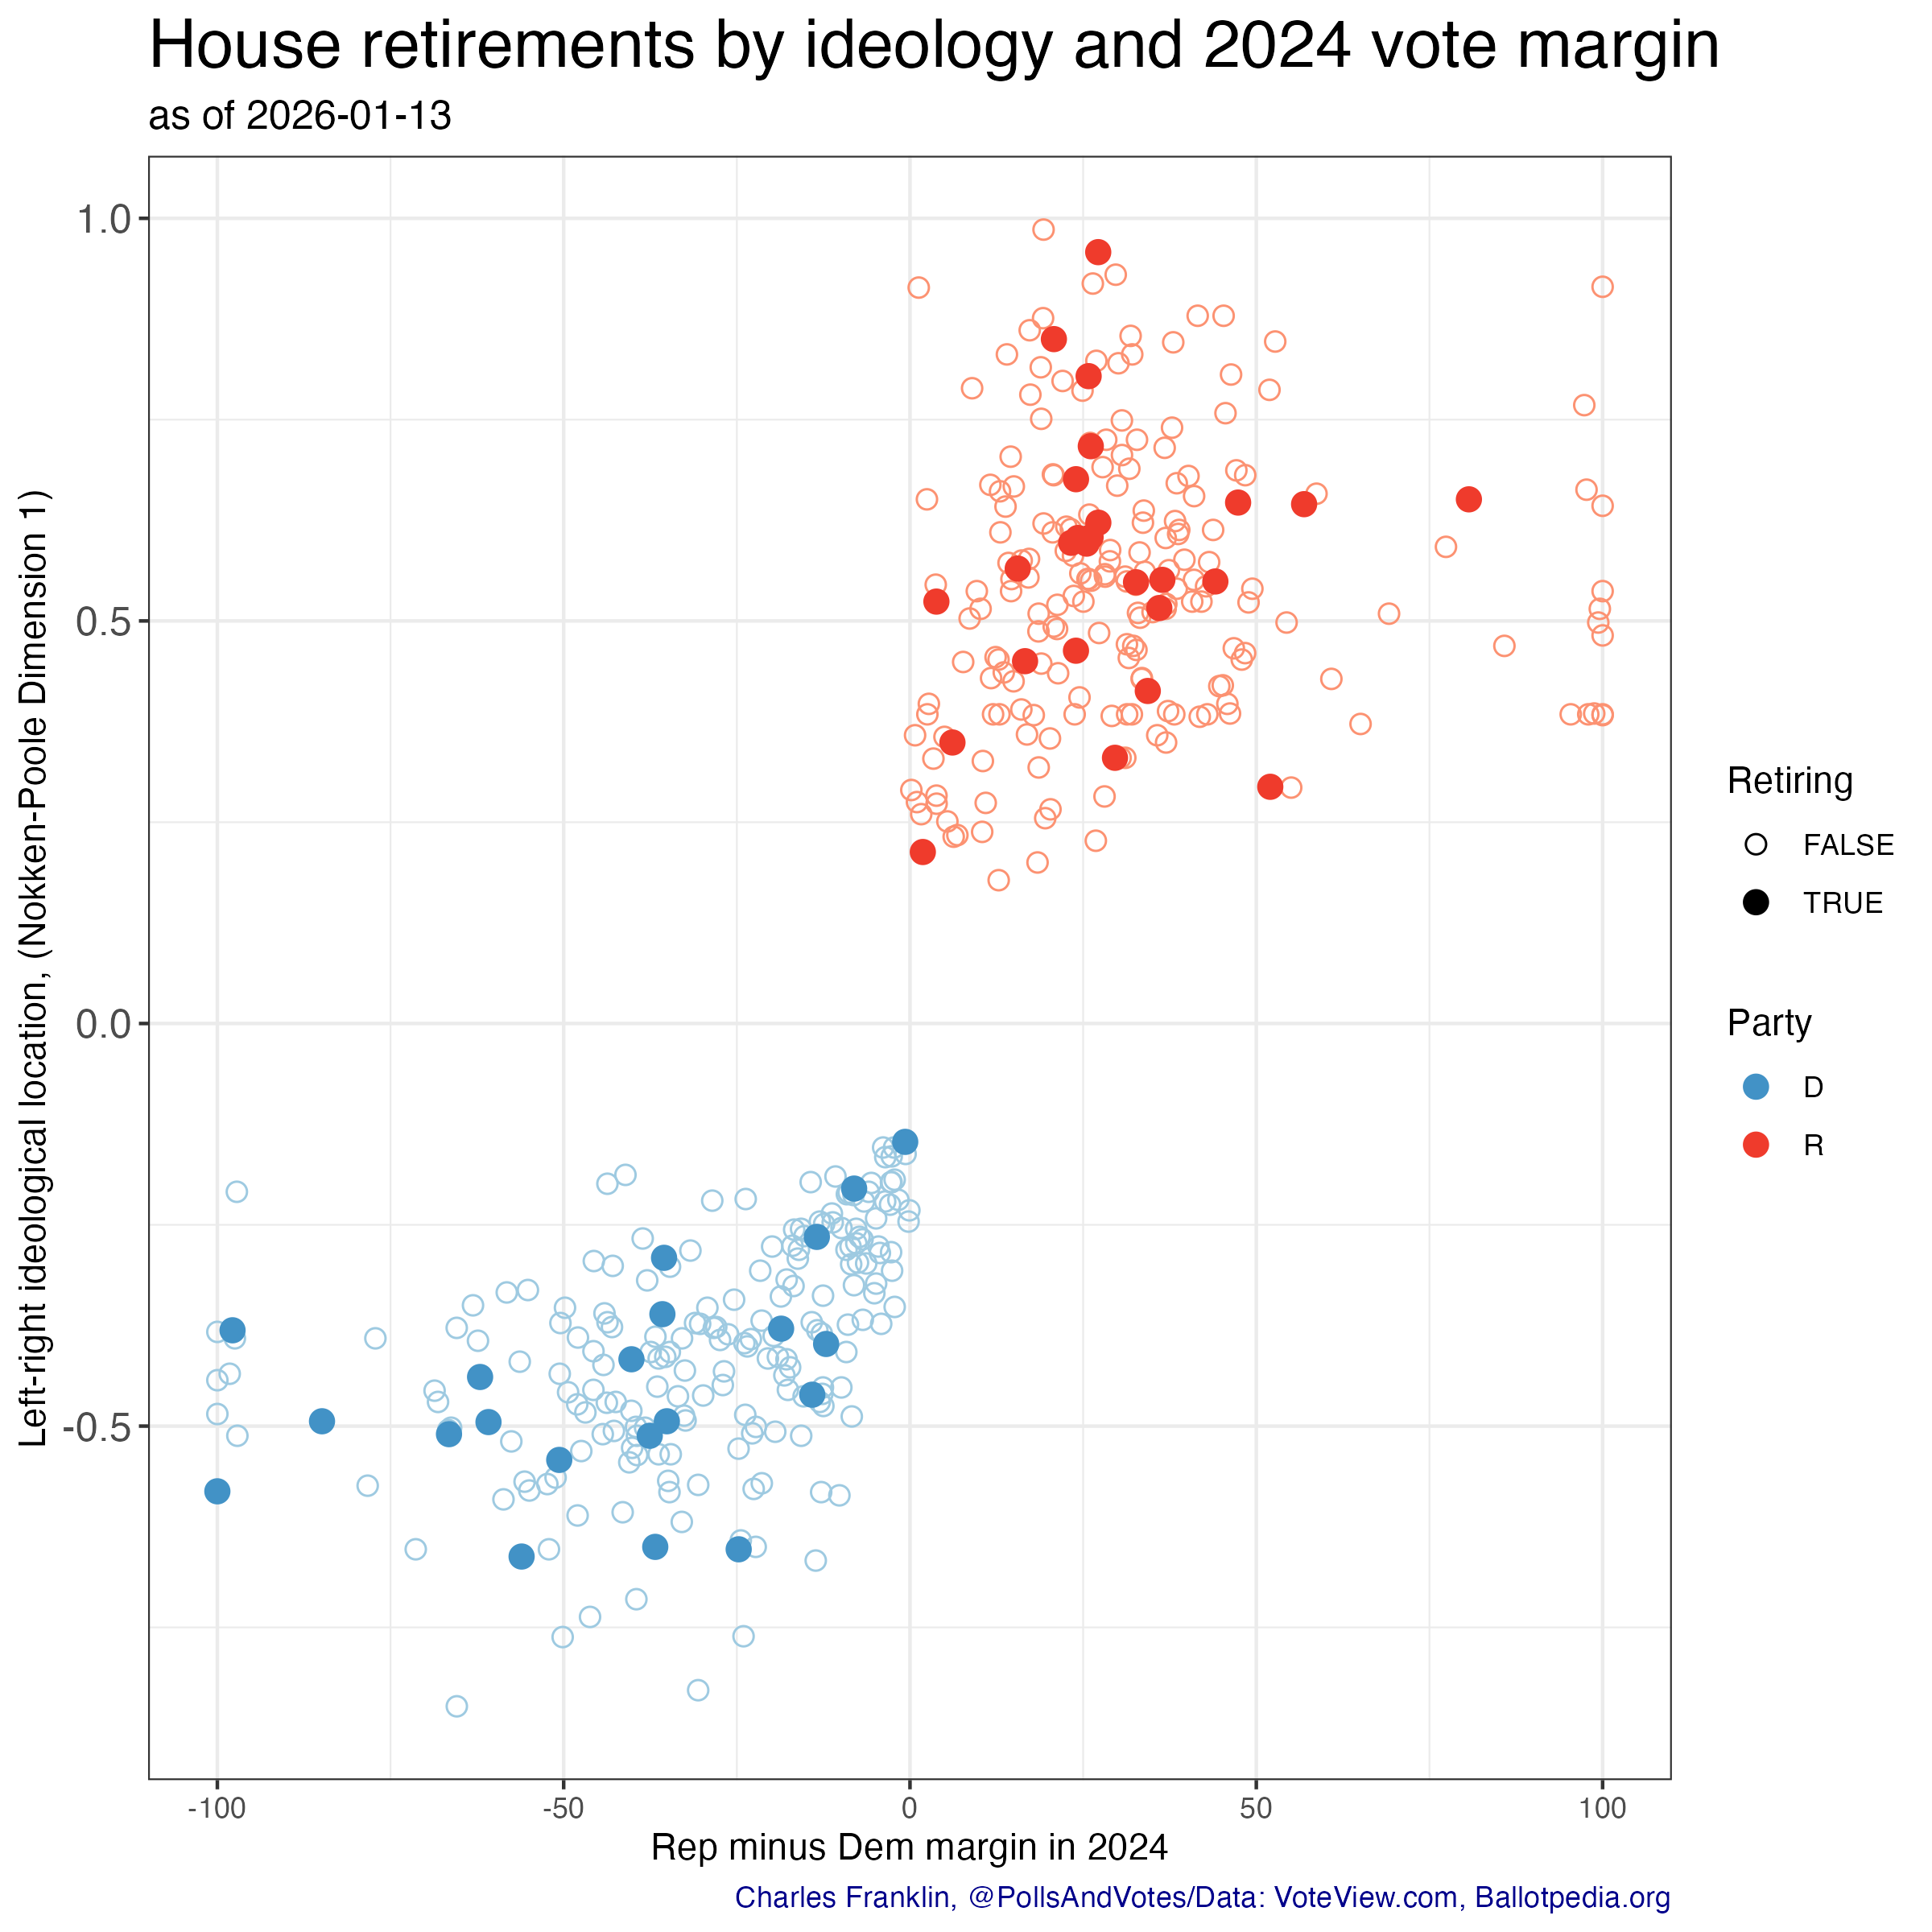
The main point I want to make here is that the retirements are spread pretty widely throughout both Republican and Democratic caucuses by ideology and 2024 vote margin. The solid dots are retiring members. These are not endangered incumbents who barely scraped by in 2024, nor are they ideological outliers relative to their caucuses.
The figure shows all House members by vote margin and by left-right ideology, using Nokken-Poole dimension 1 ideology scores from VoteView.com. These scores are based on roll call votes by the members. Nokken-Poole is a variant of the widely used Nominate scores. Nokken-Poole scores range from -0.848 for the most liberal member to 0.986 for the most conservative member. Vote margin is the percentage for the Republican candidate minus the percentage for the Democrat, so negative margins are Democratic wins and positive ones are Republican victories.
Among Republicans, the median 2024 vote margin is 28.2 percentage points, and the median for retiring Republicans is 26.1 points. On ideology, the median Nokken-Poole score is 0.542 (higher scores are more conservative.) Among retiring Republicans the median is 0.581
Democratic retirees have somewhat larger vote margins, -36.8 percentage points, than their caucus as a whole, -27.0 points. On ideology, the retiring Democrats are also more liberal, -0.461, than the full Democratic caucus, -0.394. These are modest differences, however, and the figure makes clear retirements are well scattered throughout both caucuses.
The upshot of this distribution of retirements is that it does not open up many opportunities for turnover as most retirees enjoyed reasonably secure margins in 2024. Nor are retirements likely to significantly shift the ideological balance in the House given that retirees are ideologically pretty representative of their caucuses. While open races are less predictable than incumbent ones, the strong partisan lean of most of these districts means we should expect no more than a handful of these seats to potentially flip.
DCCC and NRCC target districts
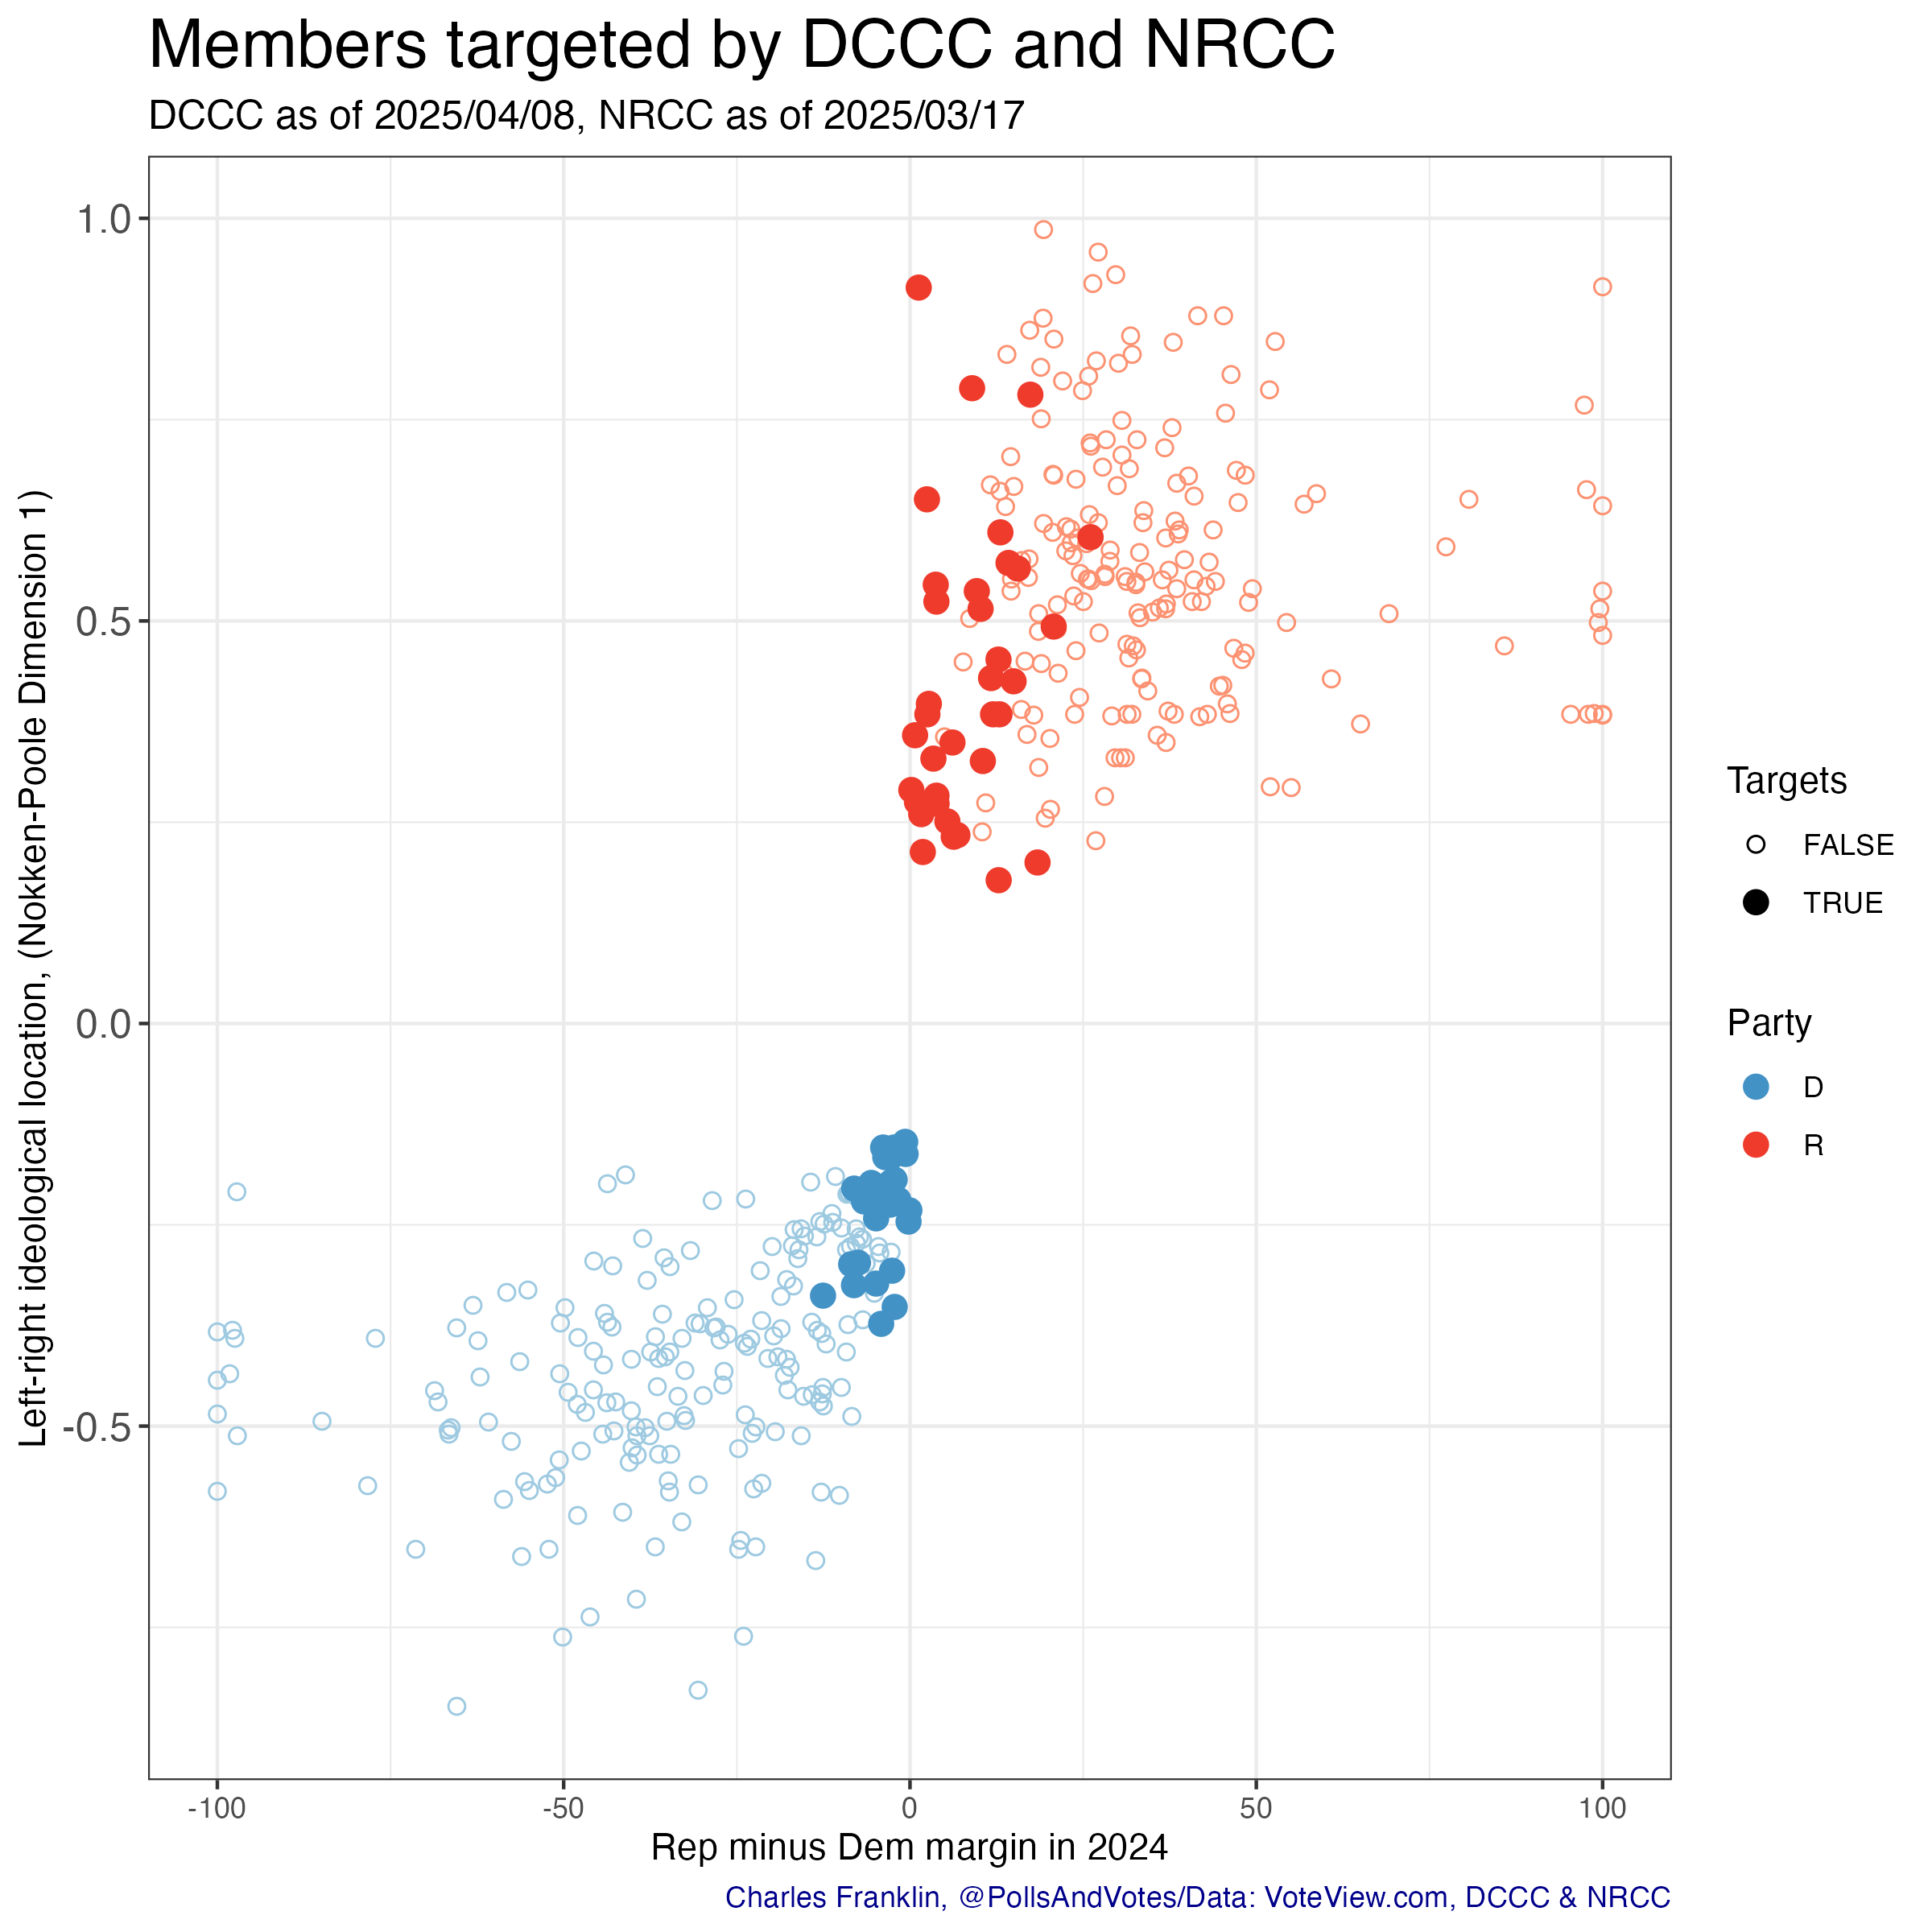
Both the Democratic Congressional Campaign Committe (DCCC) and the National Republican Congressional Committee (NRCC) have released lists of districts being targeted as pick up opportunities. Compare this figure with the retirements above. The targeted districts are, as you would expect, far more concentrated in races that were narrowly decided in 2024. (These lists were released by the NRCC on March 17, and by the DCCC on April 8. They do not include changes or additions after some states redistricted in 2025. These are the members’ districts in the 119th congress.)
Republicans on the DCCC list have a median vote margin of 6.8 percentage points, much closer than the caucus median of 28.2 points. They are also less conservative, 0.384, than the full caucus, 0.542.
Democrats on the NRCC list also had much closer 2024 races, with a median of -3.2 percentage points compared to -27.0 for the full caucus. These Democrats are also less liberal than the caucus, with a median Nokken-Poole score of -0.221 compared to the caucus median of -0.394.
If you are looking for change in the House, look at the districts each of the parties are focusing on. They have a much greater chance of flipping than the seats of retiring members, and would be more likely to remove relatively moderate members of either party. The latter fact will also contribute to polarization in the House. Rather than target ideologically extreme members of the opposition party, both Democats and Republicans target close races, which also happen to be where the most relatively moderate members are.