New Marquette Law School Poll national survey finds approval of U.S. Supreme Court falls to 39%, second lowest since 2020
Majority of public opposes presidential immunity, but Republican majority supports it when Trump is mentioned in question; partisan differences are substantial over restricting abortion-drug use, banning sleeping in public
MILWAUKEE – A new Marquette Law School Poll national survey finds that 39% of adults approve of the job the U.S. Supreme Court is doing, while 61% disapprove. This is the lowest approval of the Court since July 2022, when 38% approved and 61% disapproved. Approval has fluctuated in the low to mid 40% range since March 2023, with the exception of March 2024 when approval was at 47%.
Approval of the Court fell from 66% in September 2020 and 60% in July 2021 to the mid-50% range later in 2021 and early 2022. It fell again, to 38%, in July 2022 following the Dobbs v. Jackson Women’s Health Organization decision overturning the 1973 Roe v. Wade decision that had made abortion legal nationwide. Since then, until this month’s survey, approval has fluctuated between 40% and 47%. The trend in approval since 2020 is shown in Figure 1 and Table 1. (All results in the tables are stated as percentages; the precise wording of the questions can be found in the online link noted above.)
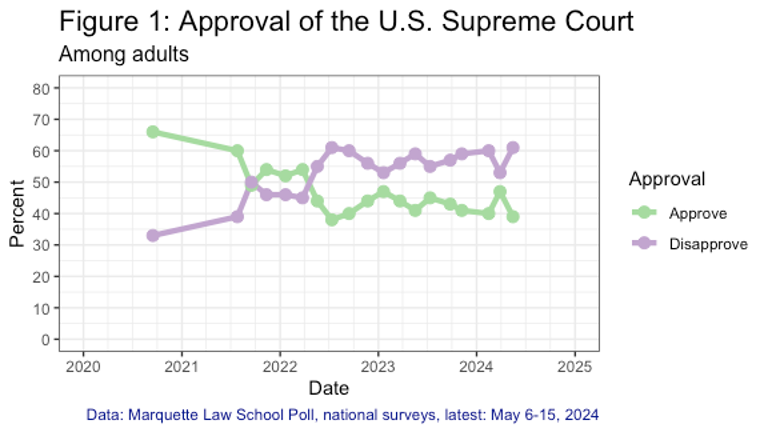
Table 1: U.S. Supreme Court approval
Among adults
| Poll dates | Approval | |
| Approve | Disapprove | |
| 5/6-15/24 | 39 | 61 |
| 3/18-28/24 | 47 | 53 |
| 2/5-15/24 | 40 | 60 |
| 11/2-7/23 | 41 | 59 |
| 9/18-25/23 | 43 | 57 |
| 7/7-12/23 | 45 | 55 |
| 5/8-18/23 | 41 | 59 |
| 3/13-22/23 | 44 | 56 |
| 1/9-20/23 | 47 | 53 |
| 11/15-22/22 | 44 | 56 |
| 9/7-14/22 | 40 | 60 |
| 7/5-12/22 | 38 | 61 |
| 5/9-19/22 | 44 | 55 |
| 3/14-24/22 | 54 | 45 |
| 1/10-21/22 | 52 | 46 |
| 11/1-10/21 | 54 | 46 |
| 9/7-16/21 | 49 | 50 |
| 7/16-26/21 | 60 | 39 |
| 9/8-15/20 | 66 | 33 |
| Marquette Law School Poll, national surveys, latest: May 6-15, 2024 | ||
| Question: Overall, how much do you approve or disapprove of the way the U.S. Supreme Court is handling its job? | ||
The latest Marquette Law School Poll national Supreme Court survey was conducted May 6-15, 2024. The survey interviewed 1,033 adults nationwide and has a margin of error of +/-4.3 percentage points.
Approval of the Court fell in May across all categories of partisanship, declining 7 percentage points among Republicans, 12 points among independents, and 8 points among Democrats. Approval by party over the last three polls is shown in Table 2. (Party identification, here and subsequently, includes independents who lean to a party)
Table 2: Approval of the U.S Supreme Court, by party identification, February, March, and May 2024
Among adults
| Party ID | Court approval | |
| Approve | Disapprove | |
| 5/6-15/24 | ||
| Republican | 57 | 43 |
| Independent | 26 | 74 |
| Democrat | 23 | 77 |
| 3/18-28/24 | ||
| Republican | 64 | 36 |
| Independent | 38 | 62 |
| Democrat | 31 | 69 |
| 2/5-15/24 | ||
| Republican | 57 | 43 |
| Independent | 28 | 72 |
| Democrat | 27 | 73 |
| Marquette Law School Poll, national surveys, Feb. 5-15, 2024, March 18-28, 2024, and May 6-15, 2024 | ||
| Question: Overall, how much do you approve or disapprove of the way the U.S. Supreme Court is handling its job? | ||
Cases before the Court
One case pending before the Court is Trump v. United States, concerning presidential immunity from criminal prosecution. The case was argued on April 25.
To understand how former President Donald Trump’s involvement affects views of presidential immunity, the poll asked a random half of the sample if “former presidents” should have immunity and the other half if “former President Donald Trump” should have immunity. Of those thus asked, 16% said “former presidents” should have immunity, while 71% said they should not. Of those asked about “former President Donald Trump,” 30% said he should have immunity, while 60% said he should not. The effect of mentioning Trump almost doubles support for immunity—increasing it by 14 percentage points, a larger effect than the 8-percentage-point effect found in March before the case was argued.
These results are shown in Table 3.
Table 3: Presidential immunity, by question wording
Among adults
| Question wording | Immunity opinion | ||
| Should be immune from criminal prosecution for their official acts | Should not have immunity from criminal prosecution for their official acts | Don’t know | |
| 5/6-15/24 | |||
| Former presidents wording | 16 | 71 | 13 |
| Former President Donald Trump wording | 30 | 60 | 10 |
| 3/18-28/24 | |||
| Former presidents wording | 20 | 62 | 18 |
| Former President Donald Trump wording | 28 | 56 | 17 |
| Marquette Law School Poll, national survey, March 18-28, 2024, and May 6-15, 2024 | |||
| Question: The U.S. Supreme Court is considering a case concerning whether former presidents have immunity from criminal prosecution for official actions while in office. Which comes closer to your view? | |||
| Question: The U.S. Supreme Court is considering a case concerning whether former President Donald Trump has immunity from criminal prosecution for official actions while president. Which comes closer to your view? | |||
The shift in responses largely comes from Republicans. When asked about “former presidents,” only 29% support immunity, but when asked about “former President Donald Trump,” support soars to 61%. Support for immunity also increases among independents, from 4% to 20%, when Trump is named. Democrats do not change support for immunity when Trump is mentioned, although the percent opposed declines slightly and the percent of those saying they don’t know increases. The full results are shown in Table 4.
Table 4: Presidential immunity, by question wording and party identification
Among adults
| Party ID | Immunity opinion | ||
| Should be immune from criminal prosecution for their official acts | Should not have immunity from criminal prosecution for their official acts | Don’t know | |
| Former presidents wording | |||
| Republican | 29 | 48 | 22 |
| Independent | 4 | 75 | 21 |
| Democrat | 5 | 95 | 1 |
| Former President Donald Trump wording | |||
| Republican | 61 | 29 | 10 |
| Independent | 20 | 47 | 33 |
| Democrat | 5 | 88 | 7 |
| Marquette Law School Poll, national survey, May 6-15, 2024 | |||
| Question: The U.S. Supreme Court is considering a case concerning whether former presidents have immunity from criminal prosecution for official actions while in office. Which comes closer to your view? | |||
| Question: The U.S. Supreme Court is considering a case concerning whether former President Donald Trump has immunity from criminal prosecution for official actions while president. Which comes closer to your view? | |||
On April 22, the Court heard arguments in City of Grants Pass, Oregon v. Johnson, concerning whether the U.S. Constitution—the Eighth Amendment’s prohibition of “cruel and unusual punishment”—prohibits cities from banning homeless people camping on public property,
The survey found 47% said cities should be able to ban sleeping in public places, 36% said cities should not be able to do so, and 18% didn’t know.
Partisan differences are apparent in this case, with 63% of Republicans saying cities should be allowed to ban public sleeping, while 27% of independents and 35% of Democrats agree. The full results are shown in Table 5.
Table 5: Can cities ban sleeping in public spaces, by party identification
Among adults
| Party ID | Preference | ||
| Cities can ban sleeping in public spaces | Cities cannot ban sleeping in public spaces | Don’t know | |
| Total | 47 | 36 | 18 |
| Republican | 63 | 18 | 19 |
| Independent | 27 | 43 | 30 |
| Democrat | 35 | 50 | 15 |
| Marquette Law School Poll, national survey, May 6-15, 2024 | |||
| Question: The U.S. Supreme Court is considering a case concerning whether cities can, without violating the Constitution, ban homeless people from sleeping or camping in public spaces. Which comes closer to your view? | |||
| Response option: Cities can ban sleeping in public spaces | |||
| Response option: Cities cannot ban sleeping in public spaces | |||
There are also divisions by age on this topic. Those under 30 are opposed to cities banning sleeping in public spaces, while those who are older favor the permissibility of such bans, as shown in Table 6.
Table 6: Can cities ban sleeping in public spaces, by age
Among adults
| Age | Preference | ||
| Cities can ban sleeping in public spaces | Cities cannot ban sleeping in public spaces | Don’t know | |
| Total | 47 | 36 | 18 |
| 18-29 | 23 | 58 | 19 |
| 30-44 | 48 | 39 | 13 |
| 45-59 | 48 | 29 | 22 |
| 60+ | 59 | 23 | 18 |
| Marquette Law School Poll, national survey, May 6-15, 2024 | |||
| Question: The U.S. Supreme Court is considering a case concerning whether cities can, without violating the Constitution, ban homeless people from sleeping or camping in public spaces. Which comes closer to your view? | |||
| Response option: Cities can ban sleeping in public spaces | |||
| Response option: Cities cannot ban sleeping in public spaces | |||
On March 26, the Court heard oral arguments in Food and Drug Administration v. Alliance for Hippocratic Medicine, concerning a lower court decision which would restrict access to mifepristone, a drug used in medication abortions. Among those polled, 57% said the Court should keep the current level of access to the drug by overturning the lower court ruling, while 27% said the Court should uphold the lower court ruling that increased restrictions on the use of mifepristone. The remaining 17% said they don’t know. These opinions have hardly shifted since March, when 60% said the Court should keep the current access. The two poll results are shown in Table 7.
Table 7: Opinion on abortion medication mifepristone
Among adults
| Poll dates | Preference | ||
| The Court should rule to keep the current access to the medication abortion drug, thus overturning the lower court decision | The Court should rule that the lower court was correct in its decision, thus restricting access to the medication abortion drug | Don’t know | |
| 5/6-15/24 | 57 | 27 | 17 |
| 3/18-28/24 | 60 | 25 | 15 |
| Marquette Law School Poll, national surveys, latest: May 6-15, 2024 | |||
| Question: The U.S. Supreme Court is reviewing a lower court decision that would significantly restrict (but not eliminate altogether) access to a drug used in medication abortions, mifepristone. Which comes closer to your view? | |||
Views on this issue differ by party, as shown in Table 8. A plurality of Republicans, 45%, favor upholding restrictions on access to mifepristone, while 37% say the Court should overturn the restrictions found by a lower court. A smaller plurality of independents favor overturning the restrictions, but almost as many say they don’t know. A large majority of Democrats, 79%, say the Court should strike down the restrictions.
Table 8: Restrict access to mifepristone, by party identification
Among adults
| Party ID | Preference | ||
| The Court should rule to keep the current access to the medication abortion drug, thus overturning the lower court decision | The Court should rule that the lower court was correct in its decision, thus restricting access to the medication abortion drug | Don’t know | |
| Total | 57 | 27 | 17 |
| Republican | 37 | 45 | 18 |
| Independent | 37 | 29 | 35 |
| Democrat | 79 | 8 | 12 |
| Marquette Law School Poll, national survey, May 6-15, 2024 | |||
| Question: The U.S. Supreme Court is reviewing a lower court decision that would significantly restrict (but not eliminate altogether) access to a drug used in medication abortions, mifepristone. Which comes closer to your view? | |||
| Response option: The Court should rule to keep the current access to the medication abortion drug, thus overturning the lower court decision | |||
| Response option: The Court should rule that the lower court was correct in its decision, thus restricting access to the medication abortion drug. | |||
On Feb. 26, the Court heard arguments in two cases, NetChoice, LLC v. Paxton and Moody v. NetChoice, LLC, dealing with how much social media companies can control the content of user postings on their sites, as well as the extent to which governments can regulate those decisions. We asked the question:
“The U.S. Supreme Court is considering a case concerning laws that regulate how large social media companies like Facebook and YouTube control content posted on their sites. Which comes closer to your view? 1. The Court should rule that the companies have a First Amendment right to make decisions about what content may be presented on their sites. 2. The Court should rule that the companies cannot decide what views users may express on the sites. 3. Don’t know.”
A plurality, 47%, say social media companies have a right to make decisions regarding content on their sites, while 35% say they should not be able to restrict content and 18% say they don’t know. These results are nearly identical to those in the March survey, as shown in Table 9.
Table 9: Opinion on social media regulation
Among adults
| Poll dates | Preference | ||
| Companies can control content | Companies cannot control content | Don’t know | |
| 5/6-15/24 | 47 | 35 | 18 |
| 3/18-28/24 | 46 | 38 | 16 |
| Marquette Law School Poll, national surveys, latest: May 6-15, 2024 | |||
| Question: The U.S. Supreme Court is considering a case concerning laws that regulate how large social media companies like Facebook and YouTube control content posted on their sites. Which comes closer to your view? | |||
| Response option: The Court should rule that the companies have a First Amendment right to make decisions about what content may be presented on their sites. | |||
| Response option: The Court should rule that the companies cannot decide what views users may express on the sites. | |||
Opinion on social media restrictions varies by political ideology, with conservatives more opposed to control by social media companies over content and liberals more in favor, as shown in Table 10.
Table 10: Social media restrictions, by political ideology
Among adults
| Preference | |||
| Political ideology | Companies can control content | Companies cannot control content | Don’t know |
| Total | 47 | 35 | 18 |
| Conservative | 38 | 48 | 14 |
| Moderate | 47 | 35 | 18 |
| Liberal | 59 | 18 | 22 |
| Marquette Law School Poll, national survey, May 6-15, 2024 | |||
| Question: The U.S. Supreme Court is considering a case concerning laws that regulate how large social media companies like Facebook and YouTube control content posted on their sites. Which comes closer to your view? | |||
| Response option: The Court should rule that the companies have a First Amendment right to make decisions about what content may be presented on their sites. | |||
| Response option: The Court should rule that the companies cannot decide what views users may express on the sites. | |||
Those who are the heaviest users of the internet, saying they are “almost constantly” online, are more supportive of the ability of social media companies to impose restrictions and less likely to say they don’t know. Those who use the internet less often are less in favor of such an ability but also more likely to lack an opinion. These results are shown in Table 11.
Table 11: Social media restrictions, by internet use
Among adults
| Internet use | Preference | ||
| Companies can control content | Companies cannot control content | Don’t know | |
| Total | 47 | 35 | 18 |
| Almost constantly | 53 | 33 | 14 |
| Several times a day | 47 | 34 | 19 |
| Once a day or less | 23 | 50 | 27 |
| Marquette Law School Poll, national survey, May 6-15, 2024 | |||
| Question: The U.S. Supreme Court is considering a case concerning laws that regulate how large social media companies like Facebook and YouTube control content posted on their sites. Which comes closer to your view? | |||
| Response option: The Court should rule that the companies have a First Amendment right to make decisions about what content may be presented on their sites. | |||
| Response option: The Court should rule that the companies cannot decide what views users may express on the sites. | |||
On Nov. 7, the Court heard arguments in United States v. Rahimi on whether a federal law that prohibits the possession of a firearm by persons subject to domestic violence restraining orders violates the Second Amendment right to keep and bear arms.
The question was worded as follows:
“The U.S. Supreme Court is considering a case concerning the constitutionality of a federal law that prohibits people subject to domestic violence restraining orders from possessing firearms. Which comes closer to your view? 1. The Court should uphold the law prohibiting gun possession by those subject to restraining orders. 2. the Court should strike down the law as a violation of the Second Amendment right to bear arms. .3. Don’t know”
A substantial majority, 75%, say the Court should uphold the federal law, while 16% say the Court should strike down the law in favor of the right to bear arms and 9% say they don’t know. Opinion is little changed from March, as shown in Table 12.
Table 12: Opinion on gun possession by someone under restraining order
Among adults
| Poll dates | Preference | ||
| Uphold law prohibiting firearm possession | Strike down law prohibiting firearm possession | Don’t know | |
| 5/6-15/24 | 75 | 16 | 9 |
| 3/18-28/24 | 72 | 17 | 11 |
| Marquette Law School Poll, national surveys, latest: May 6-15, 2024 | |||
| Question: The U.S. Supreme Court is considering a case concerning the constitutionality of a federal law that prohibits people subject to domestic violence restraining orders from possessing firearms. Which comes closer to your view? | |||
| Response option: The Court should uphold the law prohibiting gun possession by those subject to restraining orders. | |||
| Response option: The Court should strike down the law as a violation of the Second Amendment right to bear arms. | |||
On this issue, 64% of Republicans and 59% of independents say the Court should uphold the law, as do 89% of Democrats, as shown in Table 13.
Table 13: Law prohibiting firearm possession, by party identification
Among adults
| Party ID | Preference | ||
| Uphold law prohibiting firearm possession | Strike down law prohibiting firearm possession | Don’t know | |
| Total | 75 | 16 | 9 |
| Republican | 64 | 26 | 10 |
| Independent | 59 | 18 | 23 |
| Democrat | 89 | 6 | 5 |
| Marquette Law School Poll, national survey, May 6-15, 2024 | |||
| Question: The U.S. Supreme Court is considering a case concerning the constitutionality of a federal law that prohibits people subject to domestic violence restraining orders from possessing firearms. Which comes closer to your view? | |||
| Response option: The Court should uphold the law prohibiting gun possession by those subject to restraining orders. | |||
| Response option: The Court should strike down the law as a violation of the Second Amendment right to bear arms. | |||
Opinions also differ by gender and by gun ownership. Among men, 73% say the Court should uphold the prohibition of firearm possession, while 78% of women say so. There is a larger difference between gun owners, 67% of whom say possession can be prohibited, and those not owning guns, 80% of whom say the same.
Knowledge and news about the Court
The Court has had a majority of justices appointed by Republican presidents for 54 years, since 1970 (with the exception of a 14 month vacancy in 2016-17 which created a 4-4 tie), and the current Court has six justices appointed by Republicans and three appointed by Democrats. Nonetheless, 28% of adults believe a majority of justices were definitely or probably appointed by Democratic presidents. Forty percent say that a majority were probably appointed by Republican presidents, and 33% that a majority were definitely appointed by Republicans. This opinion has varied modestly since 2019, as shown in Table 14.
Table 14: Majority of Court appointed by which party’s presidents
Among adults
| Poll dates | Majority appointed by | ||
| Definitely/Probably Dem majority | Probably Rep majority | Definitely Rep majority | |
| 5/6-15/24 | 28 | 40 | 33 |
| 3/18-28/24 | 25 | 43 | 32 |
| 2/5-15/24 | 29 | 38 | 33 |
| 11/2-7/23 | 26 | 43 | 30 |
| 9/18-25/23 | 26 | 42 | 32 |
| 7/7-12/23 | 22 | 42 | 36 |
| 5/8-18/23 | 29 | 41 | 30 |
| 3/13-22/23 | 27 | 41 | 31 |
| 1/9-20/23 | 23 | 41 | 36 |
| 11/15-22/22 | 24 | 40 | 35 |
| 9/7-14/22 | 22 | 40 | 37 |
| 7/5-12/22 | 20 | 40 | 40 |
| 5/9-19/22 | 31 | 39 | 31 |
| 3/14-24/22 | 28 | 47 | 24 |
| 1/10-21/22 | 23 | 44 | 33 |
| 11/1-10/21 | 28 | 44 | 28 |
| 9/7-16/21 | 25 | 46 | 29 |
| 7/16-26/21 | 24 | 45 | 30 |
| 9/8-15/20 | 28 | 51 | 21 |
| 9/3-13/19 | 27 | 53 | 19 |
| Marquette Law School Poll, national surveys, latest: May 6-15, 2024 | |||
| Question: What is your guess as to whether a majority of the current U.S. Supreme Court justices were appointed by Democratic or Republican presidents? | |||
Knowledge of which party’s presidents have appointed a majority of the Court varies by party, with 23% of Republicans correctly saying there is definitely a majority appointed by Republicans but nearly twice that percentage of Democrats, 44%, saying so. Likewise, 37% of Republicans say a majority were definitely or probably appointed by Democrats, whereas only 18% of Democrats believe this. The full results are shown in Table 15.
Table 15: Answers on majority of Court appointed by which party’s presidents, by party identification
Among adults
| Party ID | Majority appointed by | ||
| Definitely/Probably Dem majority | Probably Rep majority | Definitely Rep majority | |
| Total | 28 | 40 | 33 |
| Republican | 37 | 40 | 23 |
| Independent | 31 | 47 | 22 |
| Democrat | 18 | 37 | 44 |
| Marquette Law School Poll, national survey, May 6-15, 2024 | |||
| Question: What is your guess as to whether a majority of the current U.S. Supreme Court justices were appointed by Democratic or Republican presidents? | |||
Approval of the Court varies with party and knowledge about the Court, but in opposite directions. Among both Republicans and Democrats, approval breaks as knowledge of the makeup of the Court increases: Republican approval increases and Democratic approval decreases. This striking pattern is shown in Table 16.
Table 16: Approval of the Court, by knowledge of appointed majority and by party identification
Among adults
| Majority appointed by | Approval | |
| Approve | Disapprove | |
| (Republican respondents) | ||
| Definitely/Probably Dem majority | 32 | 68 |
| Probably Rep majority | 67 | 33 |
| Definitely Rep majority | 79 | 21 |
| (Independent respondents) | ||
| Definitely/Probably Dem majority | 31 | 69 |
| Probably Rep majority | 32 | 68 |
| Definitely Rep majority | 5 | 95 |
| (Democrat respondents) | ||
| Definitely/Probably Dem majority | 53 | 47 |
| Probably Rep majority | 26 | 74 |
| Definitely Rep majority | 9 | 91 |
| Marquette Law School Poll, national survey, May 6-15, 2024 | ||
| Question: Overall, how much do you approve or disapprove of the way the U.S. Supreme Court is handling its job? | ||
| Question: What is your guess as to whether a majority of the current U.S. Supreme Court justices were appointed by Democratic or Republican presidents? | ||
Basis of the justices’ decisions
In May, 56% say the justices’ decisions are motivated mainly by politics, and 44% say decisions are based mainly on the law. In September 2019, 35% said mainly politics and 64% said mainly the law. The increased perception of political motivation began in January 2022 with a dramatic 17-percentage-point shift. The full trend is shown in Table 17.
Table 17: Are justices’ decisions motivated mainly by the law or mainly by politics
Among adults
| Poll dates | Perceived motivation | |
| Mainly politics | Mainly the law | |
| 5/6-15/24 | 56 | 44 |
| 3/18-28/24 | 50 | 50 |
| 2/5-15/24 | 54 | 46 |
| 11/2-7/23 | 55 | 45 |
| 9/18-25/23 | 52 | 48 |
| 7/7-12/23 | 58 | 42 |
| 1/9-20/23 | 49 | 51 |
| 7/5-12/22 | 52 | 48 |
| 1/10-21/22 | 47 | 53 |
| 11/1-10/21 | 30 | 70 |
| 9/7-16/21 | 39 | 61 |
| 7/16-26/21 | 29 | 71 |
| 9/8-15/20 | 37 | 62 |
| 9/3-13/19 | 35 | 64 |
| Marquette Law School Poll, national surveys, latest: May 6-15, 2024 | ||
| Question: In general, what most often motivates Supreme Court justices’ decisions? | ||
Among Republicans, 60% say the justices’ decisions are based mainly on the law, while 67% of independents and 68% of Democrats say decisions are mainly based on politics. Table 18 shows these results.
Table 18: Justices’ decisions based mainly on law or politics
Among adults
| Party ID | Basis of decisions | |
| Mainly politics | Mainly the law | |
| Total | 56 | 44 |
| Republican | 40 | 60 |
| Independent | 67 | 33 |
| Democrat | 68 | 32 |
| Marquette Law School Poll, national survey, May 6-15, 2024 | ||
| Question: In general, what most often motivates Supreme Court justices’ decisions? | ||
Attention to news about the Court
Table 19 shows the trend in attention to news about the Court from September 2023 to May 2024. Few respondents had heard a lot about the Court “in the past month” in either September or November, but there has been some increase since, even though the percent hearing a lot declined slightly from March to May. With major decisions to come by the expected end of the term in late June, awareness of news about the Court is likely to increase.
Table 19: Attention to news about the Court
Among adults
| Poll dates | How much heard or read | ||
| A lot | A little | Nothing at all | |
| 5/6-15/24 | 27 | 52 | 21 |
| 3/18-28/24 | 30 | 50 | 19 |
| 2/5-15/24 | 24 | 56 | 20 |
| 11/2-7/23 | 15 | 60 | 25 |
| 9/18-25/23 | 17 | 61 | 22 |
| Marquette Law School Poll, national surveys, latest: May 6-15, 2024 | |||
| Question: Thinking about the last month only, how much have you heard or read about the U.S. Supreme Court? | |||
Confidence in institutions
Confidence in several institutions is summarized in Table 20. Juries in criminal cases enjoy the highest confidence of the five institutions and the lowest percentage drawing little or no confidence. Each of the other institutions has more respondents expressing little or no confidence than expressing a great deal or quite a lot of confidence. The U.S. Supreme Court has the second highest level of confidence, followed very closely by the U.S. Department of Justice and the presidency, with some differences in those saying little or no confidence. Congress suffers the lowest confidence rating, with 11% expressing a great deal or a lot of confidence and 53% saying they have little or no confidence in Congress.
Table 20: Confidence in institutions
Among adults
| Institution | Confidence | ||
| Great deal/a lot | Some | Little/None | |
| Juries that decide criminal cases | 35 | 41 | 24 |
| U.S. Supreme Court | 24 | 37 | 40 |
| The U.S. Department of Justice | 23 | 39 | 38 |
| The Presidency | 23 | 31 | 46 |
| Congress | 11 | 36 | 53 |
| Marquette Law School Poll, national survey, May 6-15, 2024 | |||
| Question: Here is a list of institutions in American society. How much confidence do you have in each one? | |||
Perceived ideological leaning of the Court
In May, 25% say they would describe the Supreme Court as “very conservative,” 32% would describe it as “somewhat conservative,” and 31% would call the Court “moderate,” while 10% see the Court as “somewhat liberal” and 2% believe it is “very liberal.”
Views of the Court have shifted to the right since 2019, as shown in Table 21, with fewer seeing the Court as moderate. Perception of the Court as very conservative peaked in July 2022.
Table 21: Perceived ideological leaning of the Court, 2019-2024
Among adults
| Poll dates | Perceived ideology | ||||
| Very conservative | Somewhat conservative | Moderate | Somewhat liberal | Very liberal | |
| 5/6-15/24 | 25 | 32 | 31 | 10 | 2 |
| 3/18-28/24 | 25 | 32 | 33 | 8 | 3 |
| 2/5-15/24 | 21 | 34 | 33 | 7 | 5 |
| 11/2-7/23 | 21 | 35 | 32 | 7 | 5 |
| 9/18-25/23 | 20 | 37 | 32 | 7 | 3 |
| 7/7-12/23 | 27 | 35 | 28 | 7 | 3 |
| 5/8-18/23 | 24 | 33 | 30 | 10 | 3 |
| 3/13-22/23 | 23 | 35 | 34 | 6 | 2 |
| 1/9-20/23 | 22 | 37 | 31 | 8 | 2 |
| 11/15-22/22 | 25 | 36 | 32 | 6 | 2 |
| 9/7-14/22 | 29 | 35 | 27 | 5 | 3 |
| 7/5-12/22 | 34 | 33 | 21 | 7 | 3 |
| 5/9-19/22 | 23 | 33 | 34 | 8 | 2 |
| 3/14-24/22 | 15 | 37 | 36 | 10 | 2 |
| 1/10-21/22 | 17 | 38 | 35 | 8 | 2 |
| 11/1-10/21 | 15 | 35 | 39 | 8 | 1 |
| 9/7-16/21 | 16 | 35 | 40 | 7 | 2 |
| 7/16-26/21 | 13 | 37 | 42 | 6 | 1 |
| 9/8-15/20 | 5 | 30 | 54 | 9 | 2 |
| 9/3-13/19 | 5 | 33 | 50 | 9 | 3 |
| Marquette Law School Poll, national surveys, latest: May 6-15, 2024 | |||||
| Question: In general, would you describe each of the following… The U.S. Supreme Court | |||||
About the Marquette Law School Poll
The survey was conducted May 6-15, 2024, interviewing 1,033 adults nationwide, with a margin of error of +/-4.3 percentage points. Interviews were conducted using the SSRS Opinion Panel, a national probability sample with interviews conducted online. The detailed methodology statement, survey instrument, topline results, and crosstabs for this release are available on the Marquette Law School Poll website. Some items from this survey are held for later release.