Who Are the Old Folks in Prison? Part I

An image of a prison guard towerNationally, the number of senior citizens in prison has grown dramatically in recent years. In Wisconsin, for instance, the number of prisoners aged 60 or older grew from just 202 (or 1.2 percent of the total) in 2000 to 1,231 (5.4 percent) by the end of 2016. Such increases should be of public concern for a number of reasons, including the exceptionally high costs of incarcerating the elderly. To a great extent, these costs are related to the prevalence of chronic illnesses and physical and mental disabilities among older inmates. One national study estimated that the average cost of imprisoning a senior is about twice the overall average. In general, it is less costly to manage chronic health problems in the community than in prisons, which are not designed to function as assisted living facilities, and which tend to be located in rural areas at some distance from specialized treatment providers.

Fiscal and humanitarian concerns alike have sparked considerable interest in recent years in “compassionate release” and other mechanisms that might hasten the return of elderly prisoners to the community. On the other hand, there are also countervailing concerns that early release might endanger the public or depreciate the seriousness of the underlying criminal offenses. On both sides of the debate, there seems a tendency to rely on unexamined stereotypes about who the old folks in prison are—the frail, harmless grandparent serving an excessively harsh sentence for a long-ago offense, versus the confirmed predator whose dangerousness can never be fully erased by age.

In order to develop a clearer picture of this population, and with the help of two diligent research assistants[1], I set out to gather some data on the Wisconsin prisoners who are aged 70 or older.  (more…)

Continue ReadingWho Are the Old Folks in Prison? Part I

Wisconsin 2018: a shift toward the Democrats, but not a uniform one

In a recent article for the Milwaukee Journal Sentinel, Craig Gilbert described how Scott Walker’s 2018 election loss was the result of declining support across all kinds of populous villages and cities in Wisconsin.[1] Walker averaged a 10% decline in places with at least 30,000 people, a 9% decline in places with 10,000 to 30,000, a 6% decline in places with 5,000 to 10,000, and a 3% decline in places with 2,000 to 5,000 residents. Things improved for Walker in Wisconsin’s numerous small communities. His performance fell by just 0.6% in municipalities with 1,000 to 2,000, and he actually improved over 2014 in communities with less than 1,000 residents. The overall trend is shown in the graph below. Even though Walker beat his 2014 performance in over 40% of Wisconsin communities, these places only represent 16% of the state’s adult citizens. An uneven Democratic wave I divide the state’s communities into 6 categories based on their shift between the 2012 and 2016 presidential elections.[2] FLIP BLUE: 5 communities turned blue in 2016 (pop. 17,000). FLIP RED: 543 communities turned red (pop. 847,000). TRUMP ENTHUSIASTIC: 977 communities voted for Romney and Trump, and gave Trump an even larger victory (pop. 1,631,000) TRUMP SKEPTICAL: 85 communities voted for Romney and Trump, but gave Trump a narrower victory (pop. 700,000). CLINTON ENTHUSIASTIC: 46 communities voted for Obama and Clinton, and gave Clinton an even larger victory (pop. 582,000). CLINTON SKEPTICAL: 213 communities voted for Obama and Clinton, but gave Clinton a narrower victory (pop. 1,937,000). Clinton Enthusiastic places include Madison and some of the mostly-wealthy Madison and Milwaukee suburbs. Clinton Skeptical areas include the more peripheral Madison-area suburbs as well as some of the traditional northwestern Democratic strongholds. The only two places of any size which flipped blue are River Falls and Hudson–both located in the St. Paul suburbs. Communities which flipped red are strewn across the western half of the state with concentrations in the southwestern Driftless Area as well as the northwestern Lake Superior coastal counties of Douglas, Bayfield, and Ashland. Trump Enthusiastic areas cover most of the remaining rural northern half of the state. Trump Skeptical areas are predominantly located outside of Milwaukee in suburban Waukesha and Ozaukee counties. 2018 was a Democratic wave year, and Evers improved over Mary Burke’s margin in every type of community. However, the 2012-2016 shifts described above still had enduring consequences for the 2018 gubernatorial race. Summarizing the entire vote in each category reveals that Walker won the vote in communities which flipped red in 2016 while Evers narrowly won in places which flipped blue. But the largest and most notable shifts relative to 2014 occurred in Clinton Enthusiastic and Trump Skeptical places, which shifted 13% and 12% toward the Democrats, respectively. These categories represent the two partisan poles of the state. Evers won Clinton Enthusiastic places by 47%; he lost Trump Skeptical places by 29%. But the trend in each place was nearly identical–a double-digit swing toward the Democrats. In other words, the areas…

Continue ReadingWisconsin 2018: a shift toward the Democrats, but not a uniform one

Minimizing the Risk of Lead Intake at Schools

It might come as a surprise to learn that federal law does not require public or private schools to test their drinking water sources for lead or for any other contaminant. Instead, the Safe Drinking Water Act operates by regulating the “public water systems” that deliver water to the schools. Too often, this broad focus on public systems overlooks the potential contamination sources on private (or school) property, such as lead service lines and indoor lead plumbing “fittings”—valves, bends, and the like. This gap in federal law presents an important opportunity for state intervention.

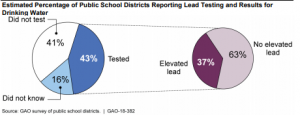
Indeed, the loophole has already led to some disturbing results. In Detroit, for example, officials found unsafe lead and copper levels at 57 of 86 schools tested. Testing in Vermont recently revealed lead contamination in over a dozen schools. And here in Milwaukee, testing showed high lead levels at 183 of Milwaukee Public School’s 3,000 drinking fountains, and at 28 of 425 water outlets tested at charter schools. Worse yet, a recent federal report shows that more than half of public school districts don’t test their water for lead at the point of delivery. Those that did test often found elevated levels of lead, as illustrated in the report’s summary figure:

Graphic showing lead testing by public school districts

(more…)

Continue ReadingMinimizing the Risk of Lead Intake at Schools