Gunfire Trends in Milwaukee, 2017-2023
A review of the Milwaukee Police Department’s call logs indicates that gunfire more than doubled during the pandemic in much of the city. At the same time, the likelihood any given gunfire incident was accompanied by a 911 call reporting “shots fired” declined on the north side, but not the south side. Data from the first 5 months of 2023 shows a modest decline in gunfire compared to the height of the pandemic-era violent crime wave, but levels remain much higher than 2019.
The trouble with just measuring reported crime
Milwaukee’s use of ShotSpotter technology provides a unique opportunity to measure a specific kind of crime in a way that doesn’t entirely depend on crime reports. This is helpful because the likelihood that a given crime is reported to the police varies by time and place.
During the COVID-19 pandemic, violent crime spiked in many American cities. Milwaukee set three annual homicide records in a row. After recording 97 homicides in 2019, the city endured 190 in 2020, 193 in 2021, and 214 in 2022 (according to MPD annual reports). The previous record was 168 in 1991, when the city’s population was about 50,000 more than today.
The summer of 2020 also saw massive protests against police killings of Black Americans, following the murder of George Floyd by officers in Minneapolis. Estimates suggest that between 15 and 26 million adults participated in demonstrations across the country during May and early June, making them the largest in American history.
Local crime trends are almost always measured by counting police reports, but these are, by definition, merely reported crimes. The rate at which actual criminal incidents are reported to the police no doubt varies among communities, by type of crime, and over time. The intense scrutiny of policing during the summer of 2020 may well have altered many Milwaukeeans’ likelihood of contacting the police.
The pandemic crime wave coincided with increased controversy over policing, making the relationship between reported crime and actual crime rates even more uncertain. Still, we do have objective data on both occurrences and reports for one type of crime–gunfire.
ShotSpotter uses a network of acoustical sensors to detect and triangulate the locations of gunshots based on the resulting soundwaves. The system covers only a portion of Milwaukee–one section on the north side and a smaller section on the south side. From a technical perspective ShotSpotter seems fairly accurate. An independent quantitative audit of company-provided data found the system was 97% accurate with about a 0.5% false positive rate.
Politically, ShotSpotter is more controversial. Various national organizations criticize the program as an expensive form of police surveillance with little evidence of actual reductions in violence. On the other hand, many local Milwaukeeans, including community activist Vaun Mayes, Director of the Office of Violence Prevention Ashanti Hamilton, and Chair of the Fire & Police Commission Ed Fallone all expressed at least qualified support for the program in recent interviews with the Shepherd Express.
ShotSpotter trends
Every time the ShotSpotter system reports a gunshot, it is logged into the MPD 911 call log under the code “SHOTSPOTTER.” When a human calls 911 to report gunfire, it likewise is logged with the code “SHOTS FIRED.” Each report includes a timestamp and address.
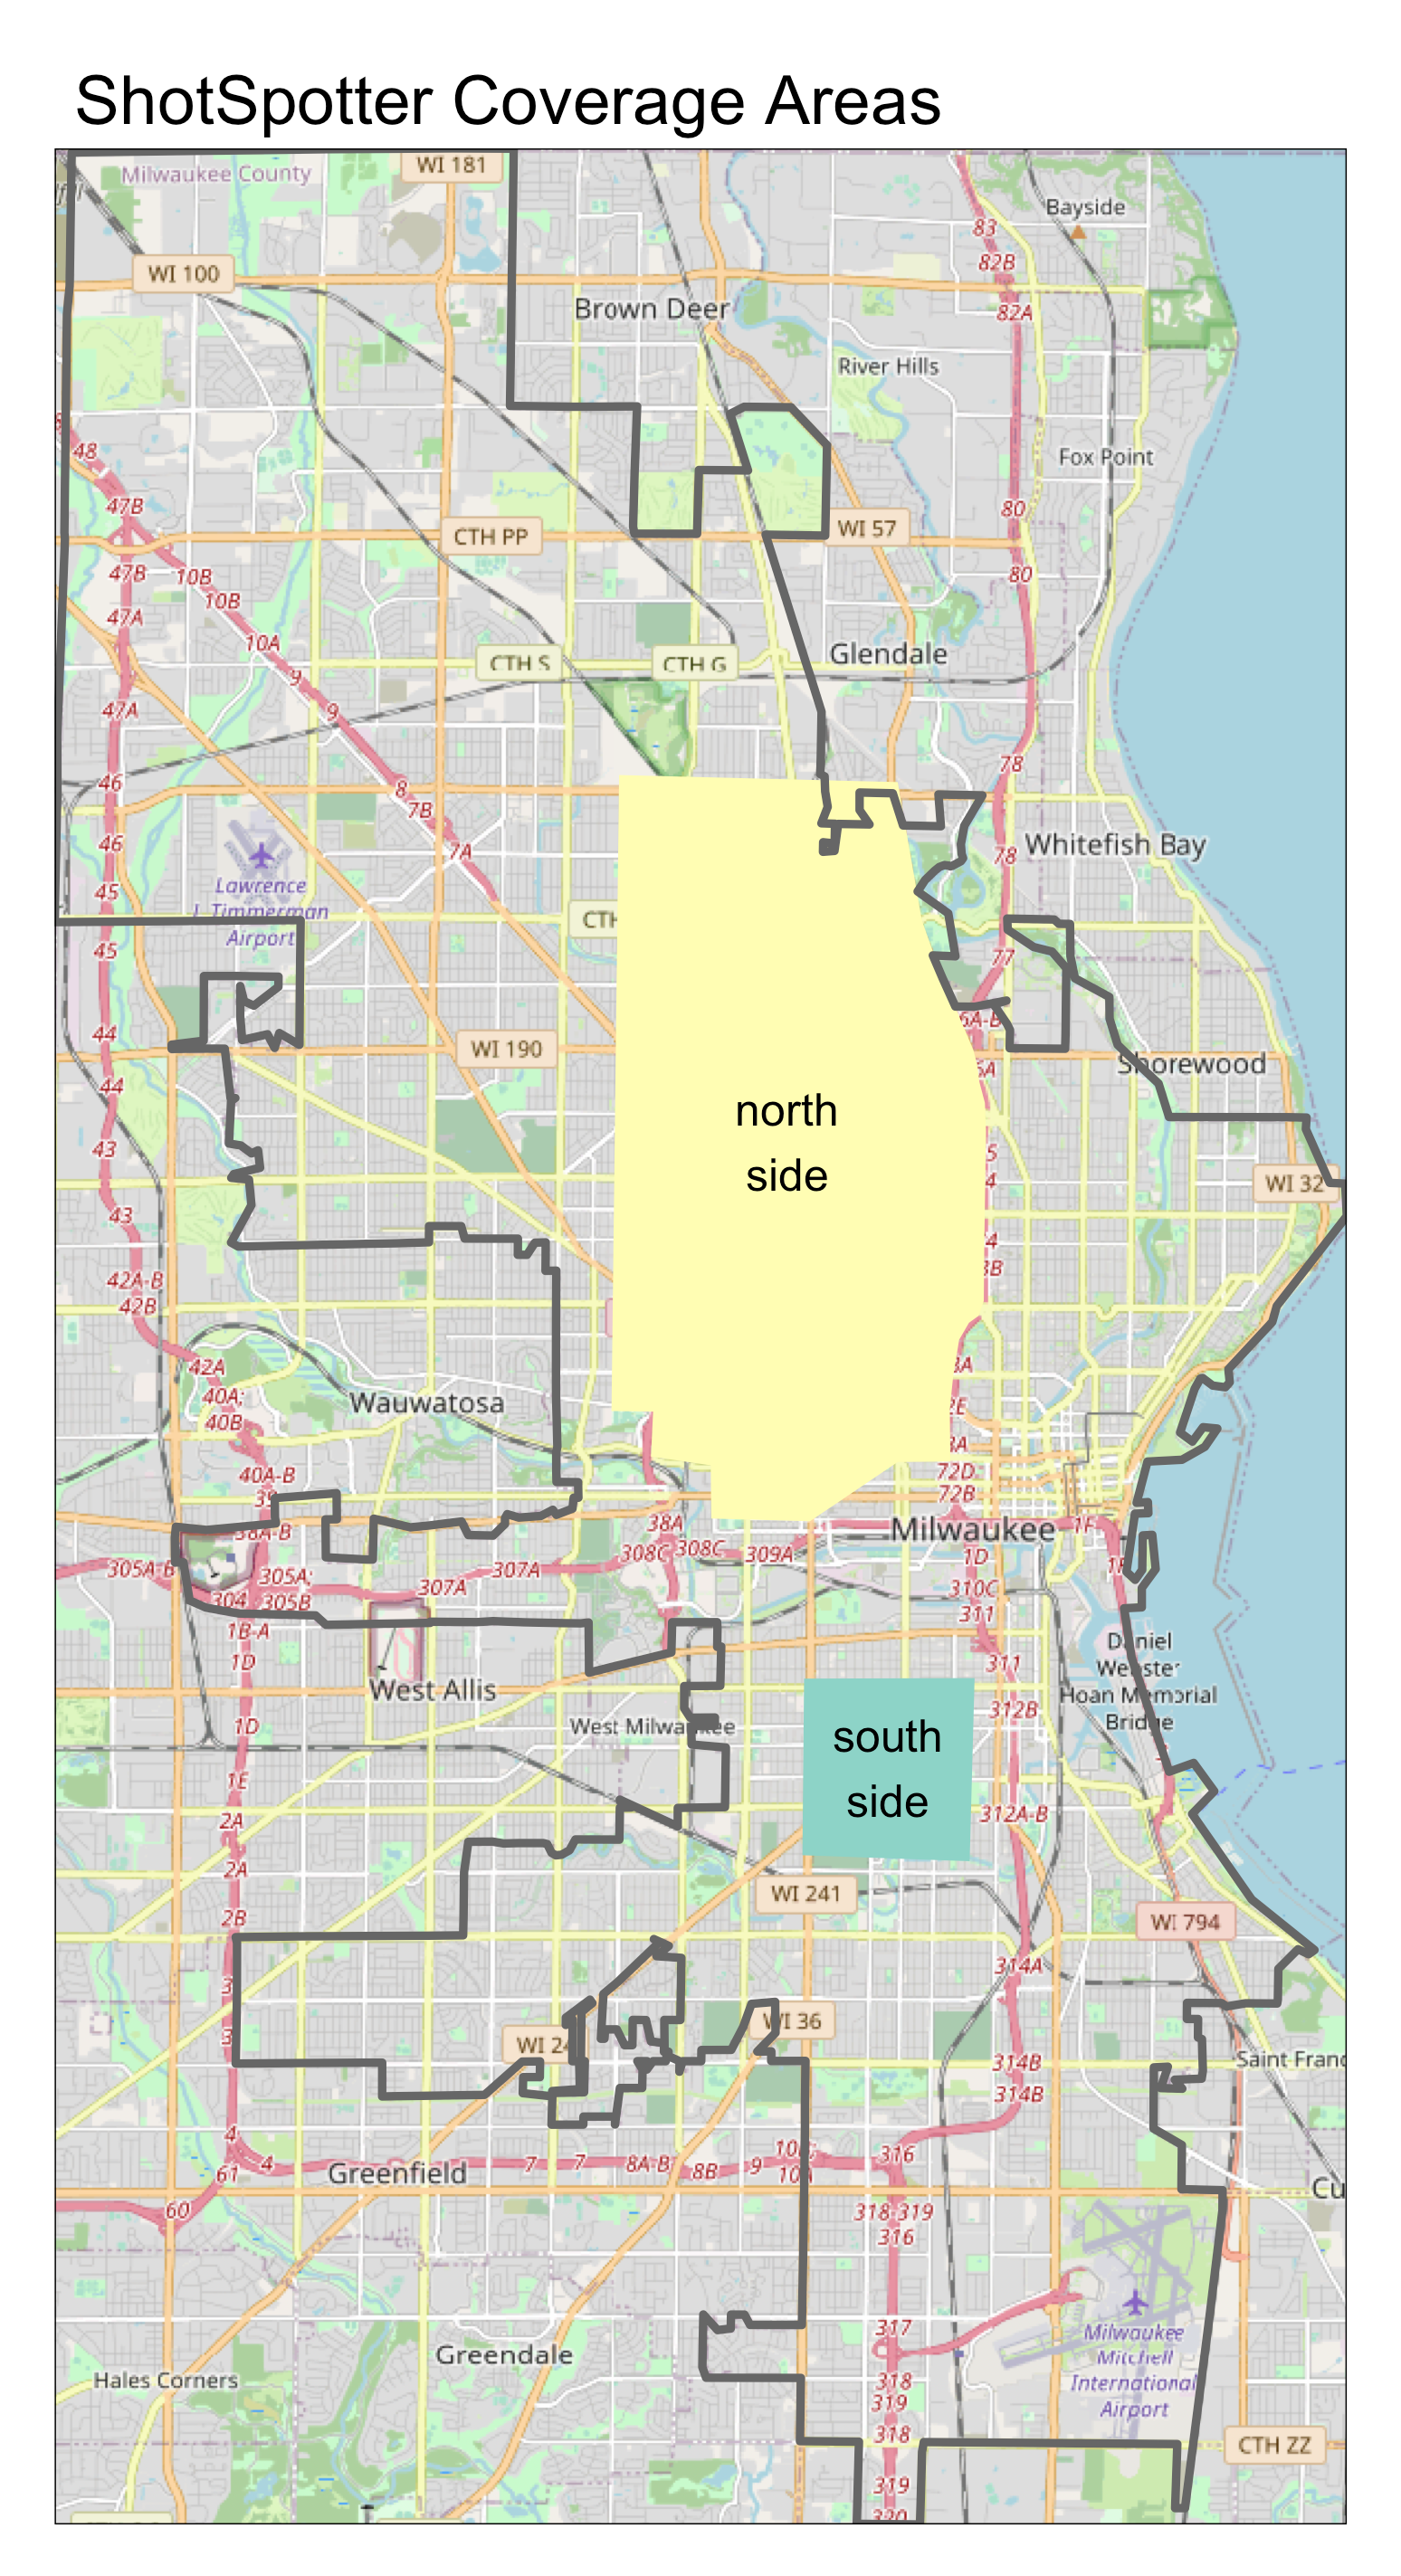
All call log data is published publicly, but the Milwaukee Police Department only keeps 1 hour of incidents online. I obtained records from local software developer Nick Gartmann, who maintains a public repository of historic MPD call logs. He generously provided data covering December 2016 through May 2023, with a few gaps of missing data. The Milwaukee Police Department refused to tell me the boundaries of the ShotSpotter coverage area, but a public information officer did confirm that the coverage area remained unchanged throughout this period. Using the addresses from the call log, I was able to reconstruct the ShotSpotter service areas as shown below.
Roughly, the north side coverage area stretches from I-43 to about 50th St., between the Menomonee Valley to the south and Capitol Drive to the north. The much smaller south side coverage area stretches from about 9th St. to 27th St., from Greenfield Ave. on the north to somewhat south of Lincoln Ave.
Beginning in the summer of 2020, the ShotSpotter data shows an enormous increase in gunfire on the north side coupled with a large increase on the south side.
The north side coverage area recorded an average of 16.1 shots per day in 2019, increasing to 29.6 in 2020 and 39.2 in 2021. Gunfire ticked down slightly in 2022, to 37.5 per day.
The south side coverage area is much smaller. It saw a daily average of 2.9 ShotSpotter reports in 2019. That increased to 3.8 in 2020 and 4.2 in 2021, before falling back to 3.8 last year.
In the month of May alone, ShotSpotter recorded 25 incidents per day on the north side in 2017, falling to 15 in 2018, and 16 in 2019. That jumped to 31 in 2020 and 46 in 2021, before dipping to 42 in 2022 and 36 in 2023. The pattern on the south side has been generally similar.
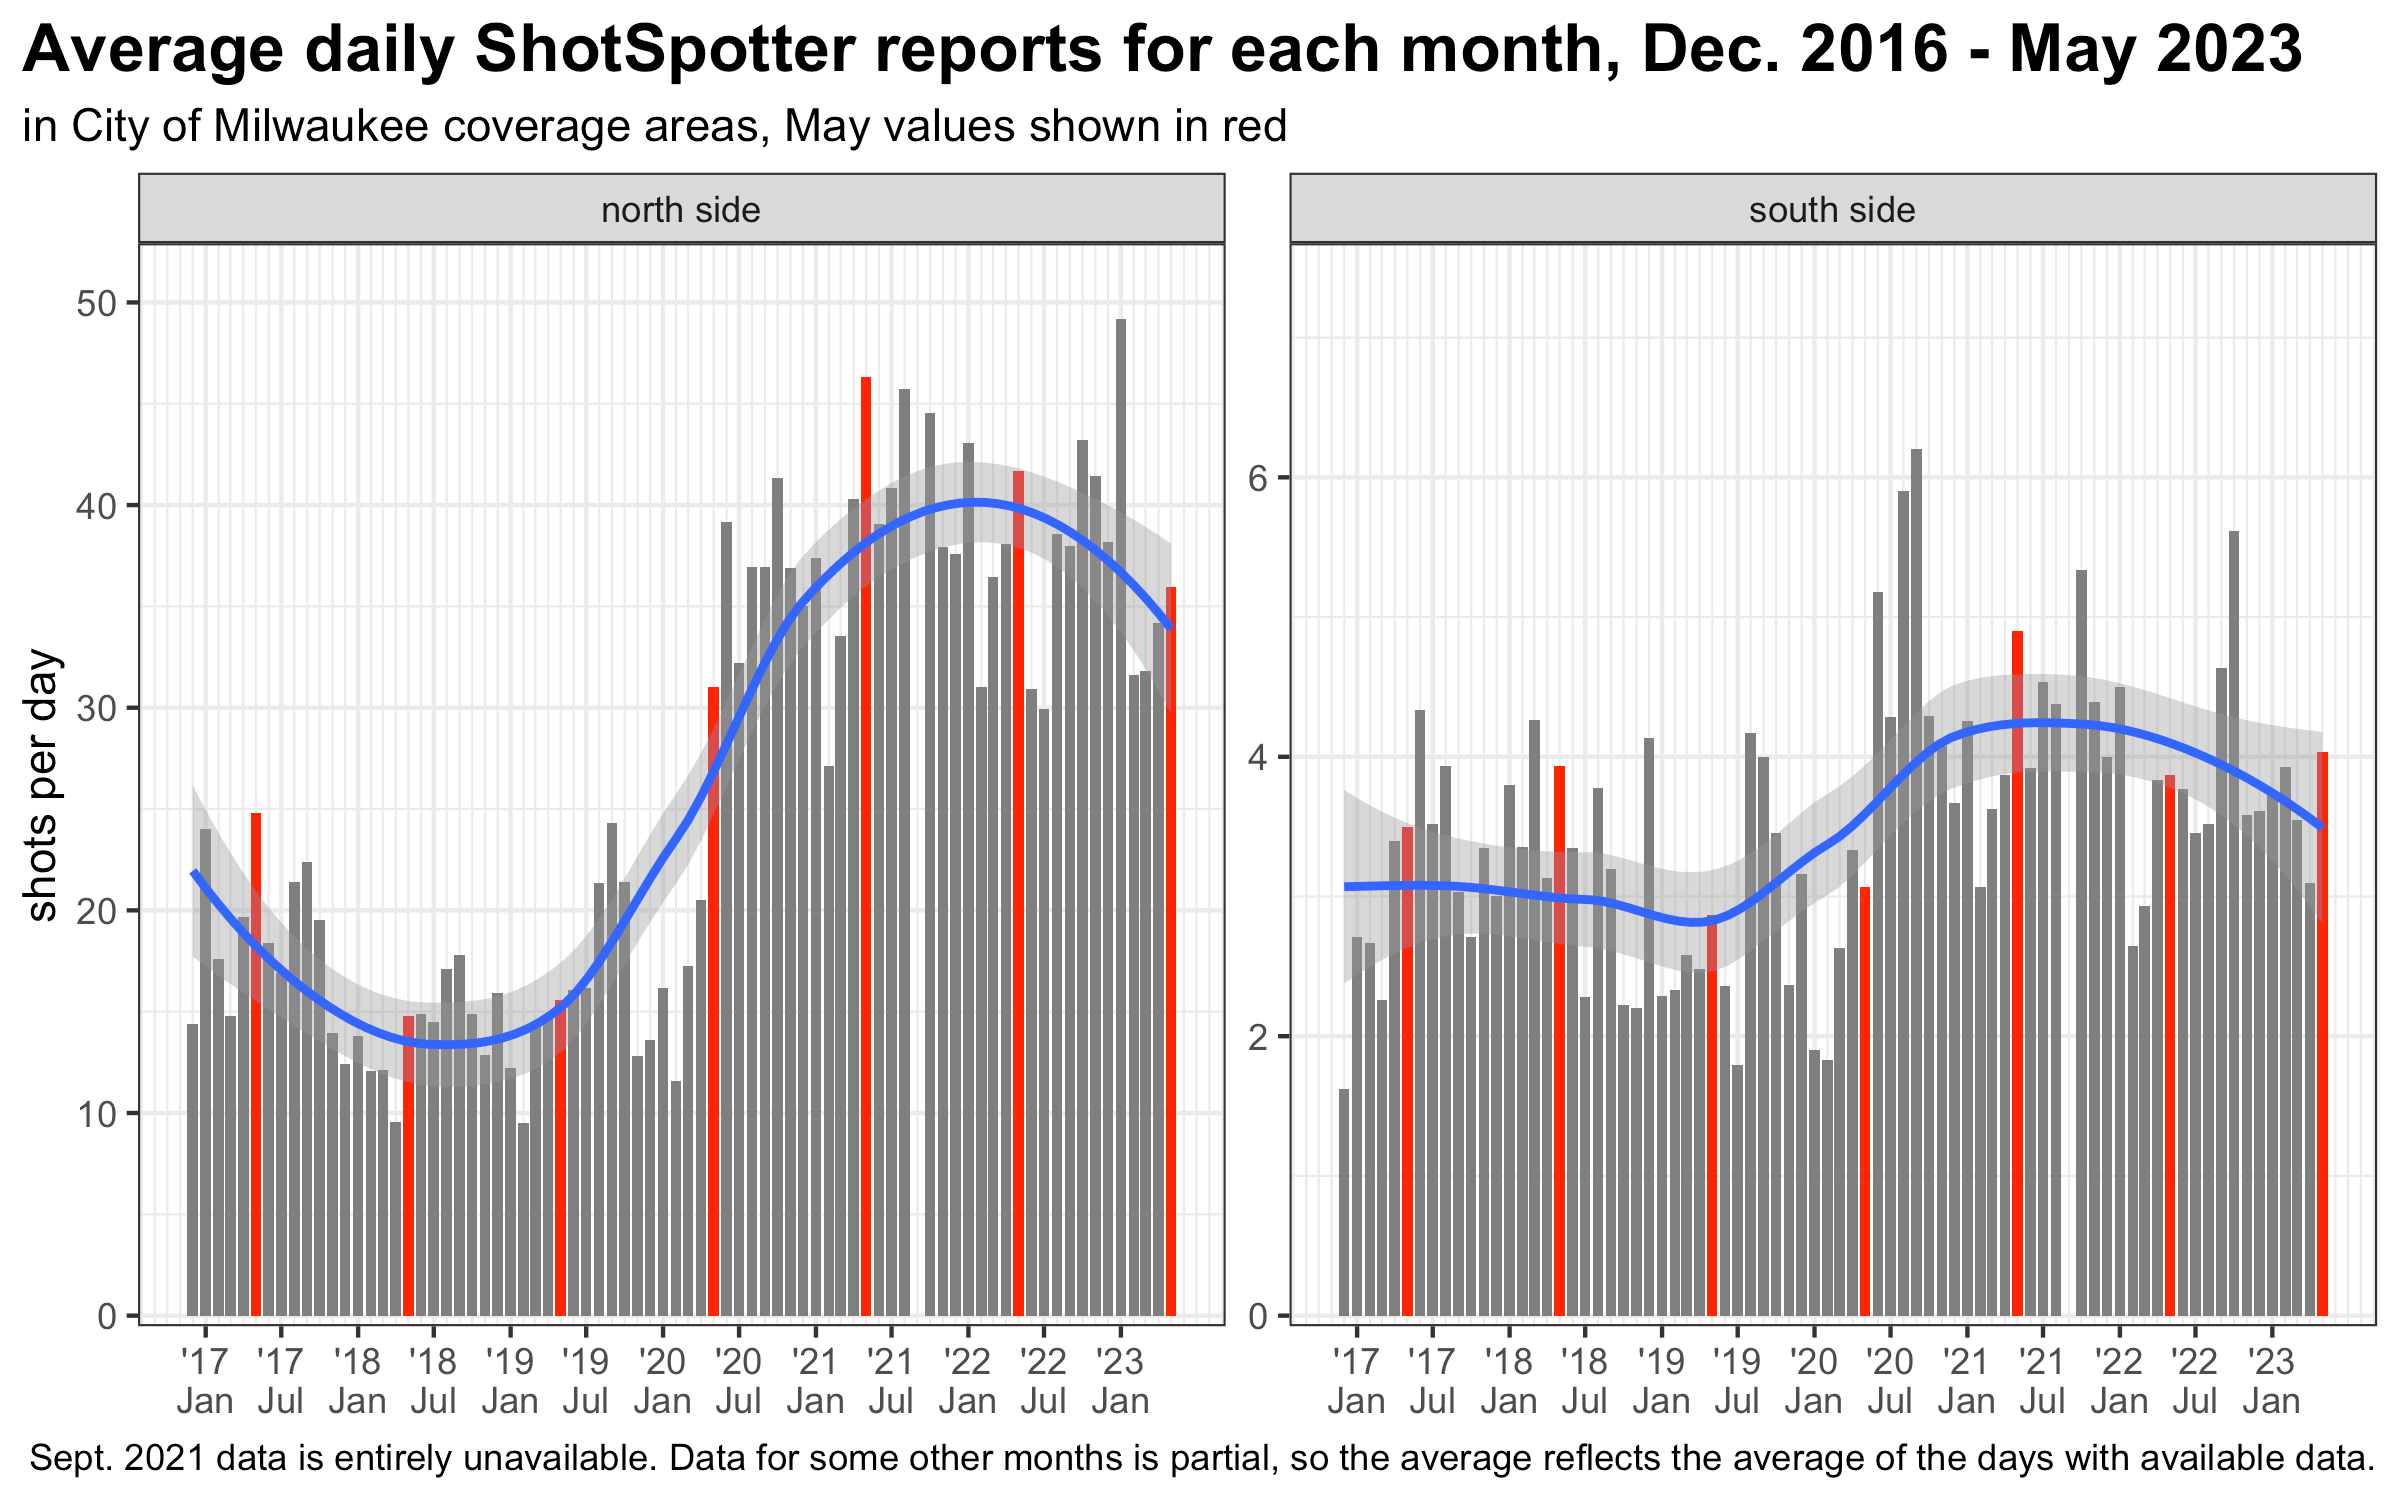
In 2023, ShotSpotter incidents through May are slightly down since last year in the north side and slightly up on the south side. Compared to Jan – May of 2019, ShotSpotter reports are still up by 172% on the north side, compared with a 48% increase on the south side.
Average ShotSpotter reports per day in City of Milwaukee coverage areas
| year | annual | Jan – May | ||
|---|---|---|---|---|
| north side | south side | north side | south side | |
| 2017 | 19.3 | 3.2 | 20.2 | 2.9 |
| 2018 | 14.2 | 3.3 | 12.2 | 3.7 |
| 2019 | 16.1 | 2.9 | 13.5 | 2.5 |
| 2020 | 29.6 | 3.8 | 19.2 | 2.5 |
| 2021 | 39.2 | 4.2 | 38.2 | 4.1 |
| 2022 | 37.5 | 3.8 | 38.0 | 3.5 |
| 2023 | — | — | 36.7 | 3.7 |
| Analysis of MPD call logs by John Johnson. Records are missing for some days, so this show the average for available days in each period. | ||||
ShotSpotter incidents vs. reports
To get a sense of how often gunshots identified by ShotSpotter also result in a 911 call, I applied the following simple test. I drew a circle with a half mile radius around the ShotSpotter alert location. Then, I checked if a contemporaneous 911 call for “shots fired” had occurred at any point inside that circle. To account for delays in the ShotSpotter upload process, I included any call that occurred within 10 minutes either before or after the ShotSpotter timestamp.
The graph below shows the results in the north and south side coverage areas for the past 7 years.
Only a small fraction of gunshots are reported to the police. Based on this analysis, just 5.1%, or about 3,300 out of 63,900 ShotSpotter reports since 2017 have been accompanied by a 911 call reporting “shots fired” within 10 minutes and half a mile of the identified location.
In 2017, similar shares of ShotSpotter reports resulted in 911 calls on both the north and south side coverage areas. Since then, the trajectories have diverged.
On the north side, the share of shots accompanied with a 911 call has declined every year beginning in 2019. The share of calls being reported has dropped from 5.7% in 2017 to 3.6% in 2023 through May. That’s a decline of more than a third.
On the south side, the share of ShotSpotter reports accompanied with a 911 call hovered between 5.1% and 6.2% throughout 2017-2022. Through May of this year, it has shot up to 7.6%. Through the first 5 months of 2023, gunshots appear to be twice as likely to result in a 911 call in the south side service area than the north side service area. That gap didn’t exist before the pandemic.

Implications
This data reinforces the importance of remembering that crime reports are just that–incidents residents actively choose to report to the police. In conversation, I’ve heard from many Milwaukee residents that they rarely report gunfire and property crime to the police, simply because they view it as a pointless and frustrating waste of time. This data analysis indicates that (1) only a very small share of gunfire incidents are ever called in to 911, and (2) that small share has declined even further on the north side of the city, as the frequency of shootings more than doubled during the pandemic.